Analyze six trending dropshipping categories for 2026 using real margin and return rate data, revealing jewelry and accessories as the top-performing niche.
Published:
September 18, 2026
Author:
Yi Cui
Most "trending products" lists are copy-paste generics written in January by someone who doesn't run a store. This one uses real platform data across categories — and yes, includes the niche that keeps outperforming everything else.
Here is the problem with most trending-product articles: they are written too early, rely on search volume alone, and have zero margin context. A product can be trending on Google and still be a terrible dropshipping choice if the return rate is 28% and the gross margin barely clears 20%. This article is different. We pulled cross-platform signals from Google Trends, TikTok Shop, and supplier data, layered in category-level return rate and margin benchmarks, and added proprietary performance data from Branvas to give you a complete picture of what is actually worth selling right now.
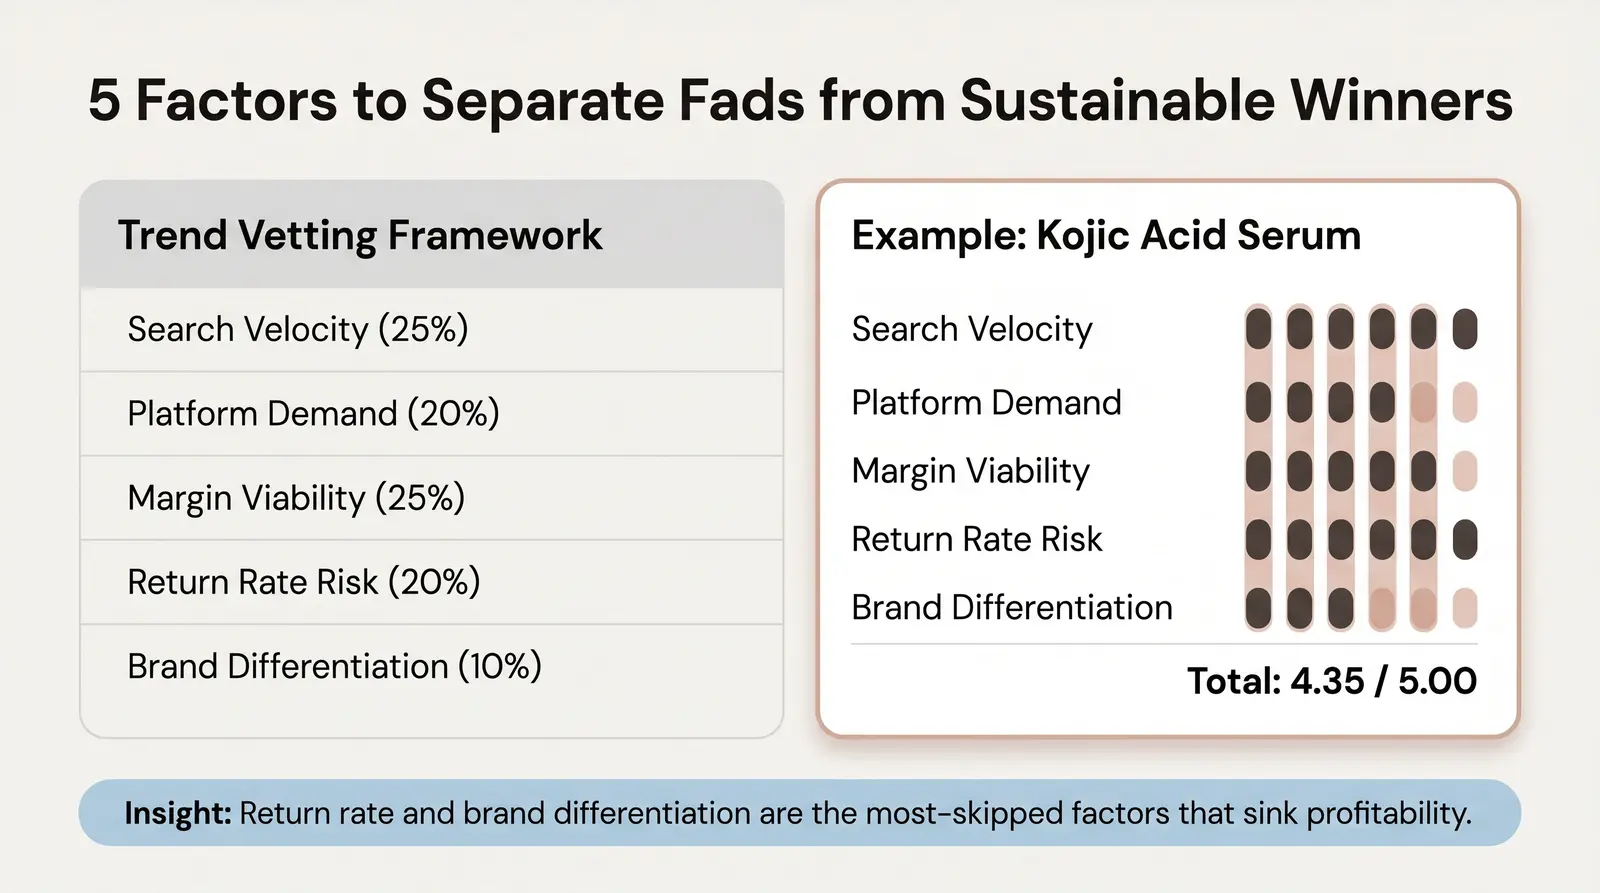
To separate fleeting fads from sustainable winners, we use a proprietary 5-factor scoring rubric called The Branvas Trend Vetting Framework™. This is the exact system Branvas uses internally to assess whether a trending product is worth adding to a dropshipping catalog.
| Factor | What to Assess | Weight |
|---|---|---|
| Search Velocity | 90-day Google Trends trajectory | 25% |
| Platform Demand Signal | TikTok/Instagram engagement + hashtag growth | 20% |
| Margin Viability | Gross margin after COGS + shipping at typical ASP | 25% |
| Return Rate Risk | Category average return rate (%) | 20% |
| Brand Differentiation Potential | Can this be private-labeled or customized? | 10% |
To score a product, rate each factor from 1 to 5, then multiply by the weight and sum the results. Here is a fully worked example using the trending Kojic Acid Serum in the beauty category.
| Factor | Score (1–5) | Weight | Weighted Score |
|---|---|---|---|
| Search Velocity | 5 | 25% | 1.25 |
| Platform Demand Signal | 4 | 20% | 0.80 |
| Margin Viability | 4 | 25% | 1.00 |
| Return Rate Risk | 5 | 20% | 1.00 |
| Brand Differentiation Potential | 3 | 10% | 0.30 |
| Total | 4.35 / 5.00 |
Kojic acid serums moved fast in 2025–2026 because consumers want brighter skin without expensive clinic treatments. TikTok and Instagram drove mass awareness. The gross margin is strong because the product is lightweight and inexpensive to source. Return rates for unopened skincare are very low (1–5%) [1]. The only weakness is brand differentiation — many sellers are now offering similar formulations, so custom branding and packaging become the differentiator.
In our experience at Branvas, the two factors sellers most often skip are return rate risk and brand differentiation potential — and those are usually the two that sink profitability at scale.
These six categories are ranked by combined signal strength using the Branvas Trend Vetting Framework. We analyzed platform demand, margin data, and return rate benchmarks to give you a complete picture. Note that the global dropshipping market is valued at $445.5 billion in 2025 and is projected to reach $1.25 trillion by 2030, growing at a CAGR of approximately 22% [2]. The opportunity is real. The question is which category you enter.
Jewelry and accessories is the category most dropshippers overlook — and the one that consistently outperforms everything else on the metrics that actually matter.
Specific trending sub-products in 2026 include demi-fine layering necklaces, personalized name rings, stainless steel waterproof hoops, charm-build-your-own sets, and resin statement earrings. The global demi-fine jewelry market is projected to reach $3.87 billion in 2026, growing to $7.53 billion by 2034 [3]. Online sales of demi-fine jewelry are expanding at a CAGR of 12.4% from 2025 to 2030 [4]. Gen Z and Millennials now drive 70% of online jewelry purchases, and they are buying across price points, not just luxury.
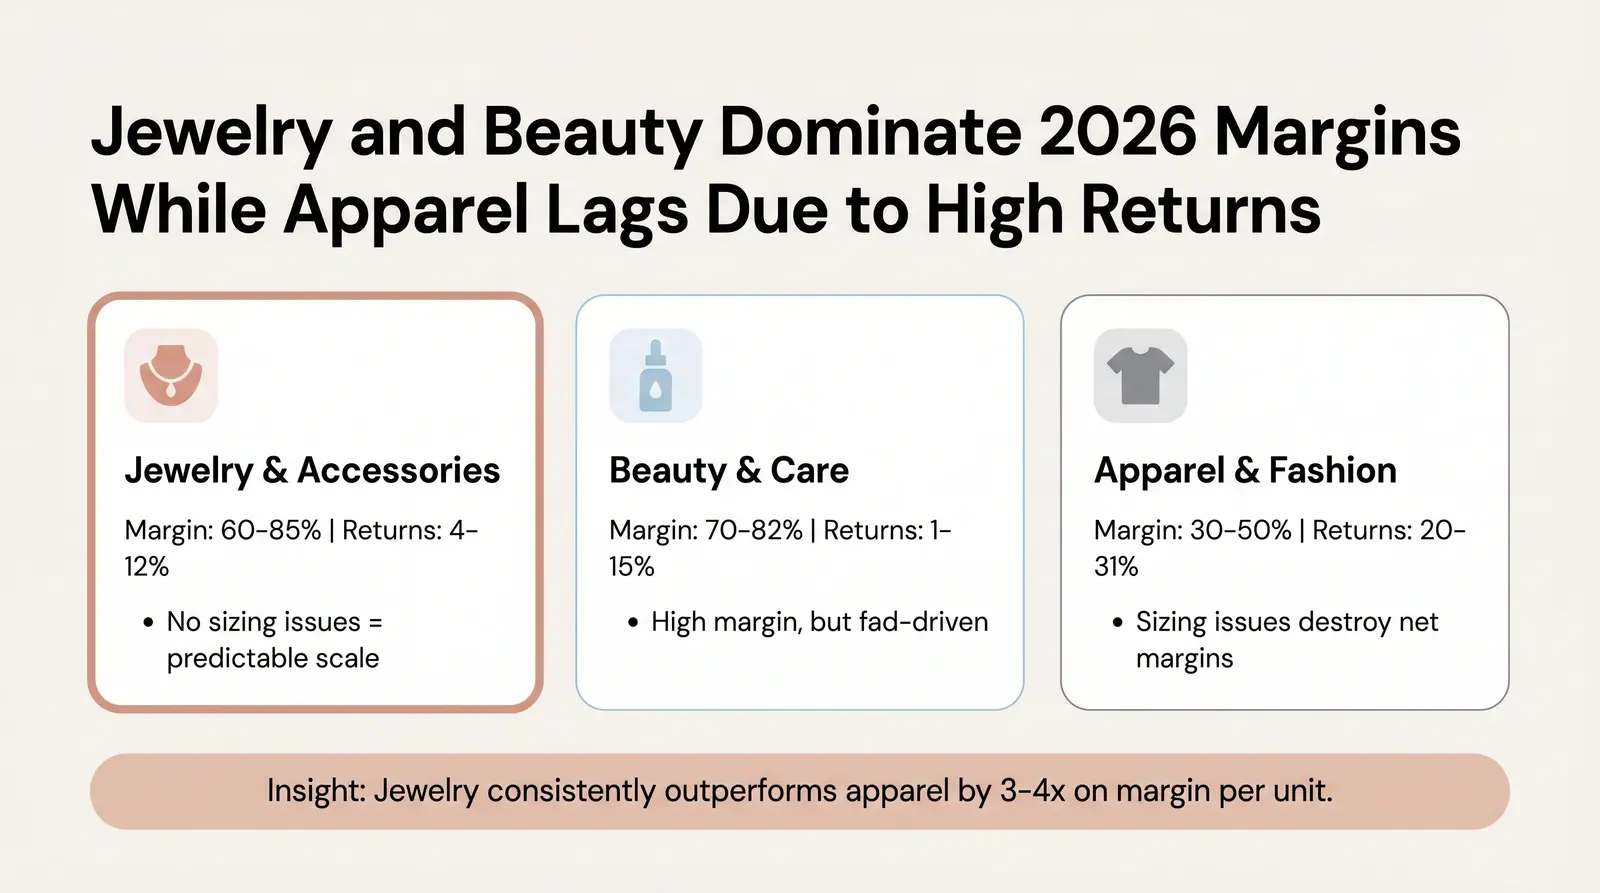
The contrarian insight most dropshippers miss: jewelry has significantly lower return rates than apparel. While online apparel return rates average 25% — with women's fashion hitting 27.8% and fast fashion reaching 28.9% — jewelry returns typically fall in the 4–12% range [1]. The reason is simple: jewelry does not have sizing issues the way clothing does. A necklace that looks good in a photo looks good in person. That predictability is enormously valuable at scale.
When private-labeled, jewelry commands a gross margin of 60–85% [5]. A typical fashion jewelry piece costs $6–18 landed and retails for $24–79. That gap is where the business is built. Personalized jewelry sits at the higher end of the pricing range, with retail prices of $29.99–$79.99 and strong conversion rates because the product feels intentional and gift-worthy.
Based on order and performance data across Branvas seller accounts, jewelry consistently delivered the highest gross margins and lowest return rates of any category we track — often outperforming apparel by 3–4x on margin per unit.
Unlike generic AliExpress jewelry, private-label jewelry creates a brand moat. When a customer buys a necklace with your brand's packaging, they associate the quality with your store, not a supplier. Repeat purchase rates, gifting occasions, and social sharing all compound over time. A customer who buys a layering necklace set is highly likely to return for earrings, a ring, or a gift for a friend.
If you're exploring the jewelry opportunity, Branvas's product catalog is worth a look — it's built specifically for dropshippers and private-label sellers who want to move fast without minimums.
The beauty and personal care sector remains one of the highest-margin categories in dropshipping, with a median gross margin of 81.7% across curated products [6]. The return rate is also favorable: unopened beauty products return at just 1–5%, and skincare averages around 11.2% [1].
Trending SKU types for 2026 include bakuchiol serums (a retinol alternative for sensitive skin), niacinamide body lotions, kojic acid serums, scalp care treatments, and LED face masks. The scalp care market alone is projected to reach $14.7 billion by end of 2025 and $23.8 billion by 2032, driven by the "skinification of hair" trend where consumers apply skincare principles to their scalp routines.
The non-obvious insight here is the shift toward "skinimalism." Consumers are abandoning 10-step routines in favor of multi-purpose, high-efficacy products. A single barrier cream that moisturizes, protects, and primes is more appealing than three separate products. This shift creates an opportunity for sellers who can position multi-functional products clearly. Additionally, TikTok-driven beauty products peak fast and die fast. Hair tinsel, for example, saw 540M+ TikTok views and 18% year-over-year growth in hair accessory sales. The velocity of your launch matters more than perfection. If you catch a micro-trend early, you can capitalize on the surge before the market saturates.
For sellers exploring beauty, the Branvas Academy covers product positioning and brand-building strategies that apply directly to beauty and adjacent categories.
Home decor continues to see steady demand, particularly around Q3 and Q4 when consumers are refreshing their spaces ahead of the holiday season. Trending SKU types include sunset lamps, galaxy projectors, no-drill floating shelves, diatomite bath mats, smart LED light strips, and space-saving closet organizers. Minimalist and aesthetic-forward products perform particularly well on Instagram and Pinterest, where visual appeal drives impulse purchases.
The non-obvious insight is that "home" is a trap category for many dropshippers. The return rate for home decor averages 19.4%, and furniture hits 22.7% [1]. Heavy or bulky items carry shipping costs that can eliminate your margin entirely. Reverse logistics on a couch or large shelving unit can cost more than the product itself. Some brands have moved to "keep it" policies for lower-value items because the return shipping exceeds the salvage value.
The safer sub-niches within home are lightweight, visually striking products: ambient lighting, wall art, and small organizers. These ship cheaply, photograph well for ads, and have lower damage rates in transit. Stick to items under 500 grams and avoid anything that requires assembly or has a high chance of arriving damaged.
Pet ownership rates are at record highs, with over 66% of US households owning at least one pet. The global pet care market continues to surge, with pet food industry revenue alone hitting $147 billion in 2023 and accessories growing even faster [7]. The pet accessories segment — where dropshippers thrive — avoids the logistical headaches of shipping pet food while capturing margins that regularly exceed 50%.
Specific trending products for 2026 include dog cooling mats (retail $24–39, source $6–12), cat water fountains with filtration ($28–45), lick mats and slow feeders (source $2–5, sell $14–22, delivering margins above 60%), pet dental care kits, and portable paw cleaners. Pet return rates are moderate at 8–12%, primarily driven by size issues with collars and beds [1].
The humanization of pets is the key insight most dropshippers miss. Pet owners treat purchases as necessities, not luxuries. They rarely comparison-shop on price alone, and they reorder consumable products monthly. This means branded pet products now command pricing that generic dropship items cannot match. Smart pet technology, such as GPS collar attachments and automated treat dispensers with cameras, is the fastest-growing sub-niche heading into late 2026. These items attract a higher-income demographic that converts more easily and complains less about shipping times [7].
Tech accessories offer strong dollar profit per order, with technology products averaging $114 profit per order in curated product analyses [6]. Trending products include MagSafe-compatible wallets, chargers, and car mounts, cable management solutions, customizable phone grips, USB-C hub adapters, and smart LED desk light strips.
The non-obvious insight is that tech accessories have short trend windows aligned with device release cycles. Selling MagSafe accessories immediately after a new iPhone launch is far more lucrative than selling generic tech gadgets year-round. You must time your entry to product launches, not calendar quarters. Sellers who build a catalog around a specific device ecosystem can dominate a narrow niche with strong search intent and high conversion rates.
The return rate for electronics averages 11%, but the cost per return is significantly higher than other categories — testing, refurbishment, and repackaging can cost $30–65 per return [1]. This means a 10% return rate in tech can cost more per revenue dollar than a 25% return rate in apparel. Choose tech accessories that are simple, durable, and unlikely to malfunction.
Fashion remains a popular dropshipping choice, but it is fraught with challenges. Trending items include bucket hats, oversized scarves, mini crossbody bags, belt bags, and coquette bow accessories. These items tap into current aesthetic trends without requiring the complex sizing logistics of clothing.
Apparel has the highest return rate of any dropship category, averaging 25%, with shoes hitting 31.4% and women's fashion reaching 27.8% [1]. Size and fit issues drive the vast majority of these returns, and each return costs $15–25 to process before accounting for items that cannot be resold at full price. For a $10M apparel brand at a 25% return rate, that translates to $375K–$625K in annual processing costs alone.
Fashion accessories like hats, bags, and scarves are a far safer apparel-adjacent play than clothing. They eliminate sizing risks while still tapping into fashion trends. A canvas tote bag or a bucket hat has no fit issues, ships cheaply, and photographs well for social ads. Sellers who want to play in the fashion space should focus their catalog on accessories rather than clothing to protect their margins.
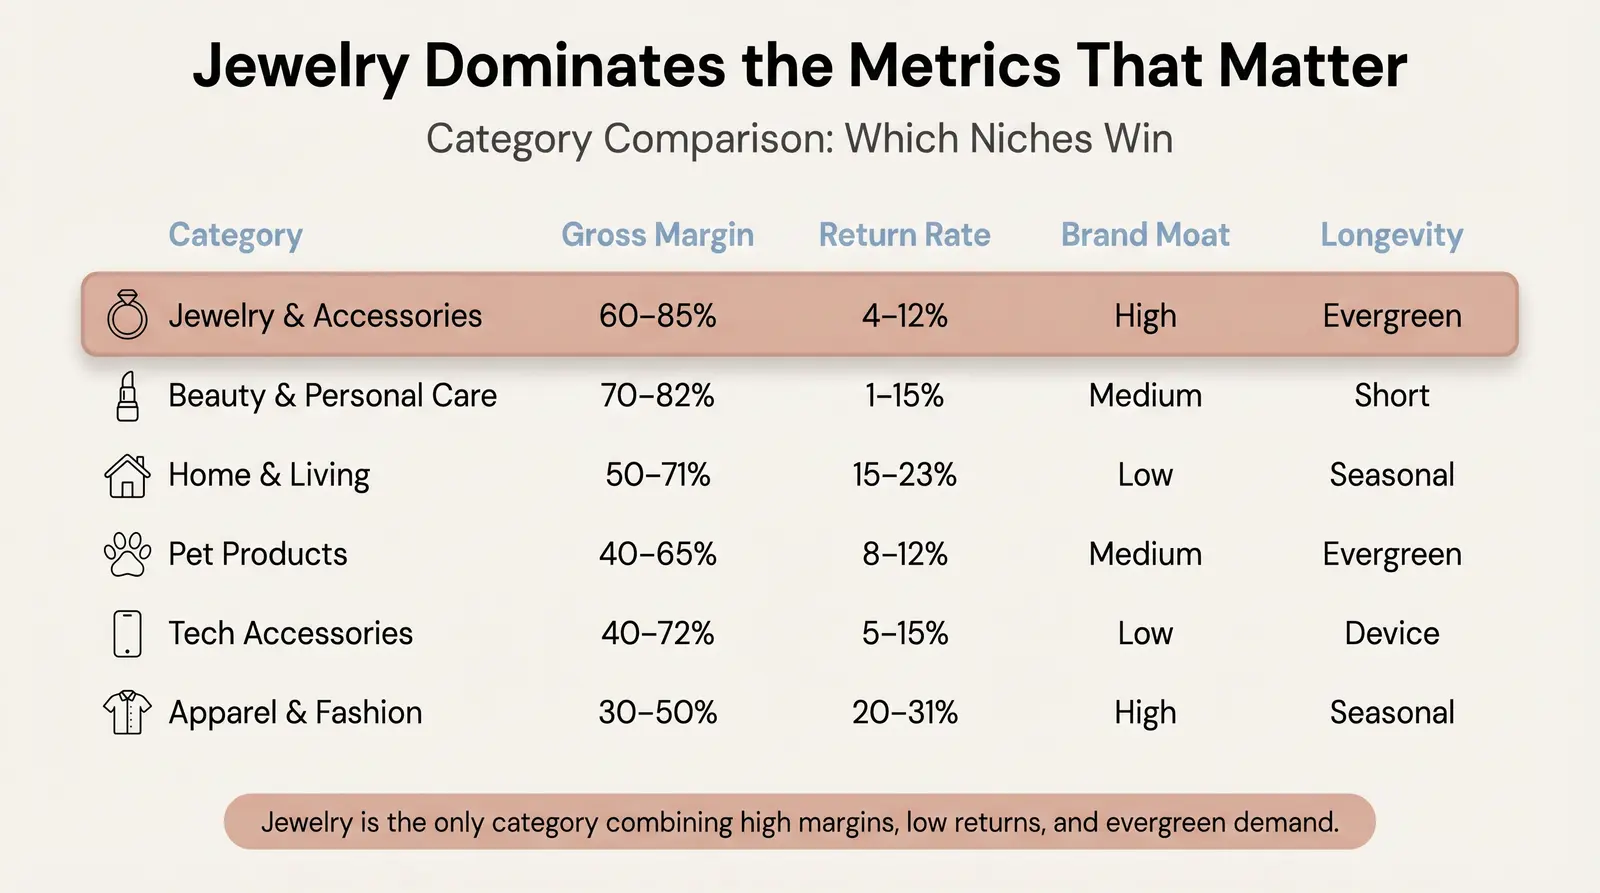
We compared all six categories across four dimensions based on our research and the Branvas framework. Gross margin figures reflect industry benchmarks and Branvas internal estimates.
| Category | Avg. Gross Margin | Avg. Return Rate | Brand Moat Potential | Trend Longevity |
|---|---|---|---|---|
| Jewelry & Accessories | 60–85% | 4–12% | High | Evergreen |
| Beauty & Personal Care | 70–82% | 1–15% | Medium | Short (fad-driven) |
| Home & Living | 50–71% | 15–23% | Low | Seasonal |
| Pet Products | 40–65% | 8–12% | Medium | Evergreen |
| Tech Accessories | 40–72% | 5–15% | Low | Device-dependent |
| Apparel & Fashion | 30–50% | 20–31% | High | Seasonal |
Note: Return rate ranges sourced from Eightx.co 2026 category benchmarks [1]. Margin data compiled from ProductLair analysis [6] and BuckyDrop jewelry data [5]. Branvas internal estimates used where noted.
The jewelry row stands out clearly. It is the only category that combines high gross margins, low return rates, and evergreen demand. Beauty comes close on margins but carries fad-driven trend risk. Apparel offers brand moat potential but the return rate and margin compression make it the hardest category to scale profitably.
When you look at the data objectively, jewelry and accessories emerge as the single best dropshipping category for a seller who wants to build a real, defensible business in 2026. This is not a sales pitch. It is what the numbers show.
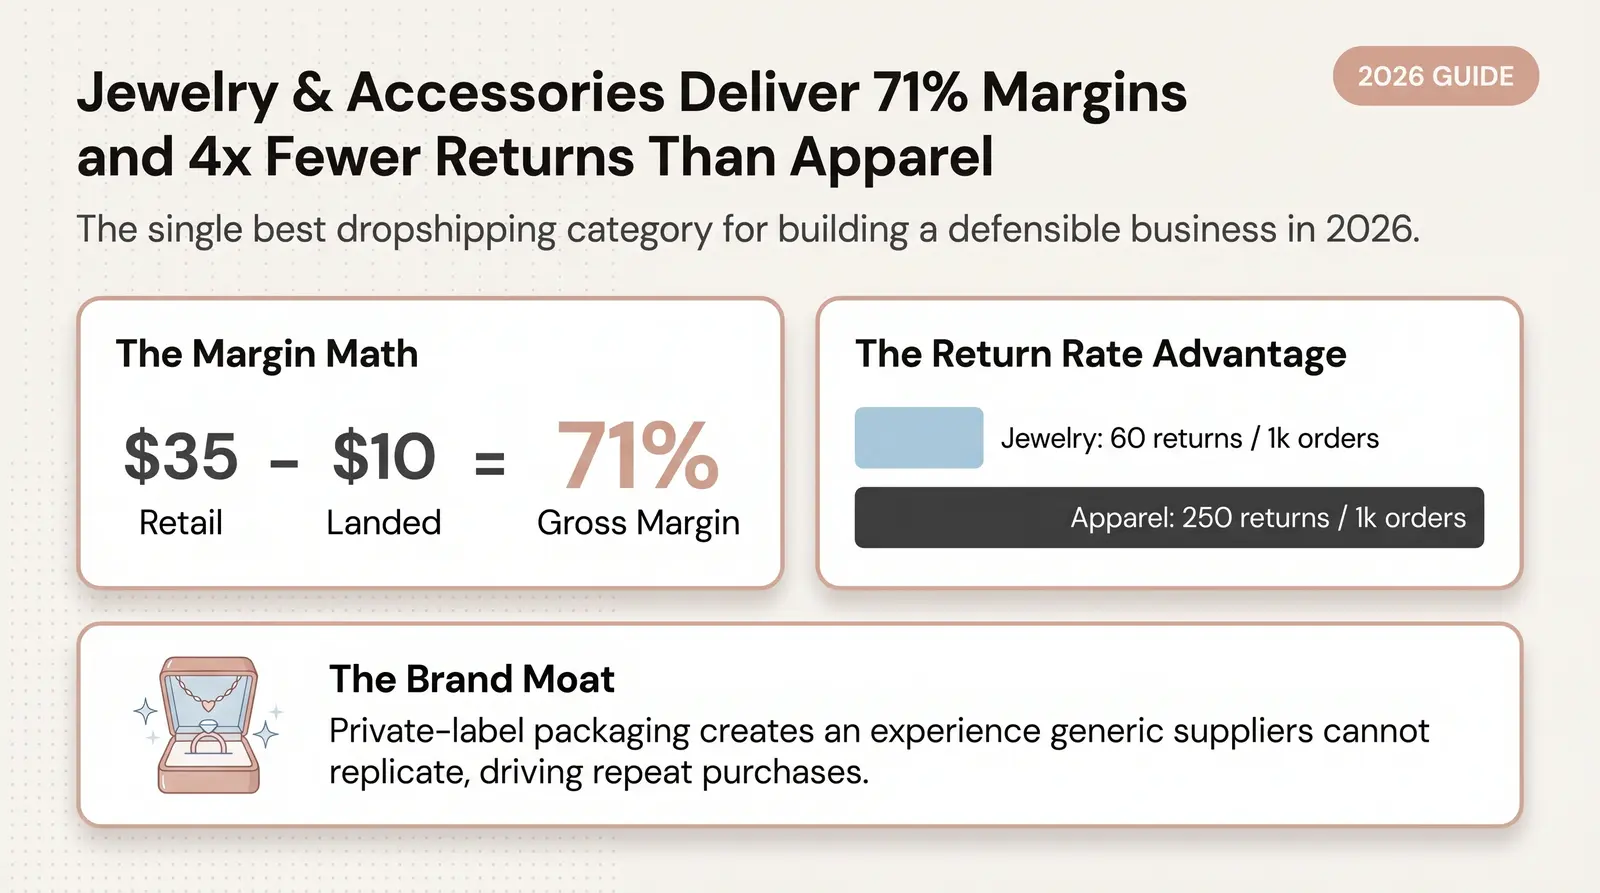
Start with the margin math. A jewelry item that costs $10 landed and retails for $35 delivers a 71% gross margin. After advertising (typically 20–25% of revenue for a well-run store), payment processing fees (3–4%), and platform costs, you are left with a net margin of 35–40% on a well-optimized store. That is exceptional for a physical product business. By comparison, apparel at a 25% return rate can reduce contribution margin by 70%, not 25%, because the cost of processing returns compounds across reverse logistics, labor, and unsellable inventory [1].
The return rate advantage compounds over time. A jewelry seller processing 1,000 orders per month at a 6% return rate handles 60 returns. An apparel seller at the same volume handles 250 returns. At $20 per return in processing costs, that is $1,200 versus $5,000 per month in return costs alone — before accounting for lost margin on unsellable items.
Gifting and repeat-purchase dynamics add another layer. Jewelry is one of the top gift categories year-round, with clear seasonal spikes around Valentine's Day, Mother's Day, and the holiday season. A customer who buys a personalized necklace for themselves is highly likely to return for a gift. These repeat purchase rates are difficult to achieve in categories like tech accessories or home goods, where purchases are more considered and less frequent.
We often see founders come to Branvas after burning months on apparel or tech accessories — the margins looked good on paper until returns and competition compressed them. Jewelry is where they stay.
The common objection is quality concerns and oversaturation. Generic AliExpress jewelry is saturated. Private-label jewelry is not. When you sell branded, high-quality jewelry with custom packaging, you are not competing on price with generic suppliers. You are selling an experience. The customer is not buying a necklace — they are buying a story, a brand, and a feeling. That is a moat that generic dropshippers cannot replicate.
Branvas is built exactly for this: private-label jewelry and accessories, launched under your brand, shipped blind to your customers — with no minimums to start. See how it works at branvas.com/how-it-works or explore the profit calculator to model your margin before you commit.
What are the best dropshipping products to sell in 2026?
The best products solve a specific problem, have high perceived value, and carry low return rates. In 2026, top performers include demi-fine jewelry and accessories, skinimalism beauty products like bakuchiol serums and scalp treatments, smart pet tech, and MagSafe-compatible phone accessories. The key is to apply a vetting framework that accounts for both margin viability and return rate risk before committing to a product. The Branvas Trend Vetting Framework™ outlined above is a practical starting point.
How do I find trending products for dropshipping before they peak?
Use Google Trends to track search velocity over a 90-day period and look for steady upward trajectories rather than chaotic viral spikes. Monitor TikTok and Instagram for emerging hashtags and engagement patterns. Platforms like Exploding Topics surface trends 6–12 months before they hit mainstream awareness. The goal is to identify products in the early growth phase, not at the peak. Timing your launch 4–6 weeks before a trend peaks gives you time to build organic rankings and test ad creative before competition intensifies.
Is jewelry a good dropshipping niche?
Yes, jewelry is one of the most profitable dropshipping niches available in 2026. It offers gross margins of 60–85%, significantly lower return rates (4–12%) compared to apparel (25%), and strong gifting and repeat-purchase dynamics [1] [5]. The key is to avoid generic, unbranded jewelry and instead build a private-label brand. Platforms like Branvas are specifically designed for dropshippers who want to launch branded jewelry without minimums or upfront inventory investment.
What dropshipping niches have the highest profit margins?
Jewelry, beauty, and sports/fitness consistently deliver the highest gross margins, often exceeding 70% [6]. However, gross margin alone does not tell the full story. Net margins depend heavily on return rates and shipping costs. Jewelry and accessories offer the best combination of high gross margins and low operational costs, making them the most profitable category when modeled on a net basis. Sellers on the Branvas platform regularly achieve net margins that outperform apparel by 3–4x per unit.
How do I validate a trending product before investing in inventory?
Score the product using a structured framework that evaluates search velocity, platform demand, margin viability, return rate risk, and brand differentiation potential. Then run a small ad test — $100–200 on TikTok or Meta — to gauge real-world conversion rates and customer acquisition costs before scaling. Track your cost per acquisition against your gross margin to confirm profitability at scale. If the numbers work at small volume, they will generally work at larger volume. If they do not, no amount of optimization will fix a fundamentally low-margin product.