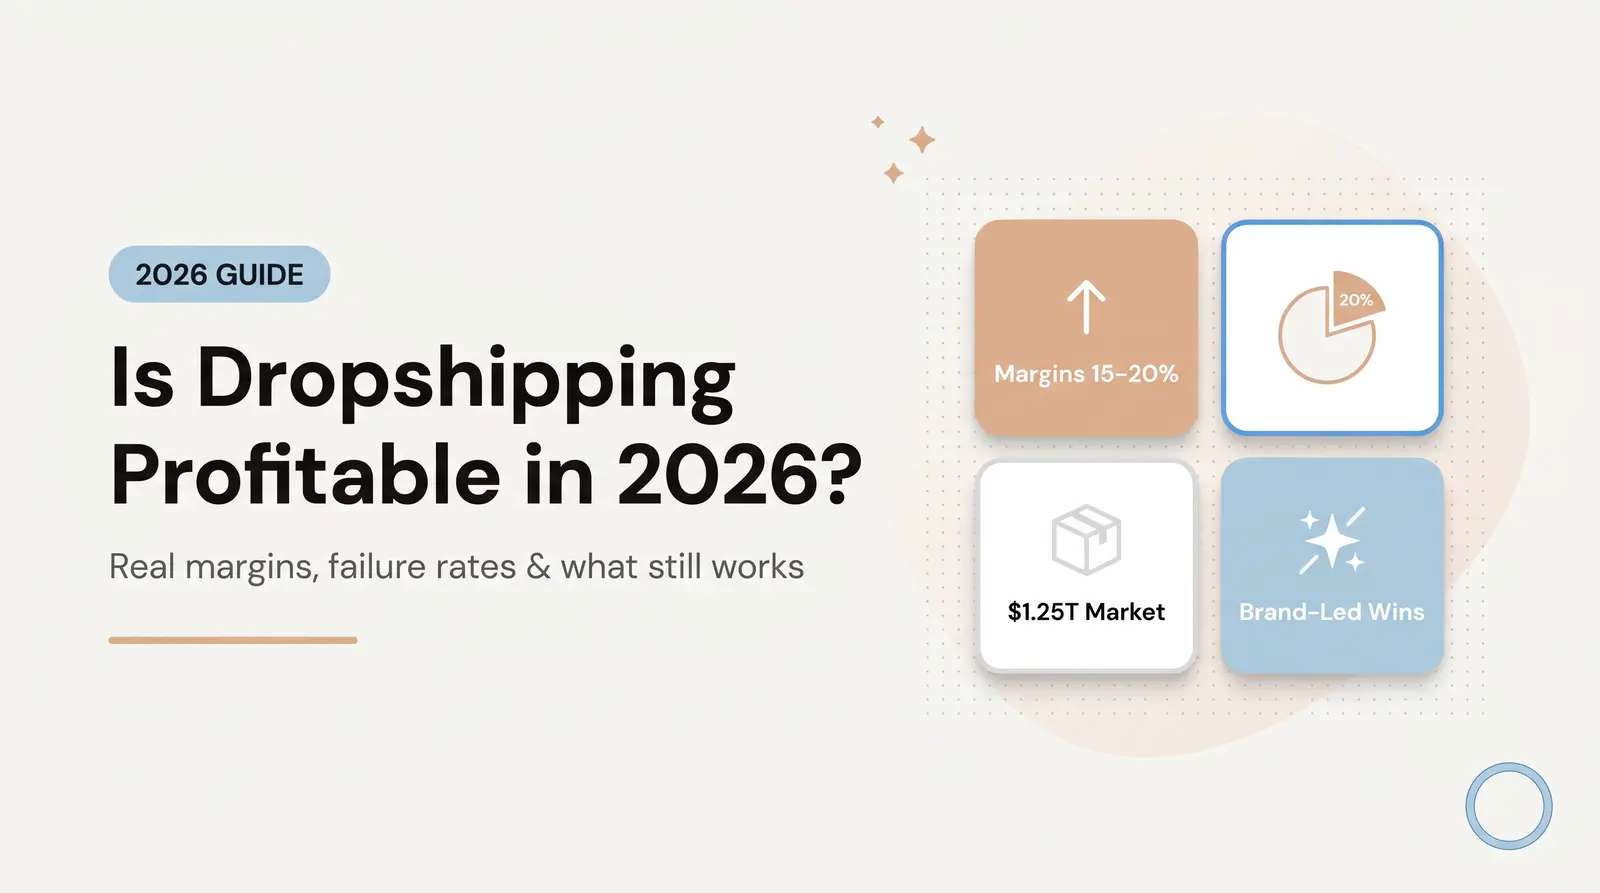
This guide ranks the best high-ticket dropshipping niches for 2026, reveals hidden profit killers, and explains why jewelry delivers the highest net margins.
Published:
January 29, 2026
Author:
Yi Cui
High-ticket dropshipping is an ecommerce model where you sell expensive products—typically ranging from $200 to $1,000+ retail—directly from a supplier to the customer without holding inventory.
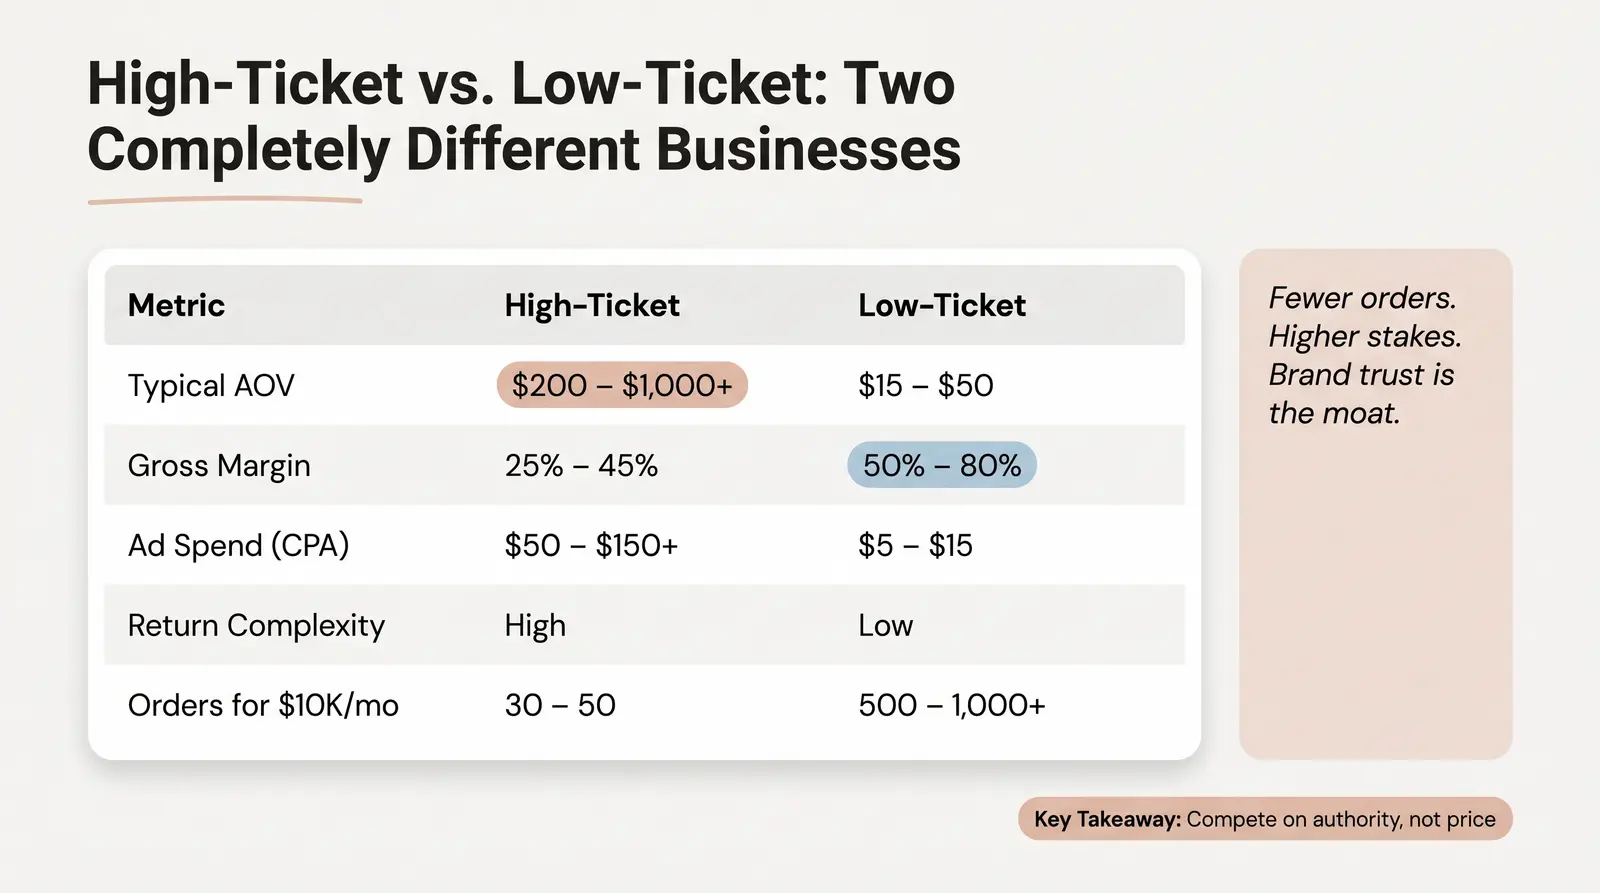
Unlike low-ticket dropshipping, which relies on high volume and impulse buys of cheap items, high-ticket dropshipping focuses on fewer, higher-value transactions. This structural difference impacts every aspect of the business. Selling a $500 item requires a different supplier relationship, higher customer service demands, and a more sophisticated approach to building brand trust. You are no longer competing on price alone; you are competing on authority, presentation, and reliability.
| Metric | High-Ticket Dropshipping | Low-Ticket Dropshipping |
|---|---|---|
| Typical AOV | $200 – $1,000+ | $15 – $50 |
| Gross Margin % | 25% – 45% | 50% – 80% |
| Ad Spend Tolerance (CPA) | High ($50 – $150+) | Low ($5 – $15) |
| Return Complexity | High (expensive shipping, restocking fees) | Low (often cheaper to refund and let them keep it) |
| Supplier Relationship | Authorized dealer, strict vetting | Generic platforms (AliExpress, Temu) |
| Trust Threshold | High (requires professional branding, social proof) | Low (impulse purchase driven) |
| Volume for $10K/mo Profit | 30 – 50 orders | 500 – 1,000+ orders |
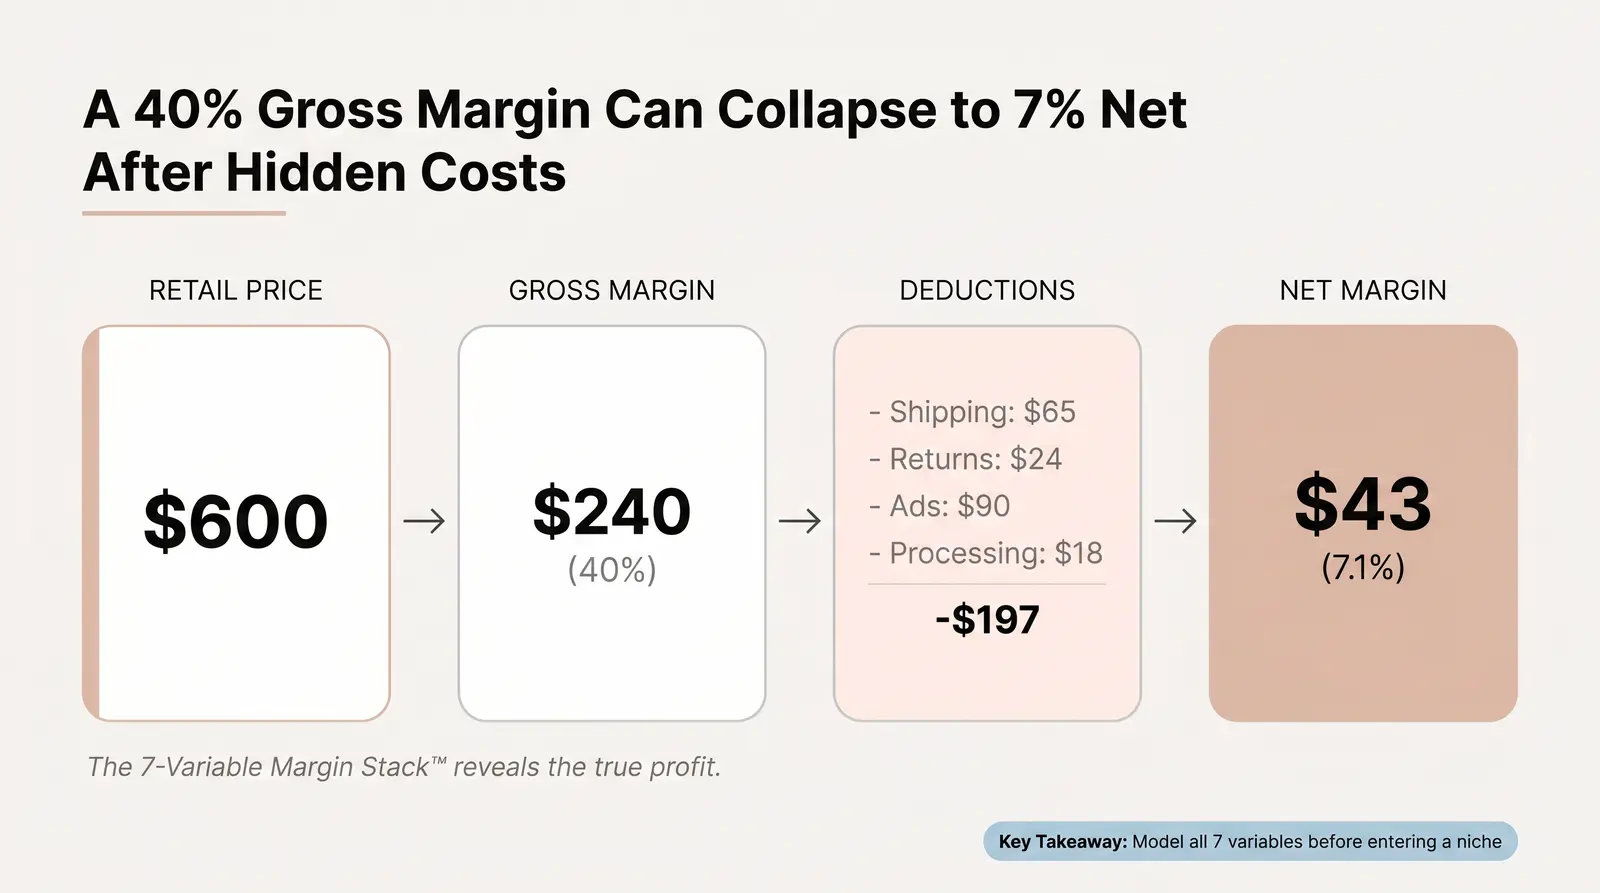
The biggest mistake aspiring dropshippers make is looking at gross margin and confusing it with net profit. A 40% margin on a $600 product looks like $240 in your pocket. In reality, that number is a mirage until you account for the operational costs of selling premium goods online.
Let's look at a worked example of a $600 home fitness item:
Suddenly, that $240 profit is just $43. This is why we use The 7-Variable Margin Stack™ to evaluate whether a category is worth entering. Every high-ticket seller must model these seven variables: AOV, gross margin %, shipping costs, return rates, payment processing risk/chargebacks, ad costs (CPA), and customer support load.
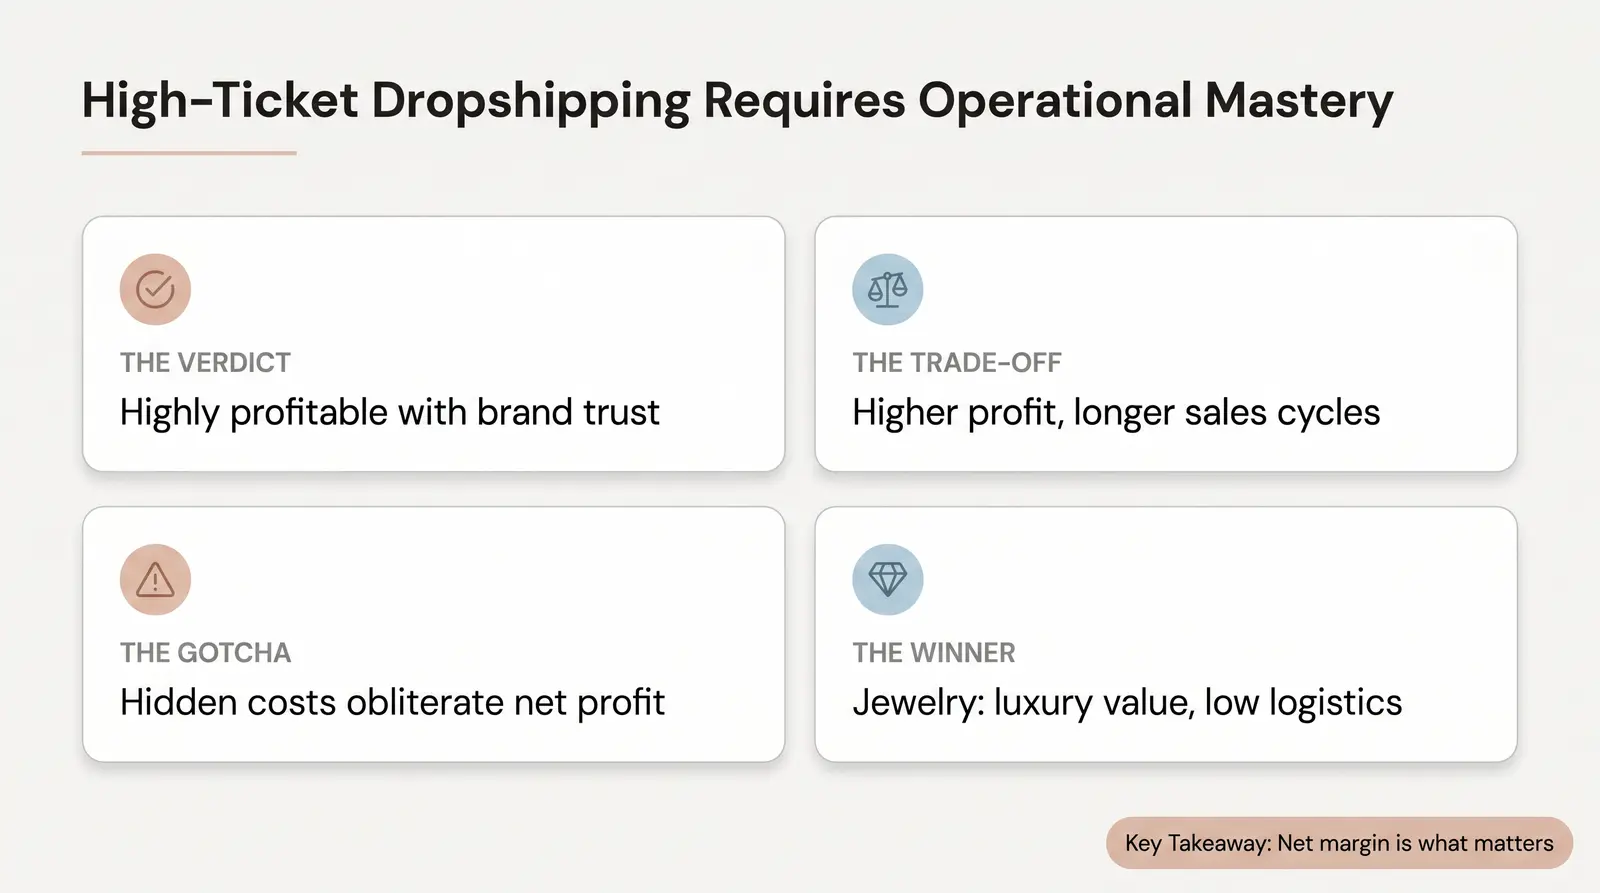
Here is the contrarian truth: a $600 product with a 15% return rate and $65 shipping can be significantly less profitable than a $180 product with a 2% return rate and $4 shipping. For example, furniture and fitness equipment often carry return rates of 8-15%, and the reverse logistics can wipe out the margin of three successful sales [1]. Meanwhile, categories like jewelry maintain high perceived value but cost pennies to ship and have manageable return profiles [2].
In our experience at Branvas, the founders who scale fastest aren't the ones who found the highest-priced product. They're the ones who found the lowest-friction margin.
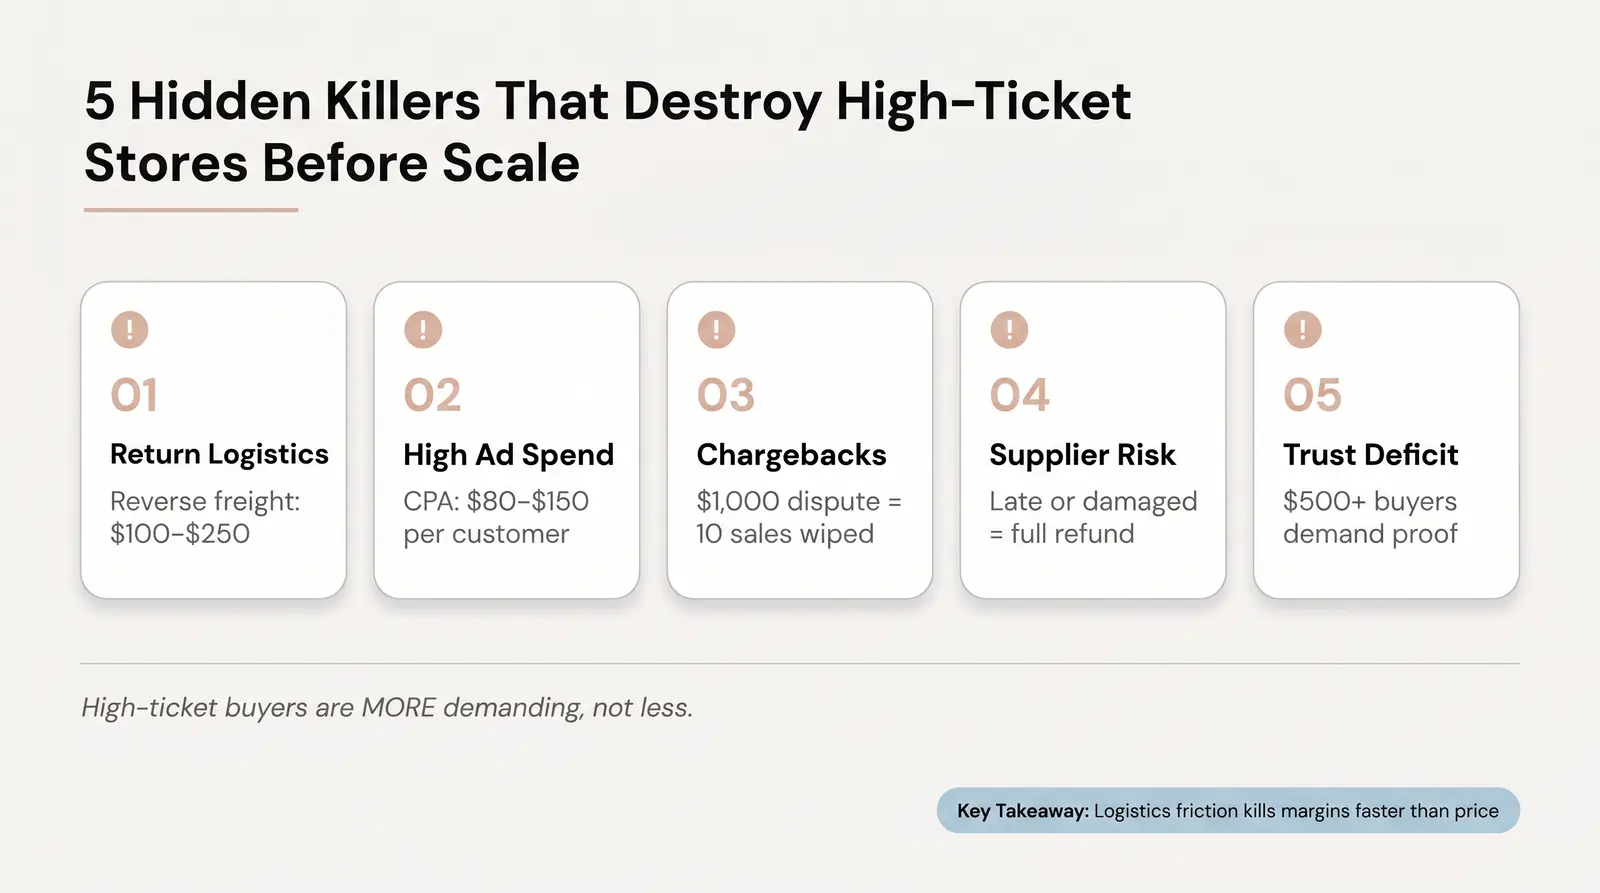
The internet is full of lists promising riches if you just sell $2,000 massage chairs. What those lists omit are the five profit killers that destroy high-ticket stores before they reach scale.
We often see founders struggle with the assumption that a higher price tag means the customer is less price-sensitive. In reality, high-ticket buyers are more demanding, not less.
To separate the hype from the reality, we use the Branvas Niche Viability Scorecard™. This rubric evaluates niches across six dimensions, scoring each from 1 to 5 (5 being the best): Margin Potential, Shipping & Fulfillment Complexity, Trust Barrier, Supplier Quality & Availability, Repeat Purchase Potential, and Brand-Building Ceiling.
| Niche | Margin Potential | Shipping Complexity | Trust Barrier | Supplier Quality | Repeat Purchase | Brand Ceiling | Total Score |
|---|---|---|---|---|---|---|---|
| Jewelry | 5 | 5 | 4 | 5 | 4 | 5 | 28/30 |
| Premium Pet Products | 4 | 4 | 4 | 4 | 5 | 4 | 25/30 |
| Luxury Accessories | 4 | 5 | 3 | 4 | 3 | 5 | 24/30 |
| Beauty/Skincare Devices | 5 | 4 | 3 | 3 | 3 | 4 | 22/30 |
| Smart Home Devices | 3 | 4 | 3 | 4 | 3 | 3 | 20/30 |
| Outdoor/Adventure Gear | 3 | 2 | 4 | 4 | 3 | 4 | 20/30 |
| B2B/Commercial Equipment | 4 | 2 | 2 | 4 | 4 | 3 | 19/30 |
| Fitness Equipment | 3 | 1 | 4 | 3 | 2 | 3 | 16/30 |
| Furniture | 3 | 1 | 3 | 3 | 2 | 3 | 15/30 |
| Watches | 4 | 5 | 2 | 2 | 2 | 3 | 18/30 |
Jewelry dominates the scorecard because it combines high perceived value with near-zero shipping friction. A $300 necklace costs $4 to ship and has minimal risk of transit damage. It offers a massive brand-building ceiling and strong repeat purchase potential for gifting. The main risk is the initial trust barrier, which is solved through high-quality branding and photography.
People spend irrationally on their pets. High-ticket items like luxury dog beds, smart feeders, and premium travel carriers offer good margins and decent shipping profiles. The recurring nature of pet ownership drives repeat purchases.
Items like premium leather bags or designer sunglasses share many of jewelry's logistical advantages. They are lightweight and carry high margins, but the market is heavily dominated by legacy heritage brands, making the trust barrier slightly higher for new entrants.
High-end LED masks, microcurrent devices, and laser hair removal tools retail for $200–$600. Margins are excellent and shipping is easy, but sellers must navigate strict advertising policies on Meta and Google regarding health claims.
The smart home market is growing rapidly [5], but dropshippers face intense price competition from Amazon and established tech brands. Margins are often squeezed, and customer support can be heavy due to setup and compatibility issues.
Premium tents, overlanding equipment, and specialized sporting gear command high prices. Buyers are passionate, but the items are often bulky, making shipping expensive and returns complicated.
Selling espresso machines to cafes or specialized tools to contractors offers massive AOVs. However, B2B buyers expect net-30 terms, extensive warranties, and immediate phone support, raising the operational barrier.
While lightweight and high-margin, the dropship watch market is heavily saturated with low-quality products masquerading as luxury. Building trust in a new watch brand in 2026 is incredibly difficult without massive influencer budgets.
Treadmills, squat racks, and connected gym equipment have high AOVs but terrible logistics. Shipping a 200lb item eats your margin, and if the customer returns it because it "doesn't fit the room," you lose money on the transaction.
Furniture looks great on paper but is a logistical nightmare for dropshippers. Freight shipping is expensive, transit damage rates are high, and the return logistics can bankrupt a small store [1].

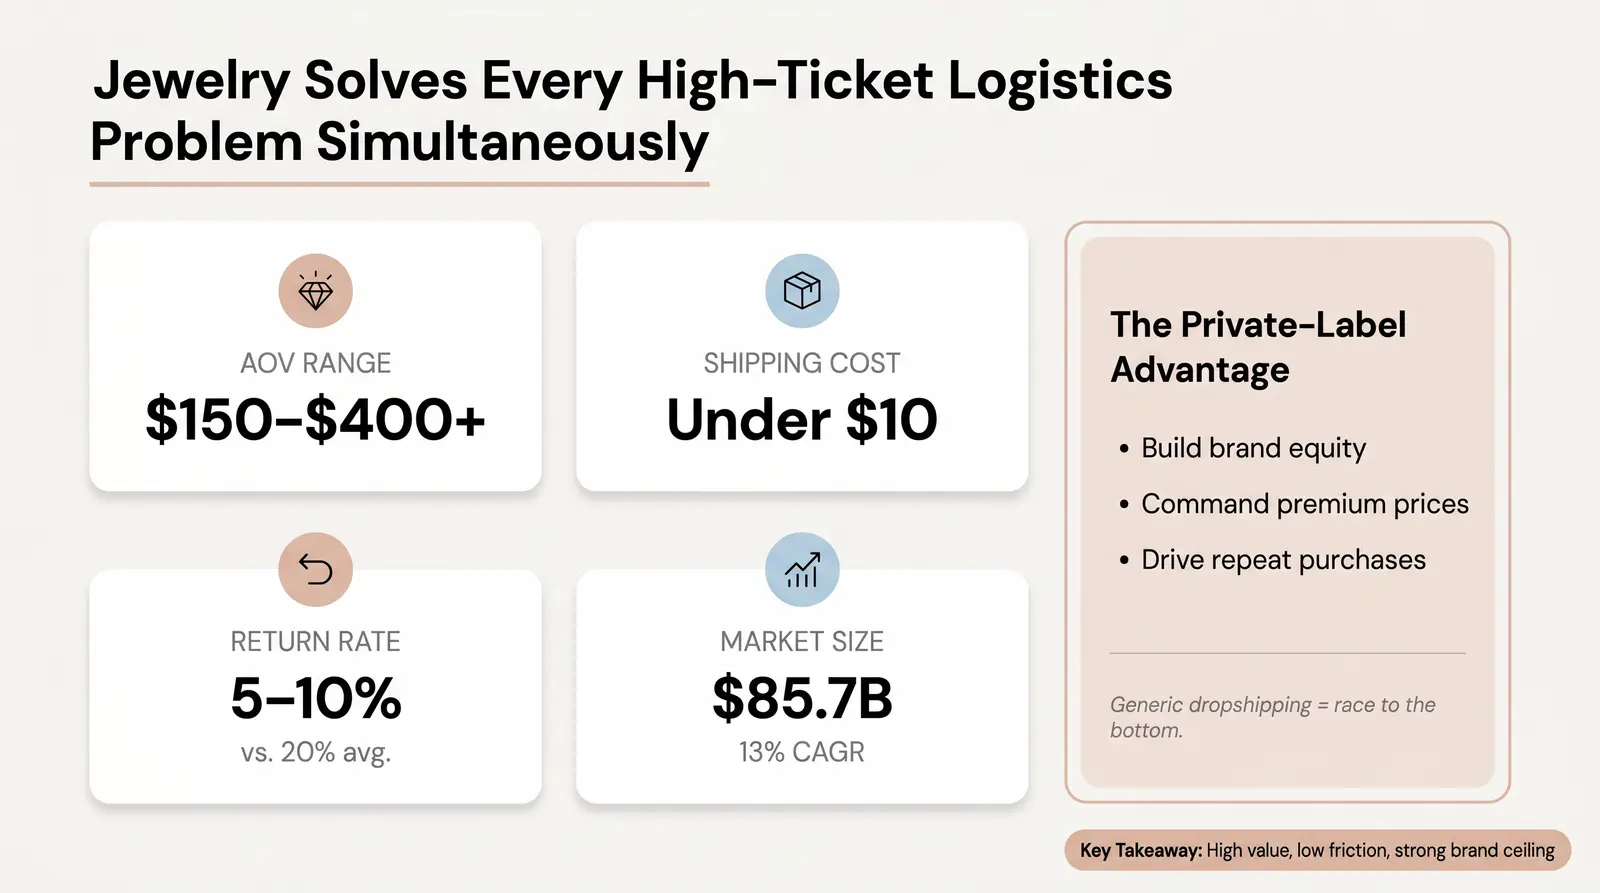
When you run the numbers through the 7-Variable Margin Stack™, jewelry emerges as the clear winner. The global online jewelry market is projected to reach $85.7 billion in 2026, growing at a 13% CAGR [6].
Structurally, jewelry solves the biggest problems of high-ticket ecommerce. The AOV is strong (often $150–$400+ for quality pieces), but the logistical footprint is tiny. You can ship a $400 ring via insured priority mail for under $10. If a return happens, the reverse logistics are cheap and the item can easily be restocked. While average ecommerce return rates hover around 20%, jewelry often sees return rates of 5-10% [1] [2].
However, the real economics unlock when you move from generic dropshipping to private-label jewelry. Selling the same generic pieces as everyone else forces a race to the bottom on price. Private labeling allows you to build brand equity, command higher prices, and generate repeat purchases.
If you're evaluating jewelry as your high-ticket niche, Branvas's how-it-works page shows exactly how founders launch private-label jewelry brands without holding inventory. Branvas handles the sourcing, custom branding, premium packaging, and blind fulfillment—allowing you to capture the high margins of jewelry without the traditional supply chain headaches.
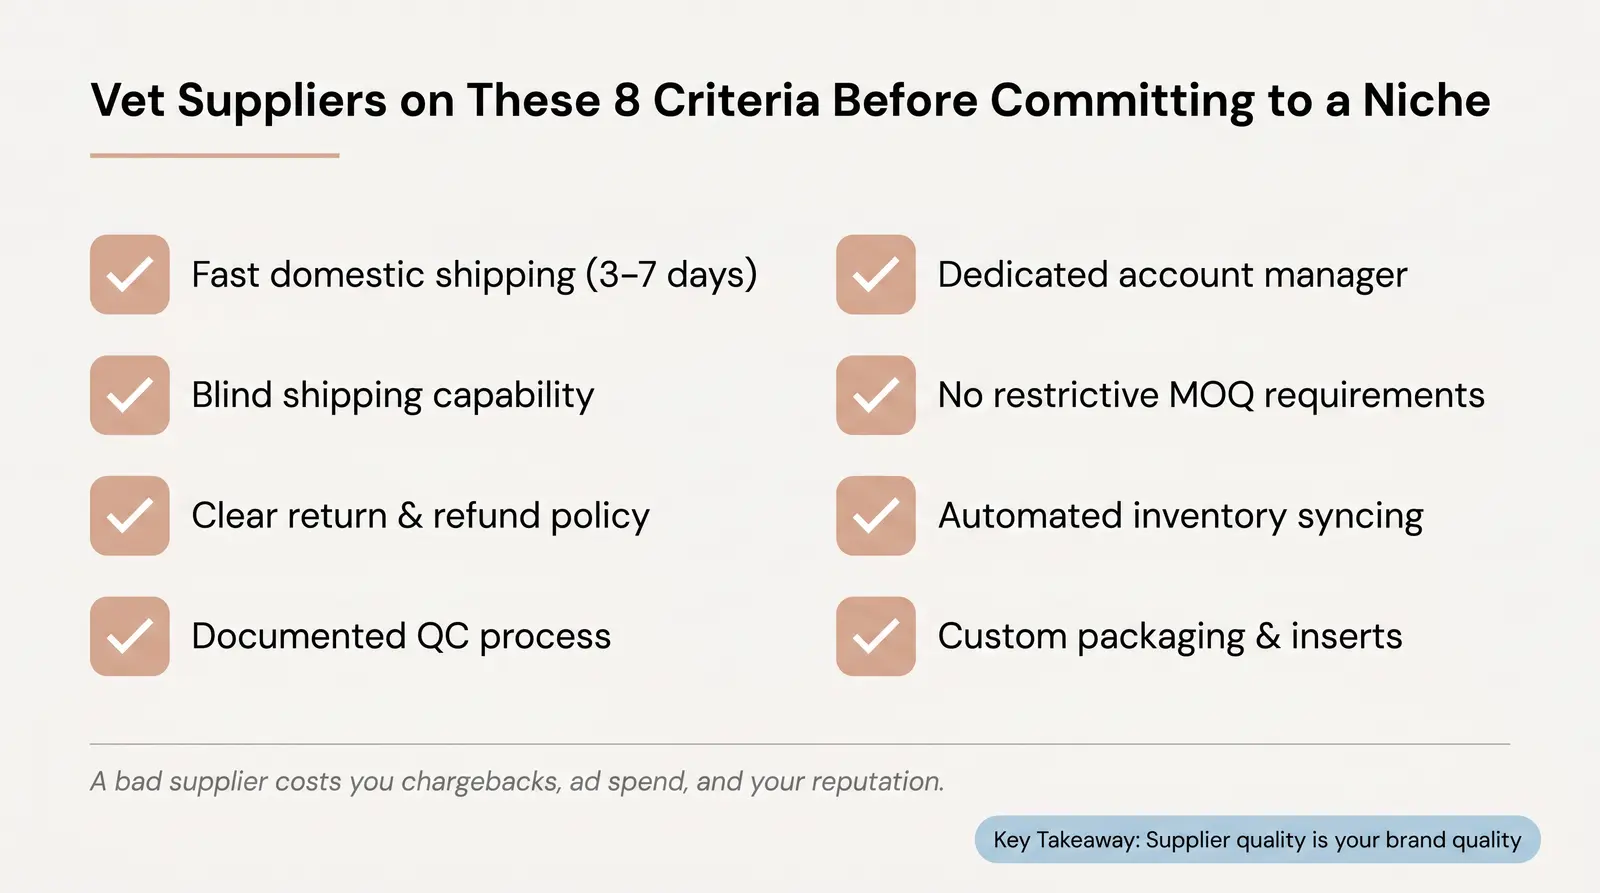
Your supplier is your business partner. In high-ticket dropshipping, a bad supplier doesn't just cost you a sale; they cost you chargebacks, ad spend, and your reputation.
Supplier Qualification Checklist:
For jewelry specifically, private-label platforms like Branvas offer a massive advantage over generic wholesale directories because they integrate the supplier relationship, custom branding, and fulfillment into a single, cohesive system.
Yes, high-ticket dropshipping is profitable in 2026, but the era of easy money is over. It is highly profitable for entrepreneurs who treat it like a real retail business: focusing on brand trust, modeling their margins rigorously, and choosing niches with favorable logistics.
It is not profitable for those who simply slap a $1,000 price tag on a generic product and run basic Facebook ads. If you choose a niche with heavy shipping, high returns, and thin margins (like furniture), you will likely fail.
Success requires filtering every decision through the 7-Variable Margin Stack™. When you do, you'll find that the most profitable path often leads away from bulky, complex items and toward high-perceived-value, low-friction products.
Ready to start with the highest-margin, lowest-friction high-ticket niche? Explore Branvas's private-label jewelry catalog and launch your brand in days, not months.

1. What is high-ticket dropshipping and how does it work?
High-ticket dropshipping involves selling premium, expensive products (usually $200 to $1,000+) directly from a supplier to a customer. You do not hold inventory; instead, you market the products, collect payment, and pay the supplier to ship the item. The focus is on generating larger profit margins per sale rather than relying on high volume.
2. What are the best high-ticket dropshipping niches in 2026?
Based on margin potential and operational complexity, the best niches are jewelry, premium pet products, luxury accessories, and beauty/skincare devices. These categories offer high perceived value without the crippling shipping costs and return logistics associated with furniture or large fitness equipment.
3. Is high-ticket dropshipping profitable for beginners?
It can be, provided beginners choose the right niche. High-ticket dropshipping requires a larger upfront budget for advertising and website design, as building trust is critical. Beginners should avoid logistically complex niches like furniture and instead focus on lightweight, high-margin categories like jewelry.
4. What are the biggest risks of high-ticket dropshipping?
The primary risks are high customer acquisition costs (CPA), expensive return logistics, payment processor holds, and chargebacks. Because the transaction values are high, a single refund or chargeback dispute can significantly impact cash flow and profitability.
5. How do I find reliable high-ticket dropshipping suppliers?
Avoid generic marketplaces like AliExpress for high-ticket items. Instead, look for domestic manufacturers, authorized dealer programs, or specialized private-label platforms. Evaluate suppliers based on shipping speed, blind fulfillment capabilities, quality control processes, and their ability to integrate with your store.
[1] Ecommerce Return Rate Benchmarks by Industry | Corso
[2] How to Make Big Money from Dropshipping Jewelry? | ScaleOrder
[3] Facebook Ads Cost (2025) | Business of Apps
[4] The Ultimate Chargeback Statistics 2025: Trends, Costs, and Solutions | Chargeflow
[5] Trending Markets for Smart Home Devices in 2026 | HIRI
[6] Online Jewelry Market Size (2026 Data, Growth Rate & Industry Statistics) | Icecartel