



Audit your product detail page across 30 scored elements covering layout, imagery, copy, social proof, trust signals, and technical SEO to prioritize high-impact conversion fixes.
Published:
October 9, 2026
Author:
Yi Cui
Score your PDP across 30 elements in under 90 seconds. Free audit widget — no email required.
Across ecommerce industries, average conversion rates hover around 2% to 3% [1]. This means that for every 100 people who visit your store, 97 leave without buying, resulting in significant revenue leakage and wasted ad spend. While most sellers quickly fix the obvious things like basic product photos or pricing, the highest-impact conversion gaps usually sit in the less visible layers of a page. This article delivers the 30-element Branvas PDP Scorecard framework, the reasoning behind each element category, and a free interactive audit widget below to help you diagnose and prioritize exactly what to fix first.
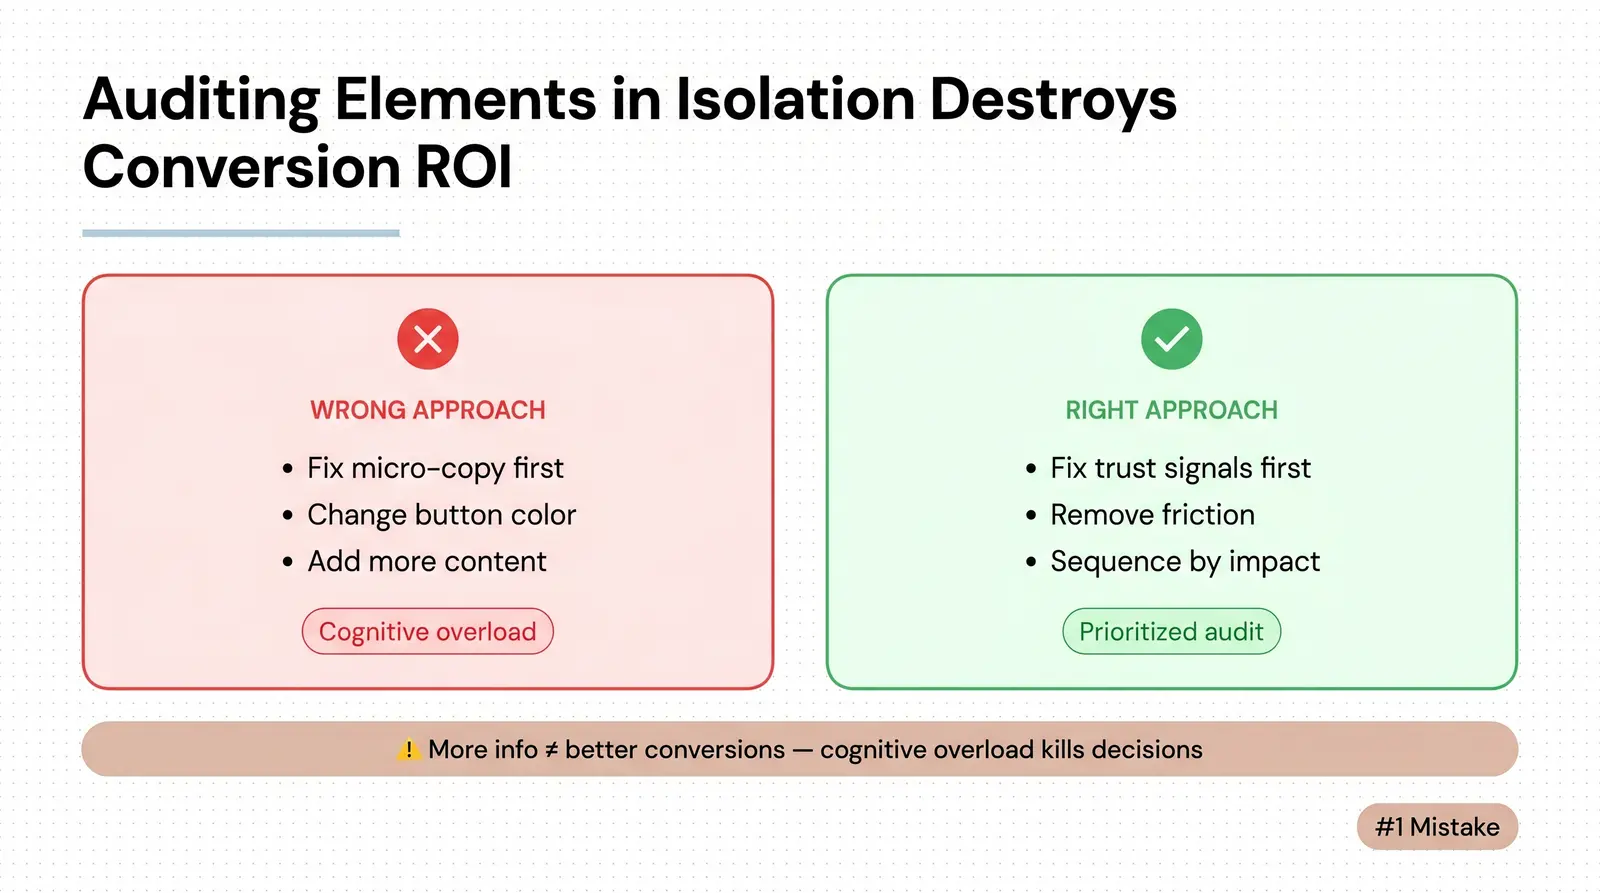
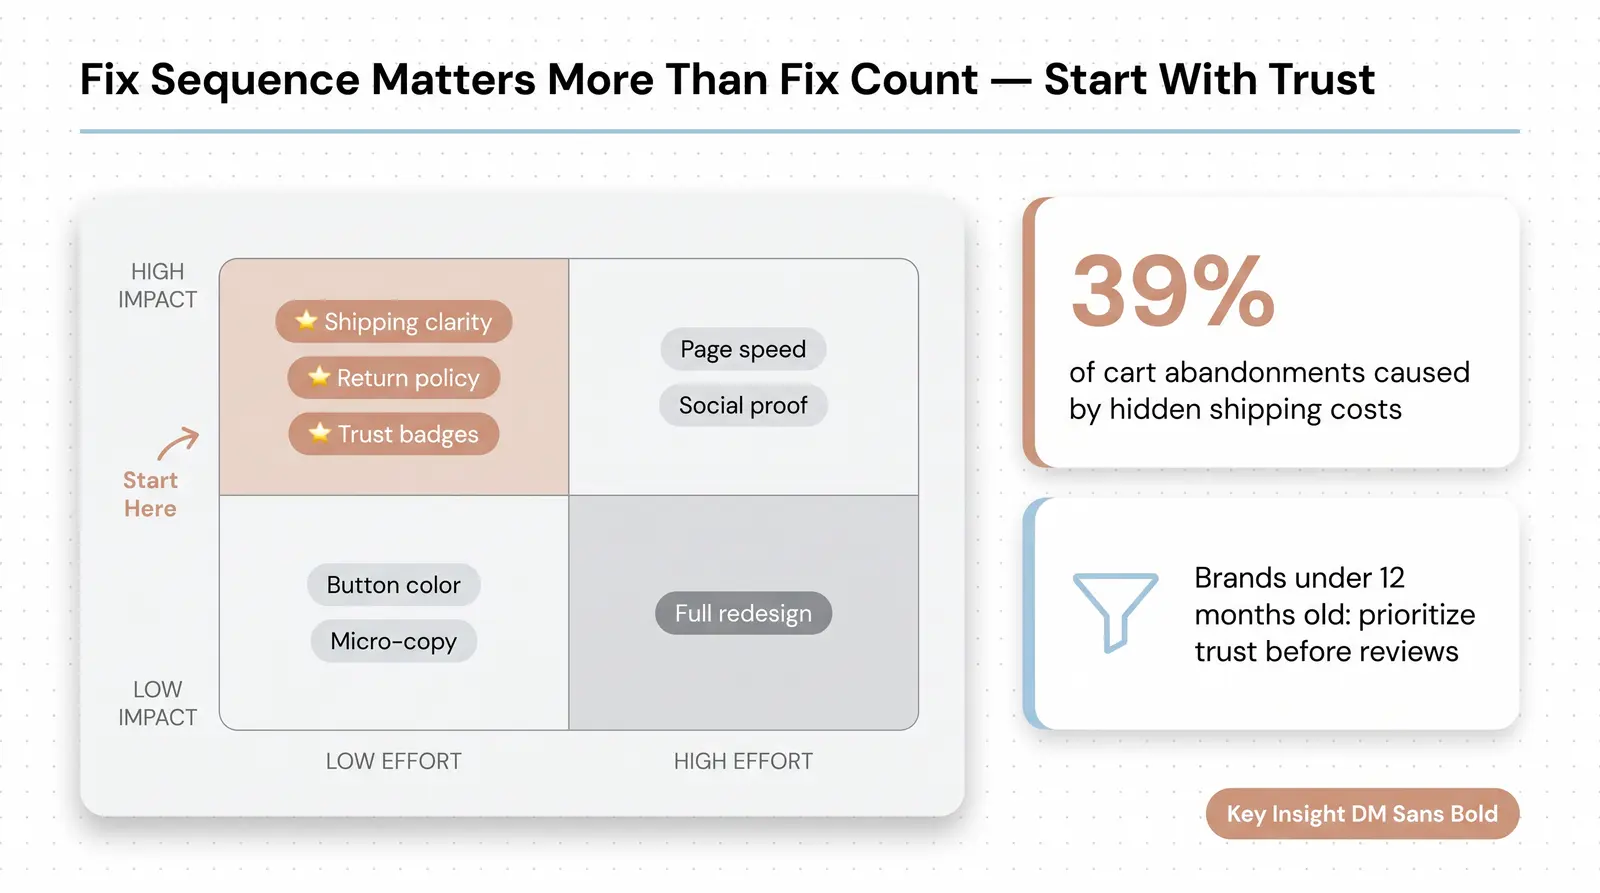
The most common mistake ecommerce operators make when auditing product detail pages is looking at elements in isolation without a hierarchy of impact. Fixing micro-copy on a product description or changing a button color before addressing fundamental trust signals or hidden shipping costs is a costly misallocation of resources.
Furthermore, a contrarian insight from cognitive load theory reveals that adding more information to a PDP can actually decrease conversions if it increases the user's mental effort [2]. When an interface offers too many choices, cluttered layouts, or excessive text, it creates cognitive overload, leading to decision paralysis and abandonment. Therefore, a great PDP audit must be prioritized, not just exhaustive. It needs to tell you what to remove just as much as what to add, and sequence the fixes based on what moves the needle the most.
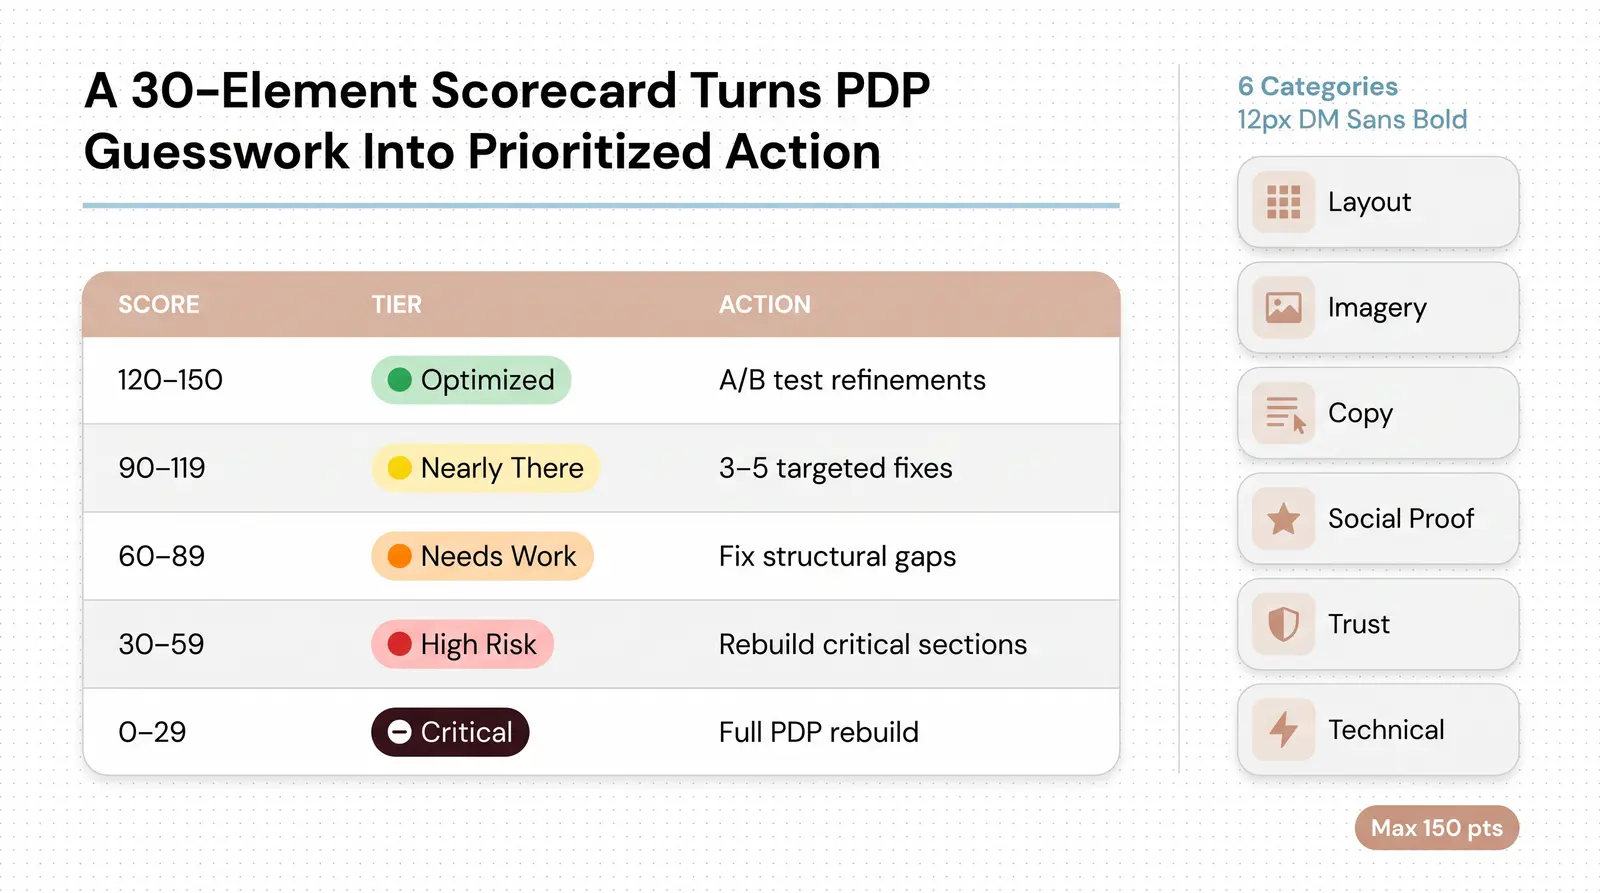
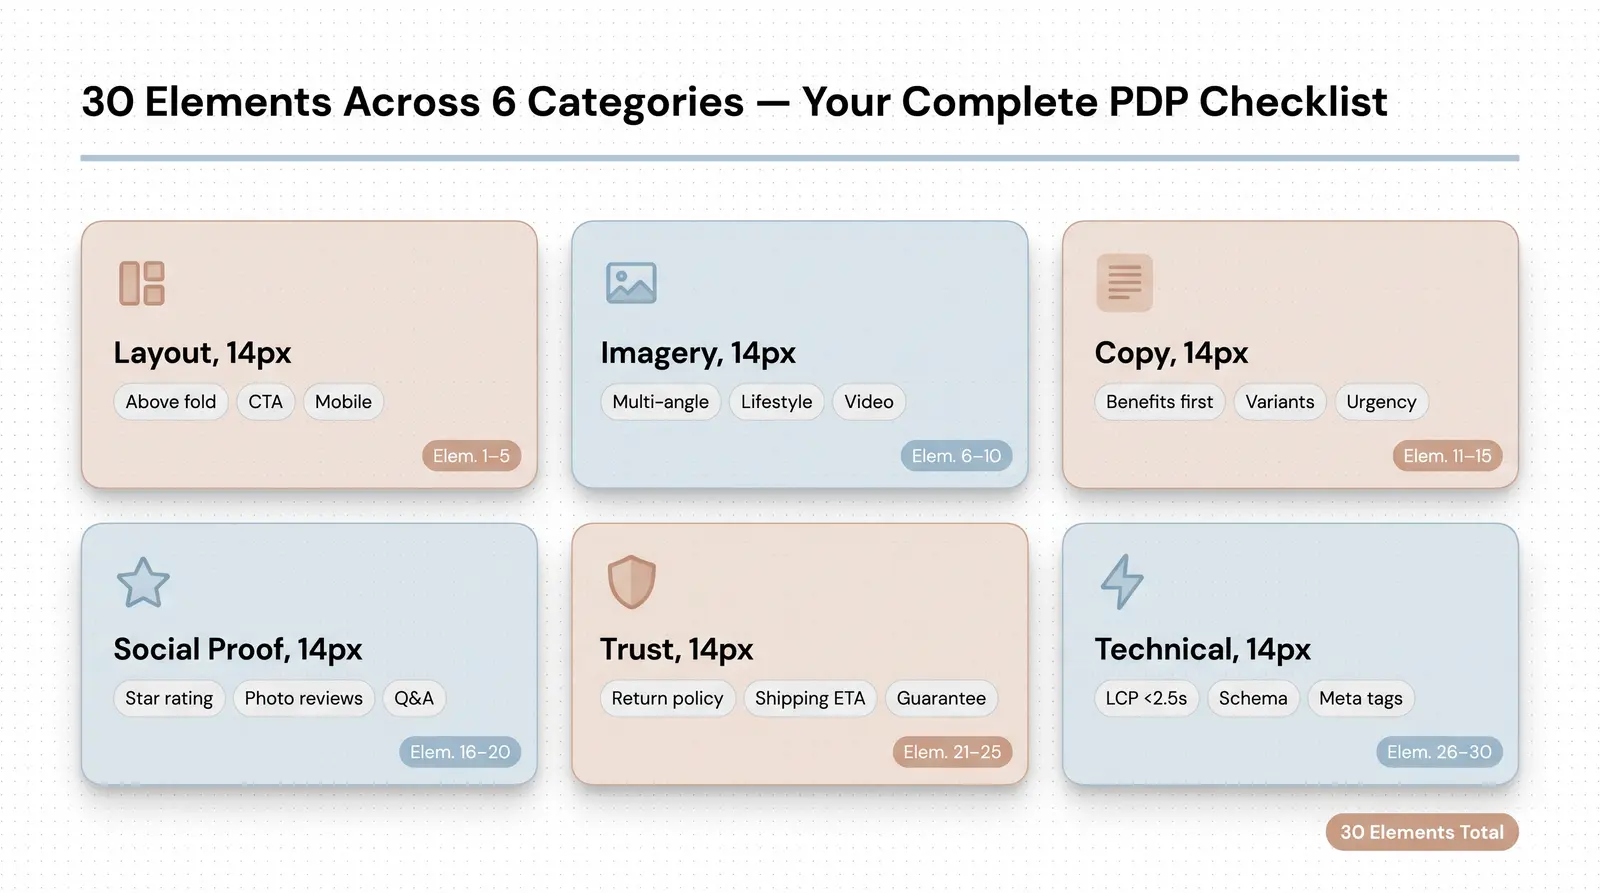
The Branvas PDP Scorecard is a proprietary 30-element audit framework developed from deep conversion rate optimization research and real-world experience launching product-based brands. Elements are grouped into six categories, each scored 0 to 5 points, giving a maximum score of 150. These scores map to a specific Action Tier to guide your next steps.
| Score Range | Action Tier | What It Means |
|---|---|---|
| 120–150 | 🟢 Optimized | Minor refinements only; focus on A/B testing |
| 90–119 | 🟡 Nearly There | 3–5 targeted fixes will move the needle meaningfully |
| 60–89 | 🟠 Needs Work | Structural gaps likely suppressing conversion; prioritize Tier 1 elements |
| 30–59 | 🔴 High Risk | Significant revenue leakage; audit and rebuild critical sections first |
| 0–29 | ⛔ Critical | PDP is likely a conversion dead-end; full rebuild recommended |
A clear visual hierarchy reduces cognitive load and ensures the path to purchase is frictionless.
High-quality imagery bridges the gap between digital browsing and physical touch, directly impacting user confidence.
Persuasive copy should address customer needs and overcome objections, rather than just listing technical specifications.
Social proof is a powerful psychological trigger; nearly all consumers consult reviews before making a purchase [5].
Reducing perceived risk is essential for conversion, especially for new or unfamiliar brands.
Technical performance and structured data form the foundation of a discoverable and usable product page.
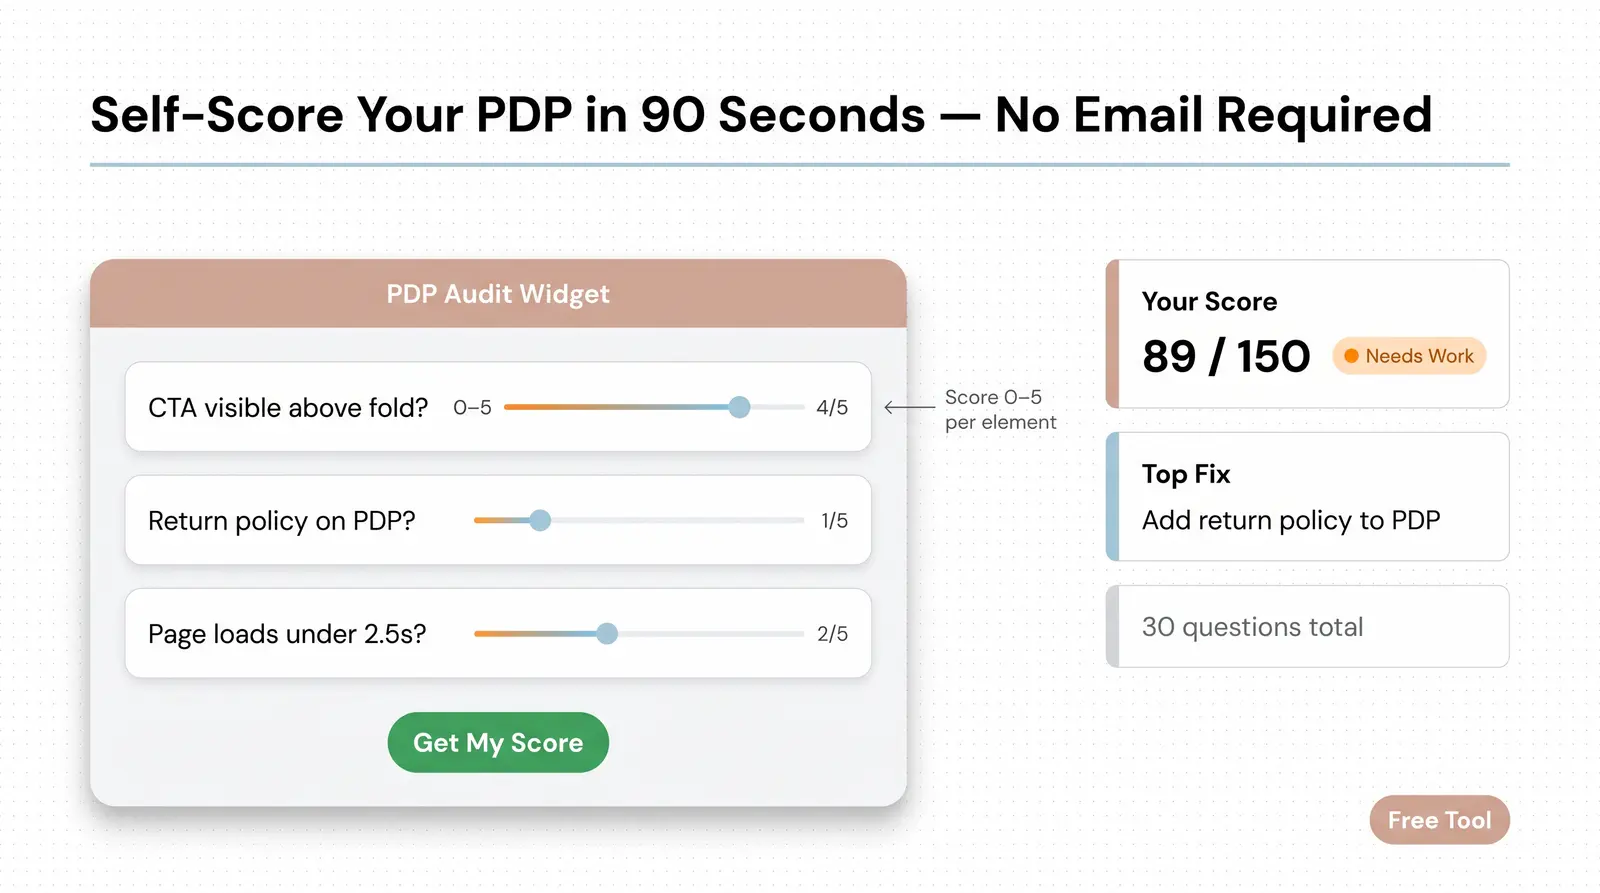
Use the interactive widget below to assess your product page against the 30-element framework. Simply answer the questions to receive your score, Action Tier, and a prioritized list of fixes.
<!-- BRANVAS PDP AUDIT WIDGET — EMBED HERE -->
<!-- Widget: 30-question self-assessment scored 0–1 per element (total /30, mapped to /150 via category weighting). Outputs Action Tier + prioritized fix list by category. No email required. -->
[Widget loads here — if not rendering, use the checklist above to self-score each element manually]
If the widget is not rendering, you can use the checklist above to self-score manually. Assign 0 points if the element is not present, 1 to 4 points for partial implementation, and 5 points if it is fully optimized. Total your score and reference the Action Tier table to determine your next steps.
To illustrate how this works in practice, let's look at a hypothetical DTC jewelry brand called Lumère. They ran the Branvas PDP Scorecard on their best-selling ring page.
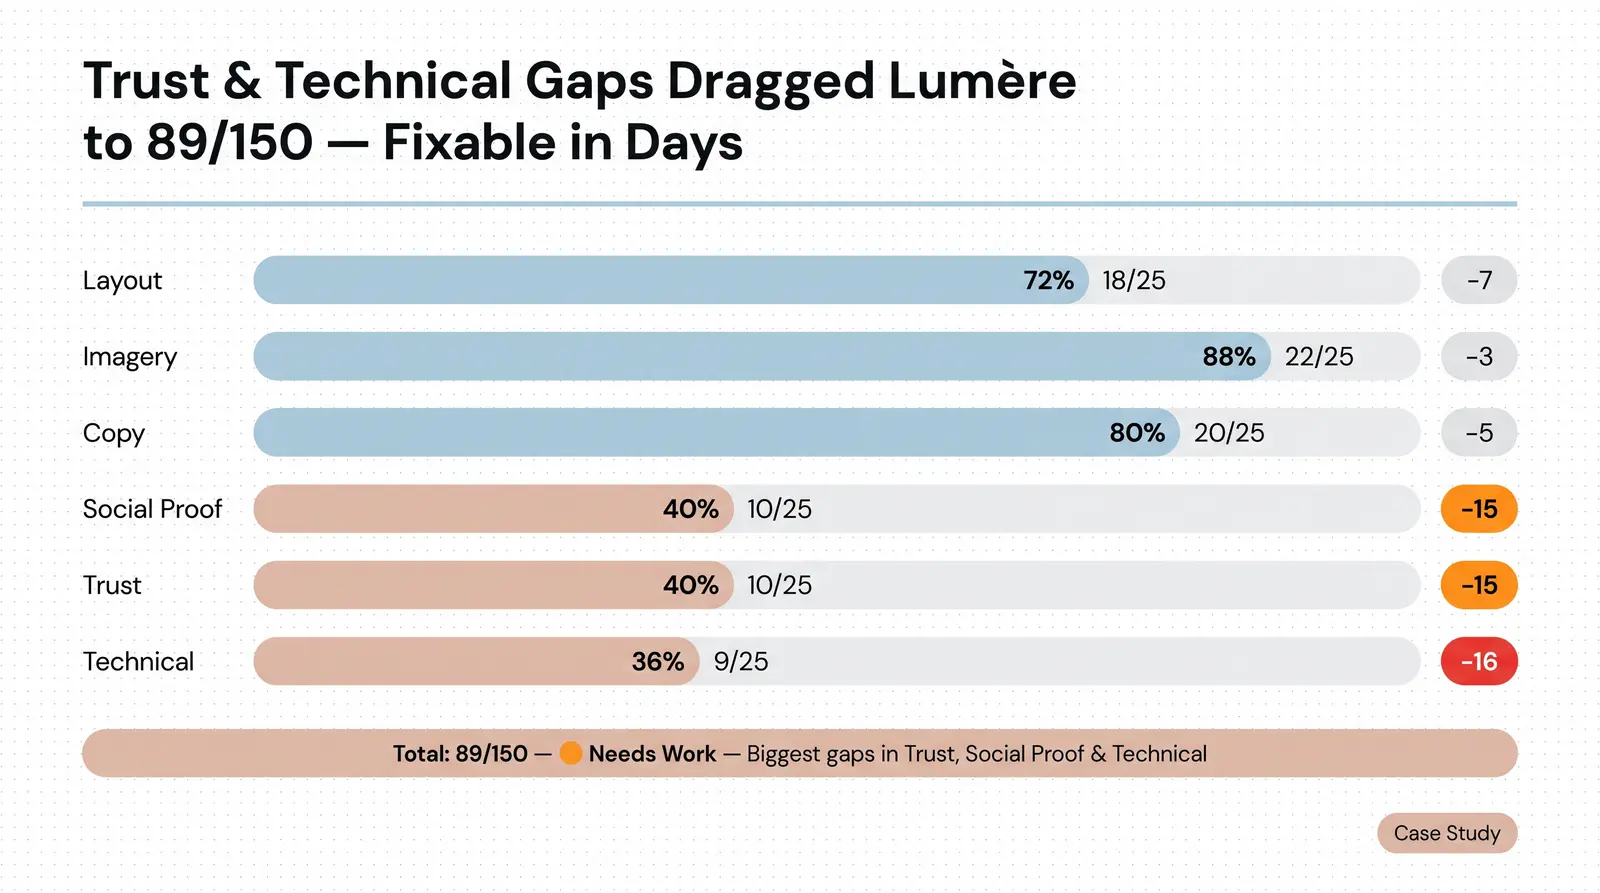
Lumère scored well on Imagery & Media (22/25) because they had excellent product photos and a model shot. They also scored high on Copy & Messaging (20/25) with clear, benefit-driven descriptions. However, they performed poorly on Trust & Risk Reduction (10/25) because their return policy was hidden and shipping costs were unclear. Their Technical & SEO score was also low (9/25) due to slow page load times.
With a total score of 89/150, Lumère falls into the 🟠 Needs Work tier. The widget's prioritized action list recommended fixing return policy visibility, adding a shipping ETA near the buy button, implementing Product schema, and improving page speed. After implementing these top fixes, their conversion rate improved significantly.
| Category | Max Score | Lumère Score | Gap |
|---|---|---|---|
| Page Hierarchy & Layout | 25 | 18 | -7 |
| Imagery & Media | 25 | 22 | -3 |
| Copy & Messaging | 25 | 20 | -5 |
| Social Proof | 25 | 10 | -15 |
| Trust & Risk Reduction | 25 | 10 | -15 |
| Technical & SEO | 25 | 9 | -16 |
| Total | 150 | 89 | -61 |
When analyzing what truly drives conversions, research consistently points to a few critical areas. Social proof, trust signals, shipping transparency, and page speed have the highest documented impact on conversion rates. For example, hidden extra costs like shipping and taxes are responsible for 39% of cart abandonments [8].
A crucial, often overlooked insight is that the sequence of fixes matters more than the total number of fixes. Fixing a low-impact element first, like changing a button color, while ignoring a major friction point like shipping cost transparency, is a costly mistake. High cognitive load from cluttered design also suppresses conversions, so simplifying the page is often more effective than adding new features [2].
In our experience at Branvas, the brands that see the fastest lift after launching their store are those who prioritize trust signals and shipping clarity above everything else — especially when the brand is less than 12 months old and doesn't yet have a review library.
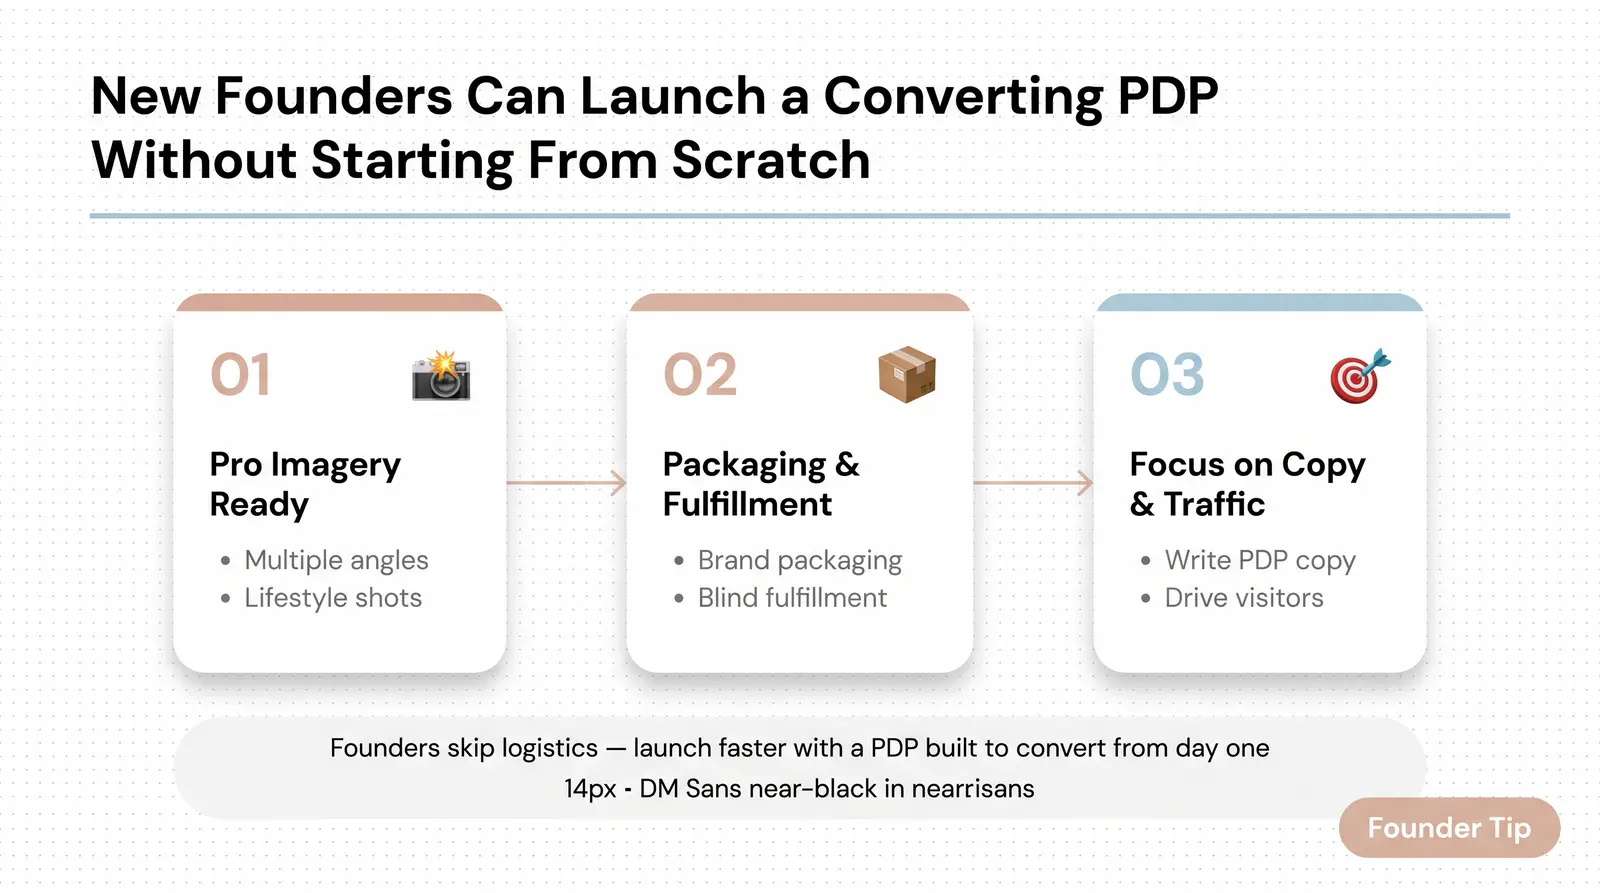
New brand founders face a classic chicken-and-egg challenge: they need to launch fast with a PDP that converts, but they need sales to generate the reviews that drive those conversions. Building a high-performing product page from scratch takes time and resources that many founders lack.
Branvas addresses this structurally. We offer private-label products with professional imagery already produced, brand packaging ready, and blind fulfillment handled. This allows founders to focus entirely on PDP copy, building trust, and driving traffic, rather than getting bogged down in logistics and photography.
See how the Branvas process works end-to-end at branvas.com/how-it-works.
If you're launching a jewelry or accessories brand and want a head start on a converting PDP, explore the Branvas product catalog to see what's available ready-to-brand.
A product detail page (PDP) is the specific webpage on an ecommerce site that provides all the information about a single product. It matters for conversion because it is the critical decision point where a shopper chooses to add an item to their cart or leave the site. An optimized PDP reduces hesitation and builds trust.
A product page should have at least five to eight high-quality images. This includes the product from multiple angles (front, side, back), close-up shots of details or textures, and lifestyle images showing the product in use or on a model to provide scale and context.
While many elements are crucial, clear pricing and a prominent, high-contrast "Add to Cart" button are the most important functional elements. However, from a psychological standpoint, transparent shipping costs and strong social proof (reviews) are the most critical elements for actually driving the conversion.
To audit your Shopify product page, use a structured framework like the Branvas PDP Scorecard. Evaluate your page across key categories: layout hierarchy, imagery quality, persuasive copy, social proof, trust signals, and technical speed. Prioritize fixing elements that reduce user friction, such as hidden shipping fees or slow load times.
Page speed has a direct and significant impact on conversions. Google's Core Web Vitals guidelines recommend a Largest Contentful Paint (LCP) of under 2.5 seconds. Slower pages increase bounce rates and cognitive load, frustrating users and leading to lost sales. Every second of delay can measurably decrease your conversion rate.
Ready to launch a product line with PDPs built to convert from day one? See how Branvas works →


