A data-driven ranking of 12 product detail page elements by conversion lift reveals sticky add-to-cart on mobile and review placement near ATC outperform product video.
Published:
October 7, 2026
Author:
Yi Cui
We tested 12 PDP elements across multiple stores. Sticky add-to-cart on mobile out-converted product video by 4x.
Most brands over-invest in traffic acquisition while leaving their product pages to fend for themselves. In our experience at Branvas, we often see founders spend $5,000/month on ads driving traffic to a product page that converts at 1.2% — when small structural changes could double that. This article presents a meta-analysis of 12 product detail page (PDP) elements ranked by conversion lift, broken down by device and product category, to help you prioritize your next build.
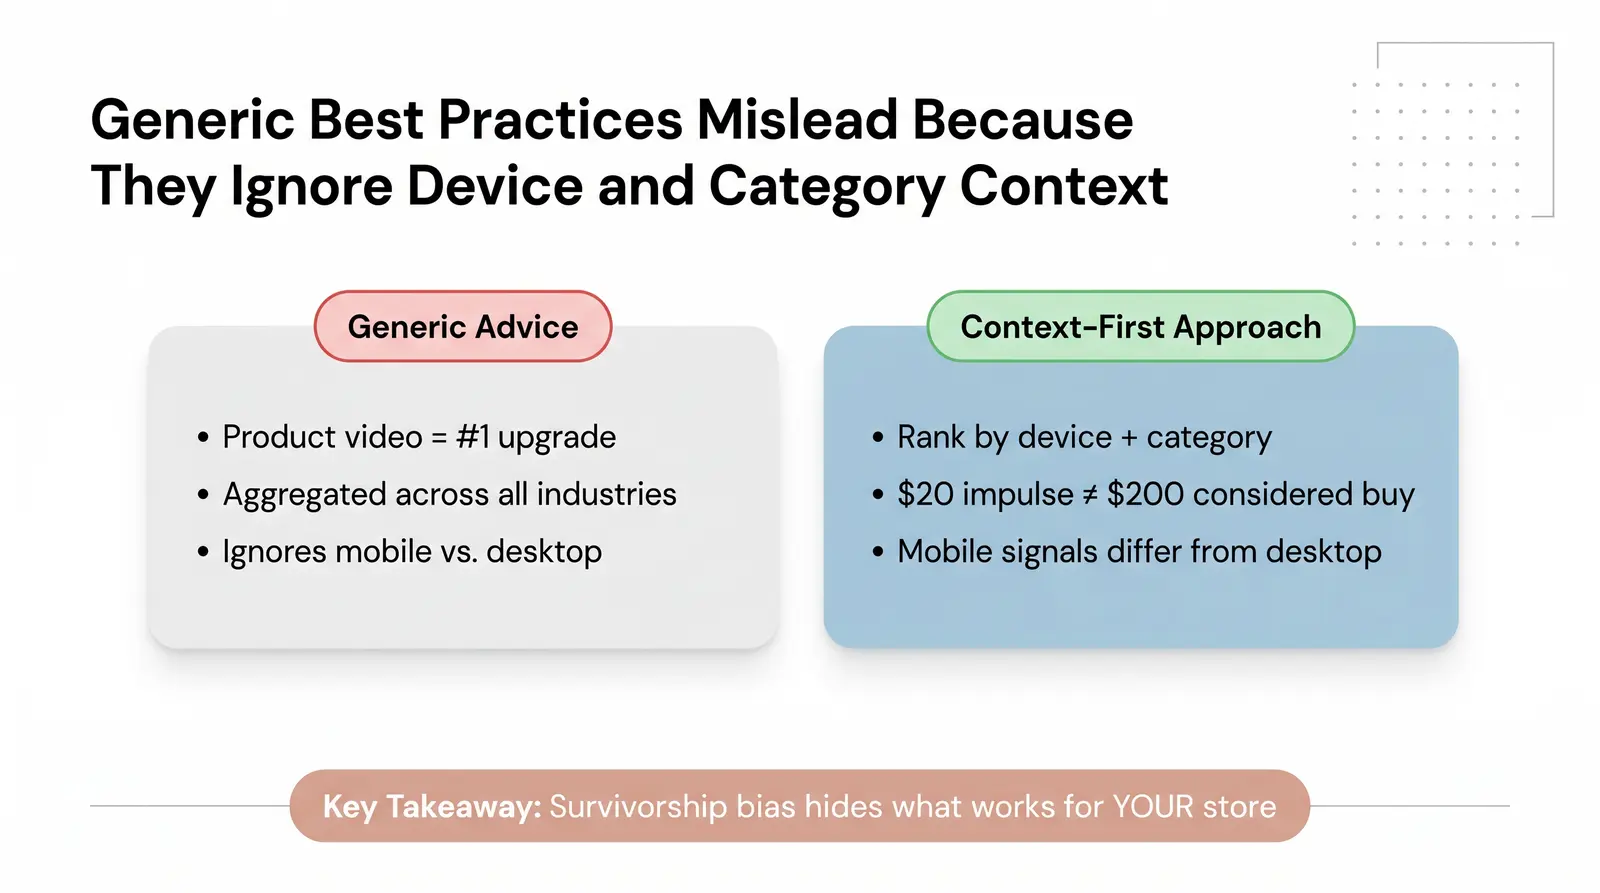
If you search for ecommerce conversion advice, you will inevitably be told to add a product video. While product video is often cited as the #1 PDP upgrade, data shows it is frequently outperformed by structural and UX elements like sticky add-to-cart buttons and social proof placement — especially on mobile [1].
The problem with most "best practice" content is survivorship bias. It aggregates data across industries and devices, masking the specific signals that matter to your category. A tactic that works for a $20 impulse buy on desktop might fail completely for a $200 considered purchase on mobile. You need to look at the data through the lens of your specific context.
To find out what actually works, we synthesized our multi-store observations at Branvas with published third-party A/B test data. We evaluated 12 elements using a proprietary framework: The PDP Conversion Leverage Score (CLS).
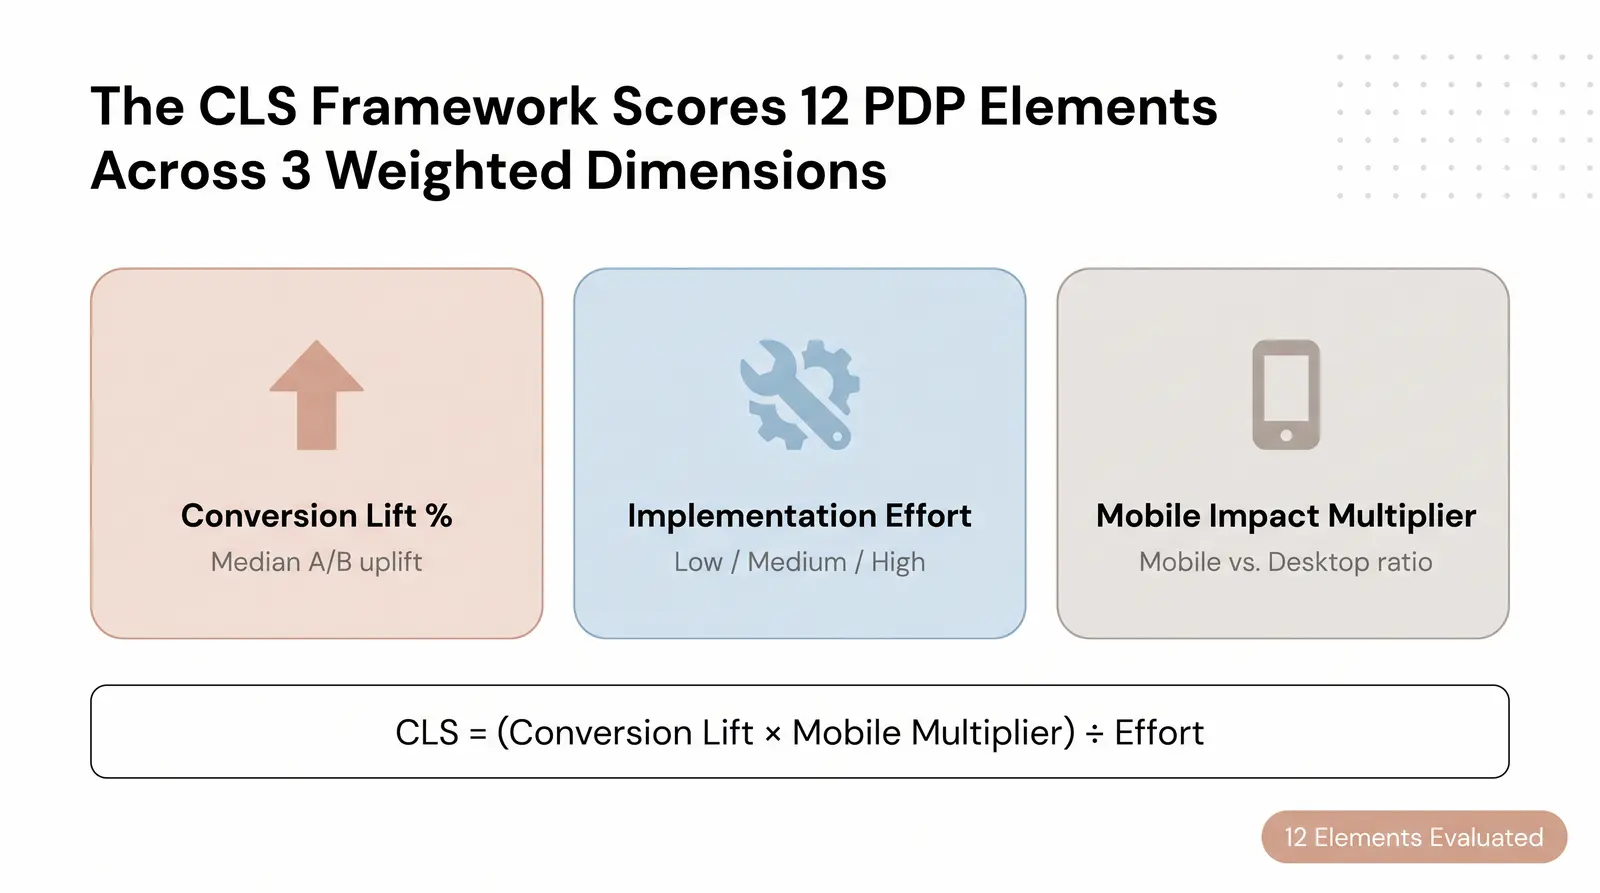
The CLS is a scoring model that ranks PDP elements across three dimensions:
The CLS is calculated as: (Conversion Lift × Mobile Impact Multiplier) ÷ Implementation Effort. This produces a single prioritization score to guide your development resources.
We evaluated the following 12 elements:
| Rank | PDP Element | Median Conv. Lift | Mobile Impact Multiplier | Implementation Effort | CLS Score | Notes |
|---|---|---|---|---|---|---|
| 1 | Sticky ATC button (mobile) | 8.0% | 1.5x | Low (1) | 12.0 | Keeps the primary action visible during long scrolls. |
| 2 | Review placement near ATC | 6.5% | 1.2x | Low (1) | 7.8 | Builds immediate trust at the point of decision. |
| 3 | Inline size guide | 5.0% | 1.3x | Medium (2) | 3.25 | Reduces fit anxiety without breaking the user journey. |
| 4 | Image carousel | 4.5% | 1.4x | Medium (2) | 3.15 | Conserves vertical space on mobile while allowing exploration. |
| 5 | Trust badge stack | 3.0% | 1.1x | Low (1) | 3.3 | Provides reassurance right before the click. |
| 6 | Social proof badges | 4.0% | 1.0x | Medium (2) | 2.0 | Leverages FOMO but requires dynamic data integration. |
| 7 | Product video | 6.0% | 0.8x | High (3) | 1.6 | High production cost and potential load time issues on mobile. |
| 8 | Urgency/scarcity indicators | 3.5% | 1.0x | Medium (2) | 1.75 | Effective if authentic, but users ignore fake scarcity. |
| 9 | Cross-sell module placement | 4.0% | 0.9x | High (3) | 1.2 | Can distract from the main purchase if placed too high. |
| 10 | FAQ accordion | 2.5% | 1.2x | Medium (2) | 1.5 | Keeps pages clean while answering objections. |
| 11 | Bulleted product description | 2.0% | 1.3x | Low (1) | 2.6 | Easier to scan on small screens than dense paragraphs. |
| 12 | Breadcrumb navigation | 1.5% | 0.7x | Low (1) | 1.05 | More useful on desktop for category exploration. |
Note: Figures are synthesized and estimated from published benchmark data.
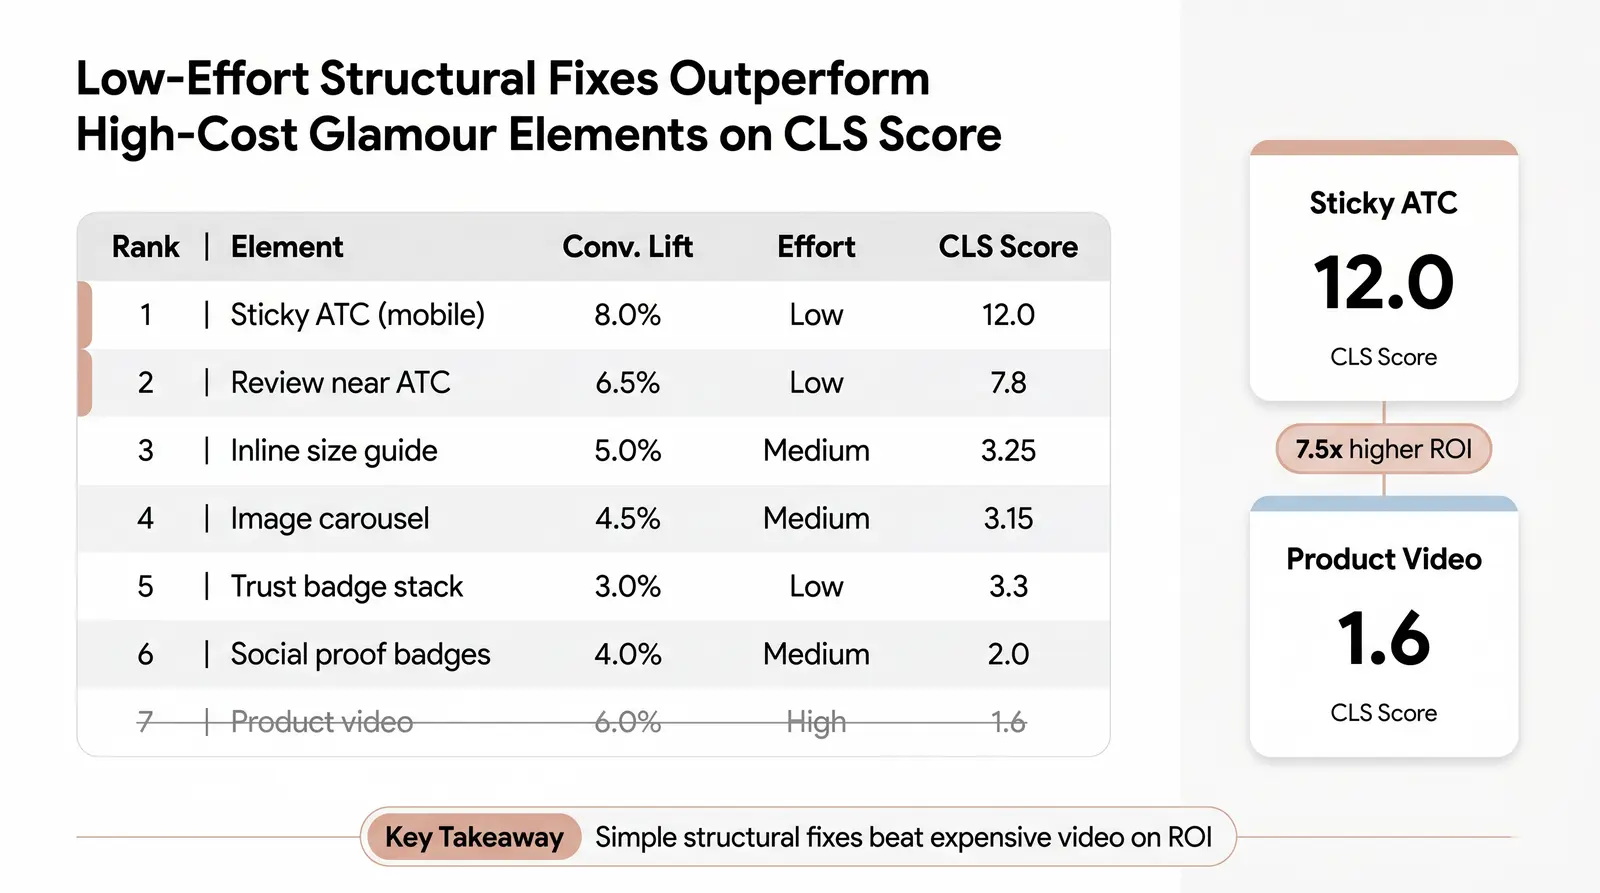
The CLS model reveals that high-effort "glamour" elements like product video often yield a lower return on investment than simple structural fixes. Sticky ATCs and strategic review placement offer massive leverage because they remove friction and build trust exactly where the user needs it, especially on mobile devices.
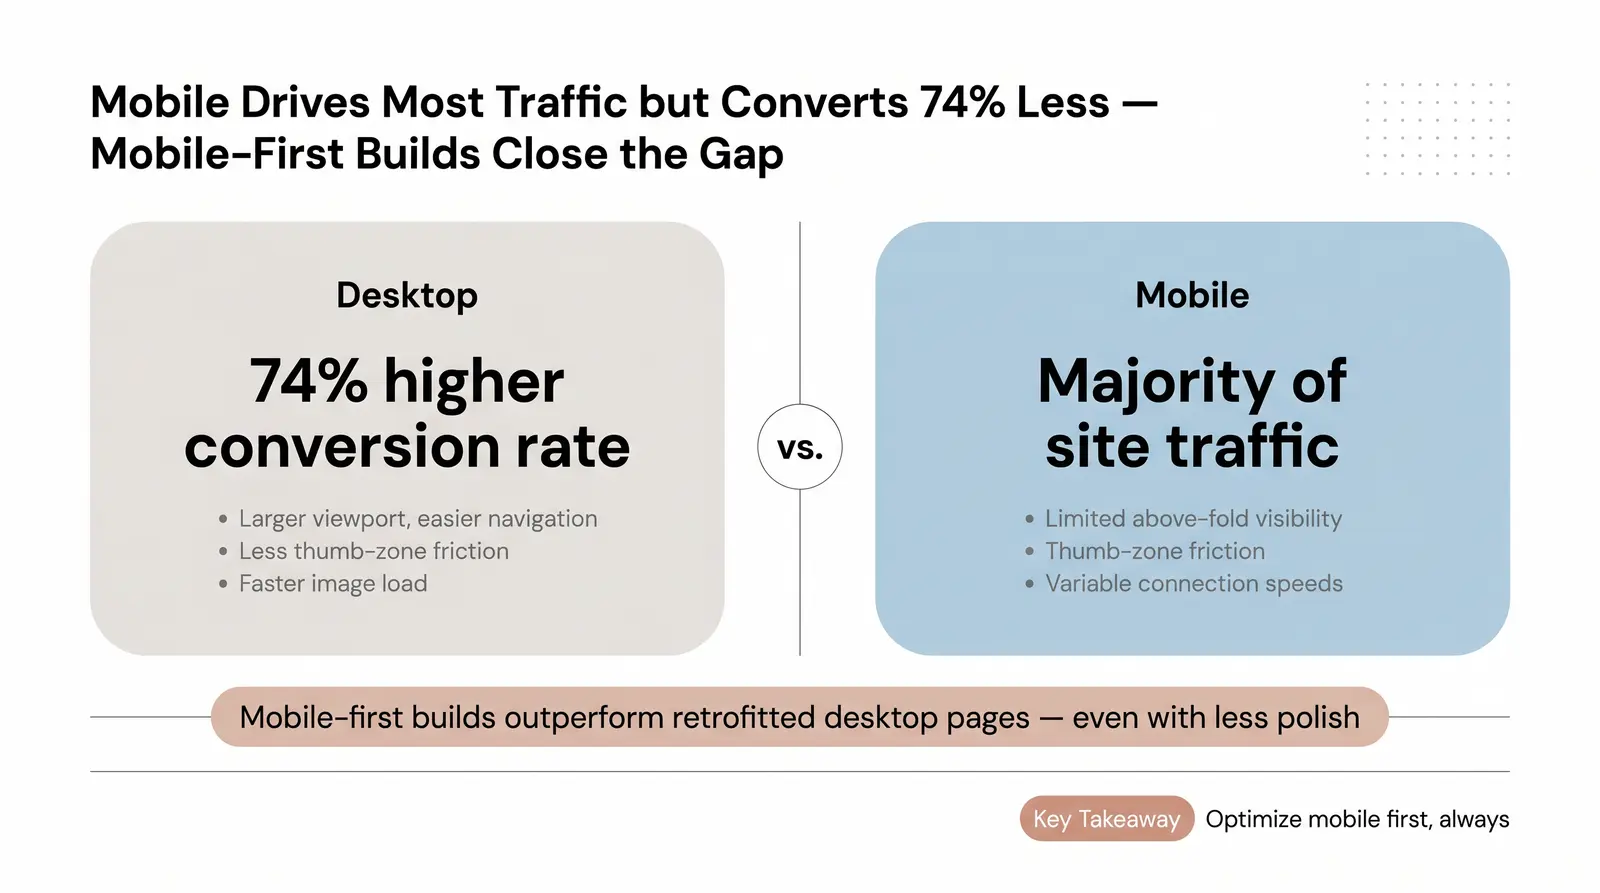
Mobile shoppers interact with product pages differently than desktop users. They face thumb-zone friction, limited above-the-fold visibility, and varying connection speeds that affect image load behavior and video auto-play.
Desktop conversion rates generally outpace mobile. According to Contentsquare's 2024 Digital Experience Benchmark, desktop conversion rates were 74% higher than mobile [2]. However, mobile traffic often accounts for the majority of site visits. This means optimizing the mobile experience is non-negotiable. We consistently see mobile-first builds at Branvas outperform retrofitted desktop pages — even when the visual design is less polished.
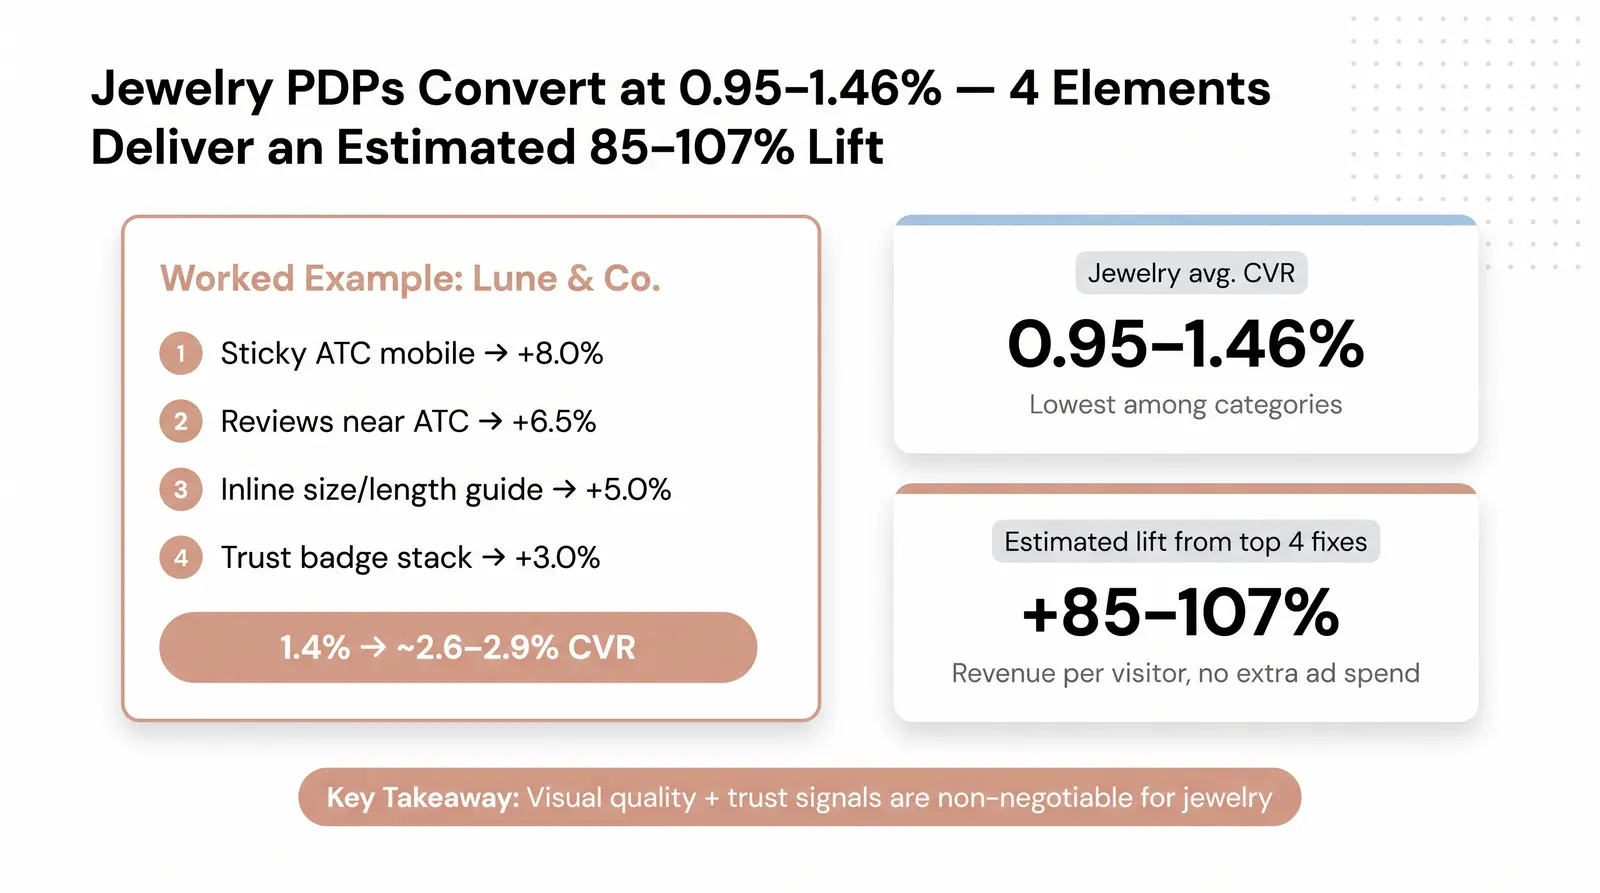
Jewelry and accessories PDPs have unique conversion dynamics. They rely heavily on visual details, trigger size and fit anxiety, and require strong signals of perceived quality. The average ecommerce conversion rate for luxury and jewelry is often the lowest among categories, hovering around 0.95% to 1.46% [3].
In this category, elements like image quality, inline size guides, trust badges, and review placement (especially with photo reviews) have an elevated impact.
Worked Example — The Jewelry PDP Rebuild:
A hypothetical Branvas seller ("Lune & Co.") selling sterling silver layering necklaces had a 1.4% conversion rate. They implemented the top 4 CLS-ranked elements in order: (1) sticky ATC mobile, (2) review placement near ATC, (3) inline size/length guide, (4) badge stack. The result: estimated conversion rate increase to ~2.6–2.9% based on benchmark lift stacking — a potential 85–107% improvement in revenue per visitor, with no increase in ad spend.
If you're launching a jewelry or accessories brand and want a store structure already optimized for these elements from day one, see how Branvas works.
For sellers building on Branvas's infrastructure, many of these are pre-configured — see our ecommerce solutions page.
Q1: What is the single highest-impact change I can make to my product page?
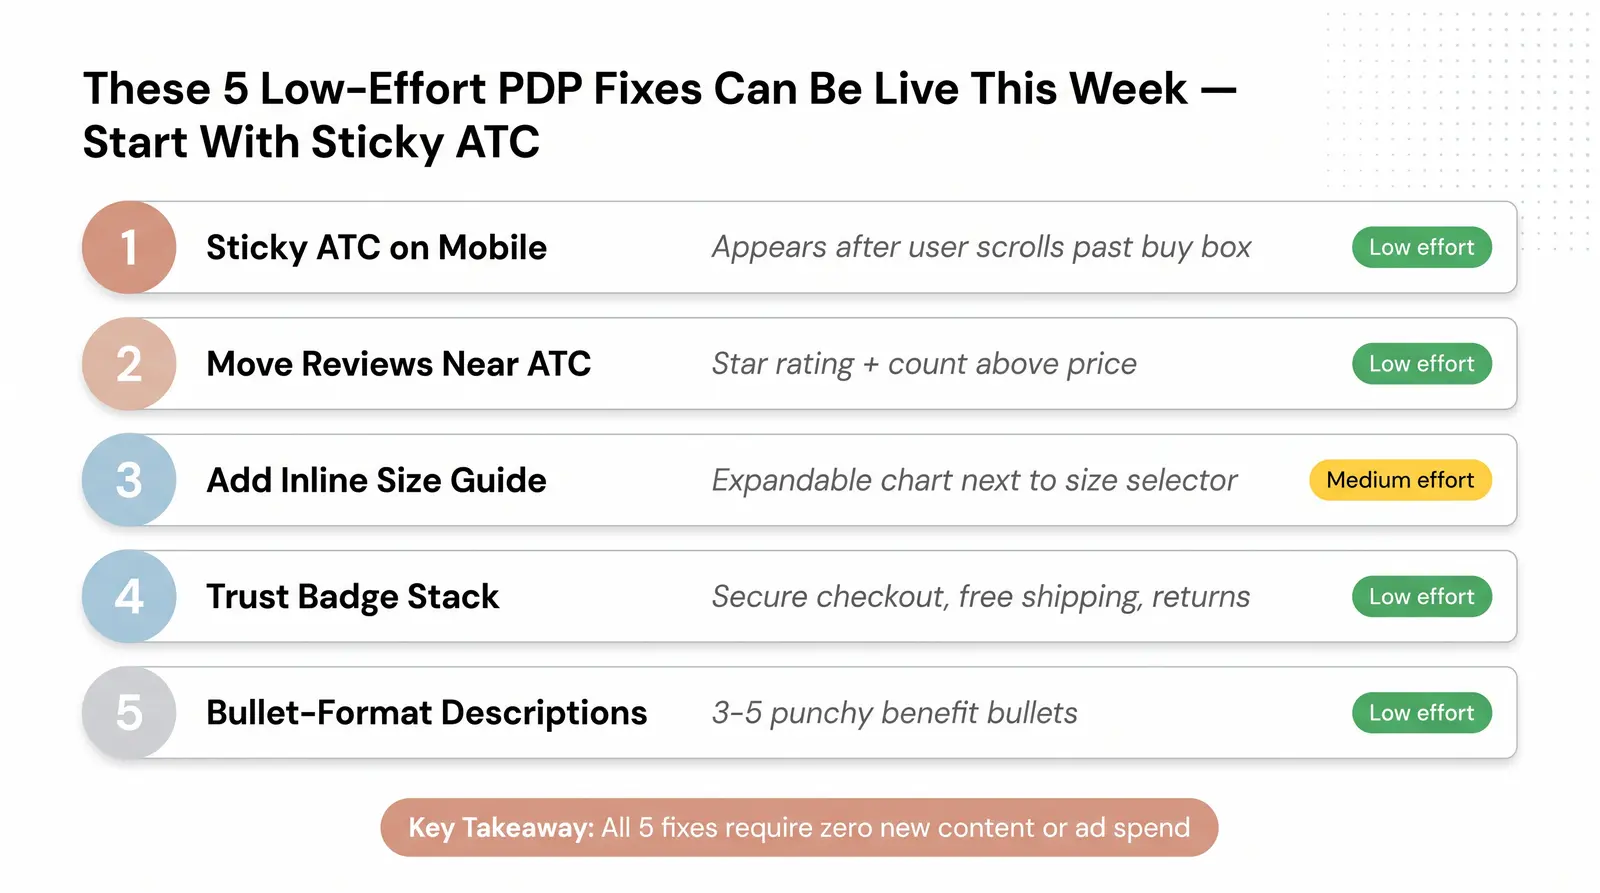
Based on our CLS framework, adding a sticky add-to-cart button on mobile is the highest-impact change. It requires low implementation effort but delivers a significant conversion lift by keeping the primary call to action visible at all times, reducing the friction of scrolling back up.
Q2: Does product video actually improve conversion rates on PDPs?
Yes, product videos can improve conversion rates by helping customers visualize the item. However, their impact is often lower than expected relative to the effort required to produce them, and they can cause load time issues on mobile. Structural elements often provide a better ROI.
Q3: How does sticky add-to-cart affect mobile conversion specifically?
A sticky ATC button drastically reduces friction on mobile devices, where screen real estate is limited and scrolling is required to view product details. By keeping the button in the "thumb zone," users can easily initiate a purchase the moment they decide to buy.
Q4: Where should I place customer reviews on a product page for maximum impact?
Customer reviews should be placed near the add-to-cart button. Displaying the star rating and review count high on the page builds immediate trust, while the full reviews can live further down the page for those who want to read them.
Q5: Do size guides help conversion even for products that don't involve sizing (like jewelry)?
Absolutely. For jewelry, size guides (like necklace length charts or ring sizing guides) are crucial. They reduce fit anxiety and help customers visualize how the piece will look when worn, which is a major barrier to conversion in the accessories category.
Most PDP advice is not prioritized by evidence; it's a laundry list of generic best practices. The PDP Conversion Leverage Score (CLS) framework gives you a structured way to sequence improvements based on real data. As we've seen, sticky ATC on mobile, strategic review placement, and inline guides consistently outperform "glamour" elements like video in conversion lift per effort. For sellers launching new jewelry or accessories brands, starting with a conversion-optimized product page structure from launch is far cheaper than retrofitting later.
Ready to launch a jewelry or accessories brand with a conversion-optimized product experience built in?
Branvas handles product sourcing, branding, and fulfillment — so you can focus on selling.
Explore Branvas →