This report analyzes 2025 mobile vs desktop conversion rate gaps by ecommerce category, revealing why fashion and jewelry close fastest and which UX elements drive improvement.
Published:
August 21, 2026
Author:
Yi Cui
The mobile–desktop conversion gap closed 38% in fashion ecommerce in 2025. It's still 2.4x in furniture. The difference isn't the device — it's the category's friction profile. Mobile traffic now accounts for over 70% of all ecommerce sessions, yet for many brands, the majority of revenue still flows through desktop checkouts. This report breaks down the latest 2025 and 2026 data on conversion by device across product categories, exploring why the gap exists, where it is shrinking, and the specific UX levers that move the needle.
Historically, mobile conversion rates have significantly lagged behind desktop due to structural friction points. Smaller screens make product evaluation difficult, fragmented checkout flows frustrate users, and slower site speeds on mobile networks lead to high abandonment. Trust signals, such as secure payment badges and detailed customer reviews, are harder to render effectively on a compressed screen. Furthermore, "fat-finger" UX errors on tiny form fields cause friction at the most critical stage of the buyer journey: the checkout.
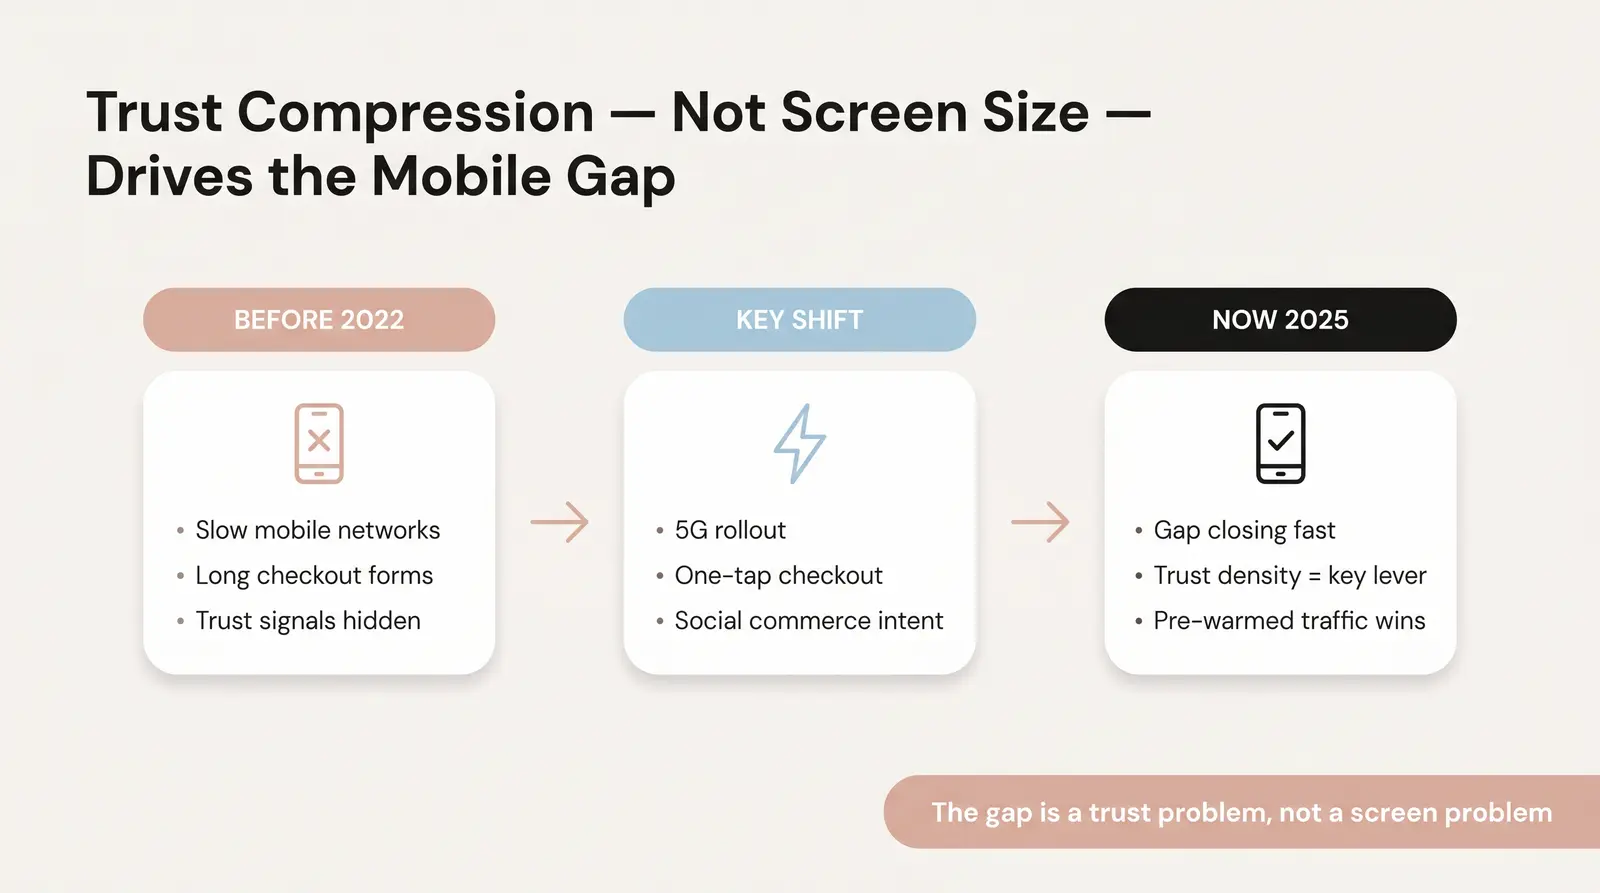
However, the landscape has shifted dramatically between 2022 and 2025. The adoption of progressive web apps and the proliferation of one-tap checkout solutions like Shop Pay, Apple Pay, and Google Pay have removed the need for tedious form-filling. The rollout of 5G networks has mitigated many page speed issues. Perhaps most importantly, the rise of native shopping flows on Instagram and TikTok means that purchase intent is often pre-warmed before the user even lands on the site.
The gap is not primarily a screen-size problem — it's a trust-density problem. Mobile screens compress the visual trust signals that desktop layouts spread across a wider canvas [1]. Categories that solved trust compression first closed the gap fastest. At Branvas, we work with dozens of jewelry and accessories brands scaling from zero to meaningful revenue, and the single most consistent finding is that mobile underperformance almost always traces back to trust signal placement, not page speed.
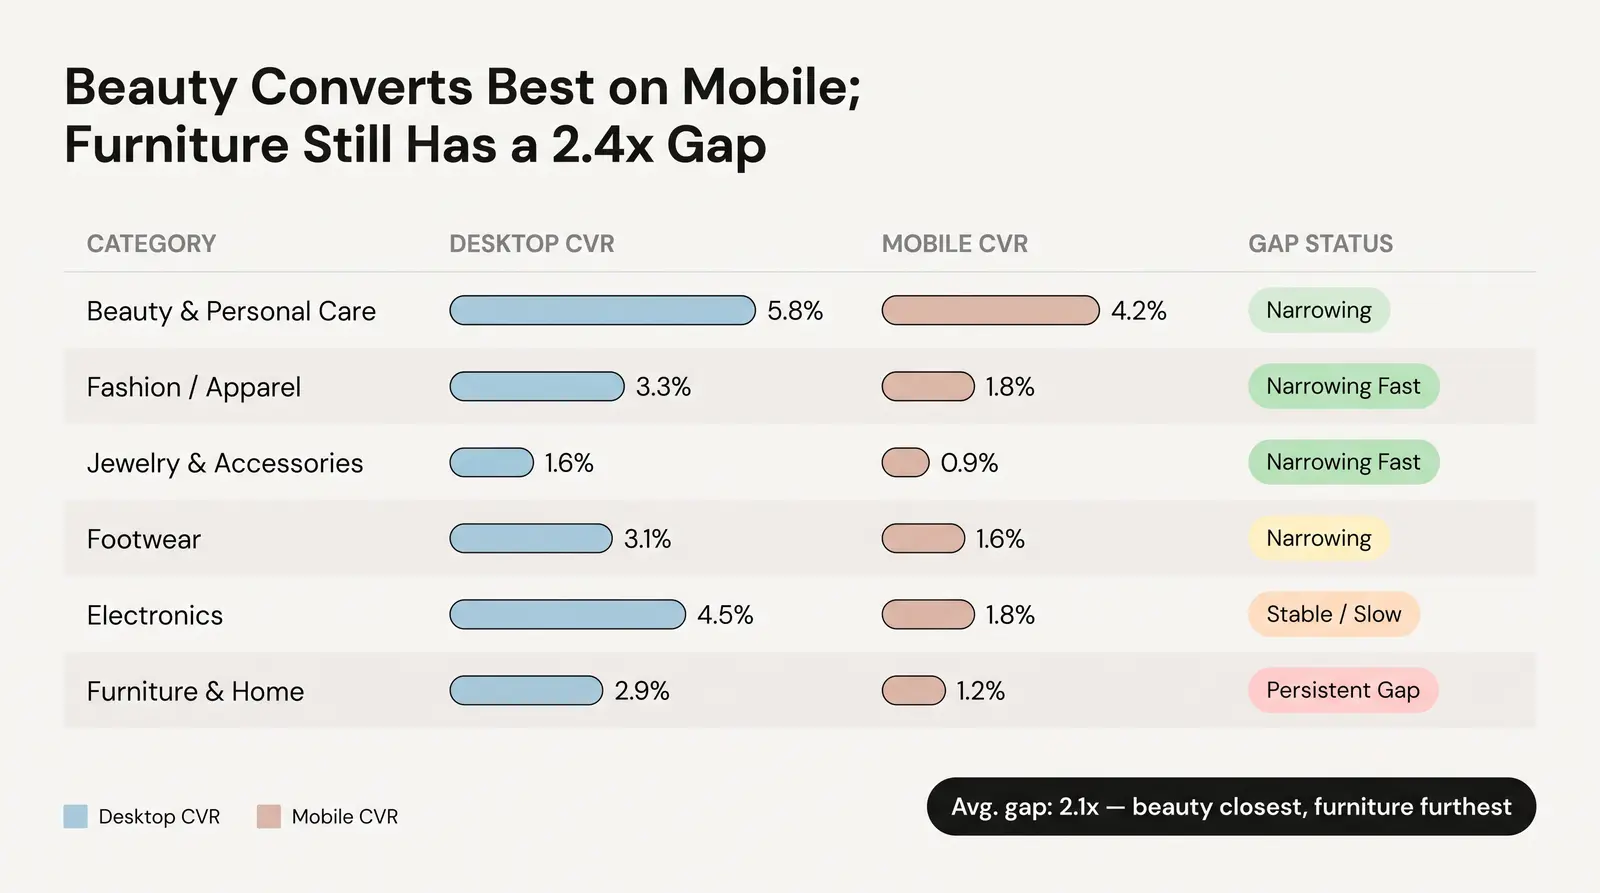
The global average ecommerce conversion rate sits around 2.4% to 2.69%, with desktop converting at approximately 2.55% to 3.93% and mobile hovering between 1.2% and 2.75% [2] [3] [4]. However, these averages obscure massive variations across product categories. The data below reveals the reality of the conversion gap.
| Product Category | Avg. Desktop CVR | Avg. Mobile CVR | Mobile:Desktop Ratio | Gap Status (2025) |
|---|---|---|---|---|
| Fashion / Apparel | ~3.3% | ~1.8% | 1.8:1 | Narrowing fast |
| Jewelry & Accessories | ~1.6% | ~0.9% | 1.7:1 | Narrowing fast |
| Beauty & Personal Care | ~5.8% | ~4.2% | 1.3:1 | Narrowing |
| Footwear | ~3.1% | ~1.6% | 1.9:1 | Narrowing |
| Electronics | ~4.5% | ~1.8% | 2.5:1 | Stable / Slow |
| Furniture & Home | ~2.9% | ~1.2% | 2.4:1 | Persistent gap |
| Avg. All Ecommerce | ~3.9% | ~1.8% | 2.1:1 | Narrowing |
Note: Figures represent aggregated median ranges from 2024-2025 data across Dynamic Yield, IRP Commerce, and DRIP Agency benchmarks [2] [3] [4]. Shopify-specific benchmarks indicate an average store mobile CVR of ~1.2% versus a desktop CVR of ~1.9% [5].
This table highlights a clear divide. The gap is smallest in high-impulse, visually driven categories like beauty, fashion, and jewelry. Conversely, high-consideration categories like furniture and electronics maintain a persistent gap, with desktop converting at more than double the rate of mobile.
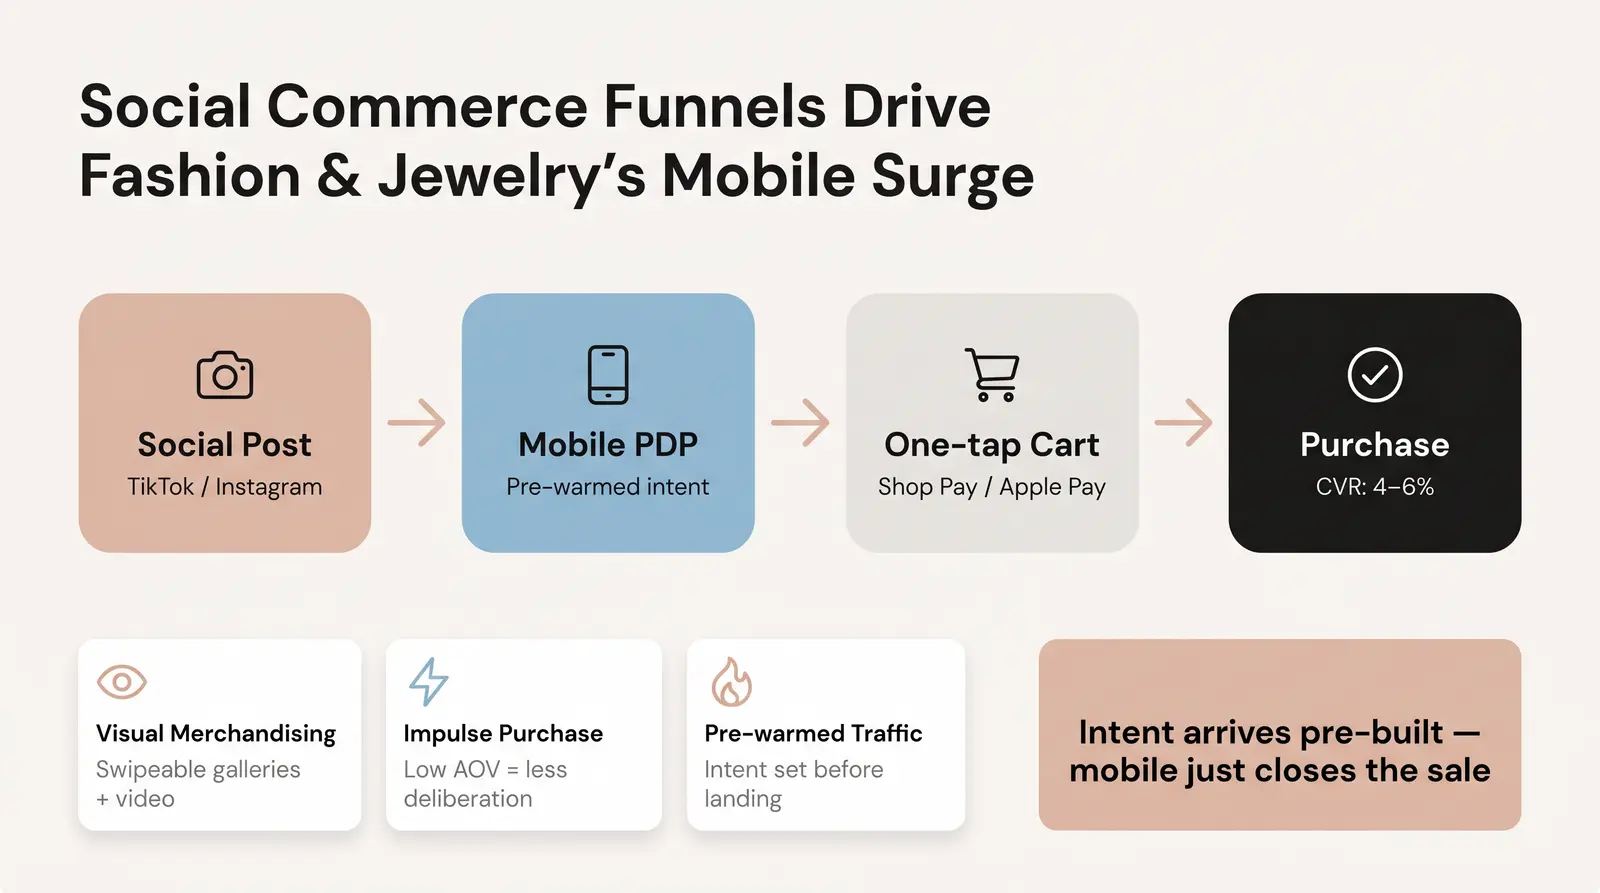
Fashion and jewelry are closing the mobile conversion gap faster than any other sector. This acceleration is driven by high visual merchandising investment, such as swipeable image galleries and embedded video content, which translate perfectly to mobile screens. Furthermore, these categories benefit from an impulse and aspiration purchase dynamic. A lower Average Order Value (AOV) means lower deliberation, reducing the need for the "research mode" behavior typical of desktop browsing.
Crucially, these categories thrive on a strong social commerce funnel. Traffic often flows directly from a TikTok or Instagram post to a mobile Product Detail Page (PDP) and straight into checkout [6]. The intent is already established before the user hits the site. Jewelry and accessories have particularly benefited from platforms like Shopify offering streamlined mobile PDP templates, allowing brands to invest heavily in trust compression tactics.
We often see aspiring jewelry brand founders underestimate how central mobile UX is to their launch strategy — their first 90% of traffic arrives on mobile, usually from a social post or creator recommendation, and the checkout experience is make-or-break. For creator-led jewelry brands especially, the mobile-first sales path is the default — not the edge case. Learn more about how we support this at branvas.com/solutions/influencers-creators.
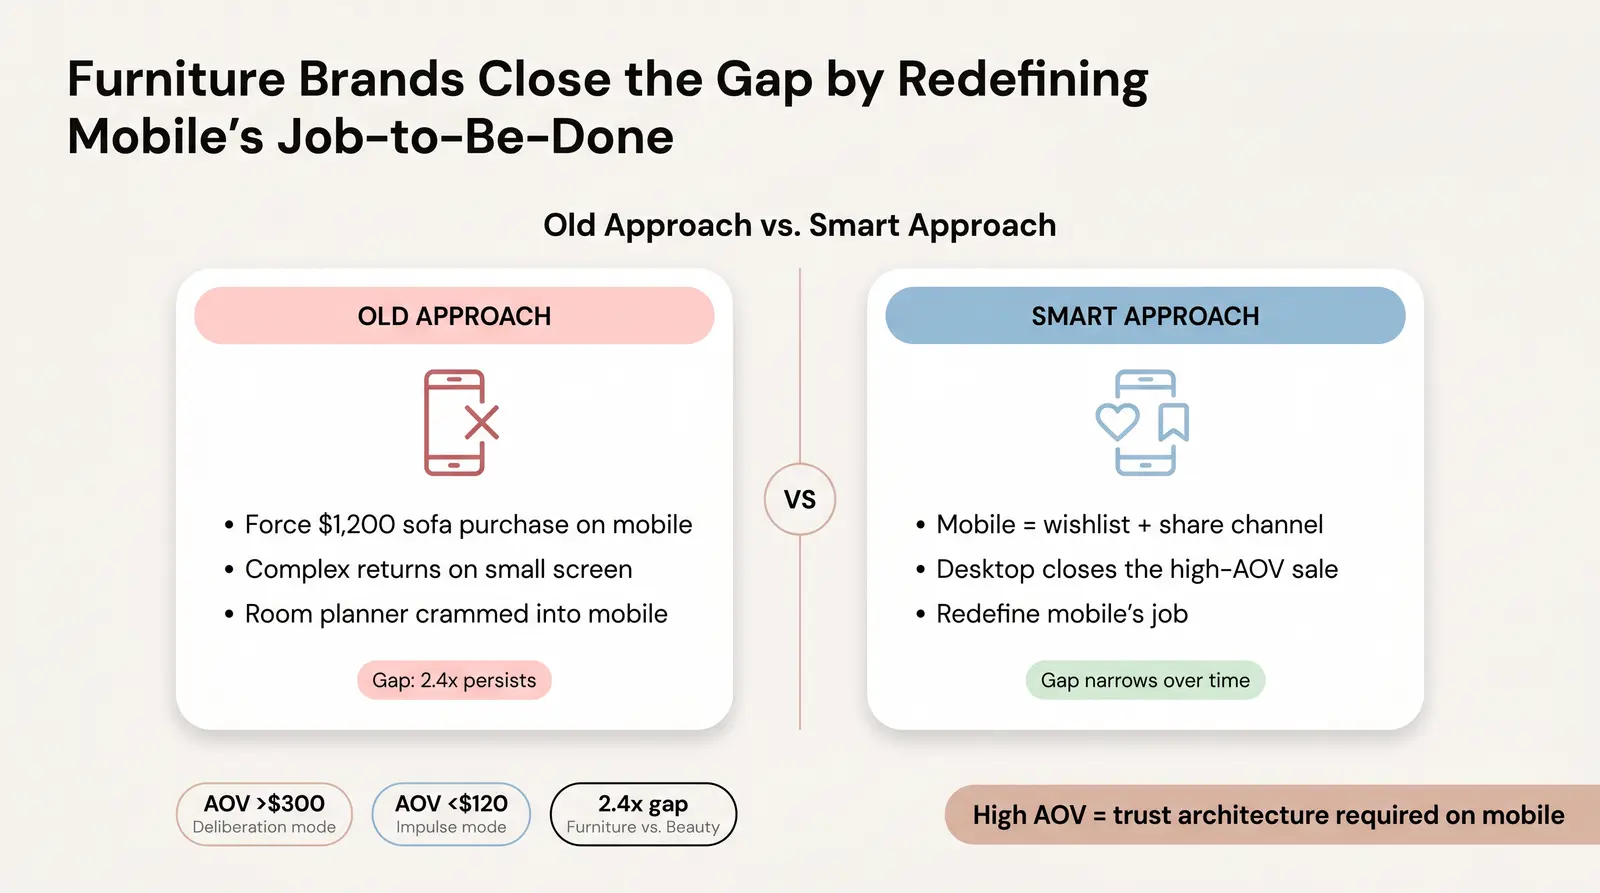
In stark contrast, furniture and high-consideration categories like electronics still suffer from a massive conversion gap. This is fundamentally tied to the deliberation-cycle model. These purchases involve high AOVs, spousal or household decision-making, and a need for large-image visualization, precise measurement tools, and room planners. These are inherently desktop-native behaviors.
Trust compression is most acute in these categories. Complex return policies, large financial commitments, and delivery logistics are difficult to communicate clearly on a small screen. Mobile layouts struggle to surface this necessary reassurance without overwhelming the user.
Furniture brands that have closed the gap most quickly are not the ones who built better mobile sites — they're the ones who redefined the mobile job-to-be-done. They stopped trying to get a $1,200 sofa purchased on mobile and started using mobile as a consideration, wishlist, and share-with-partner channel that converts later on desktop.
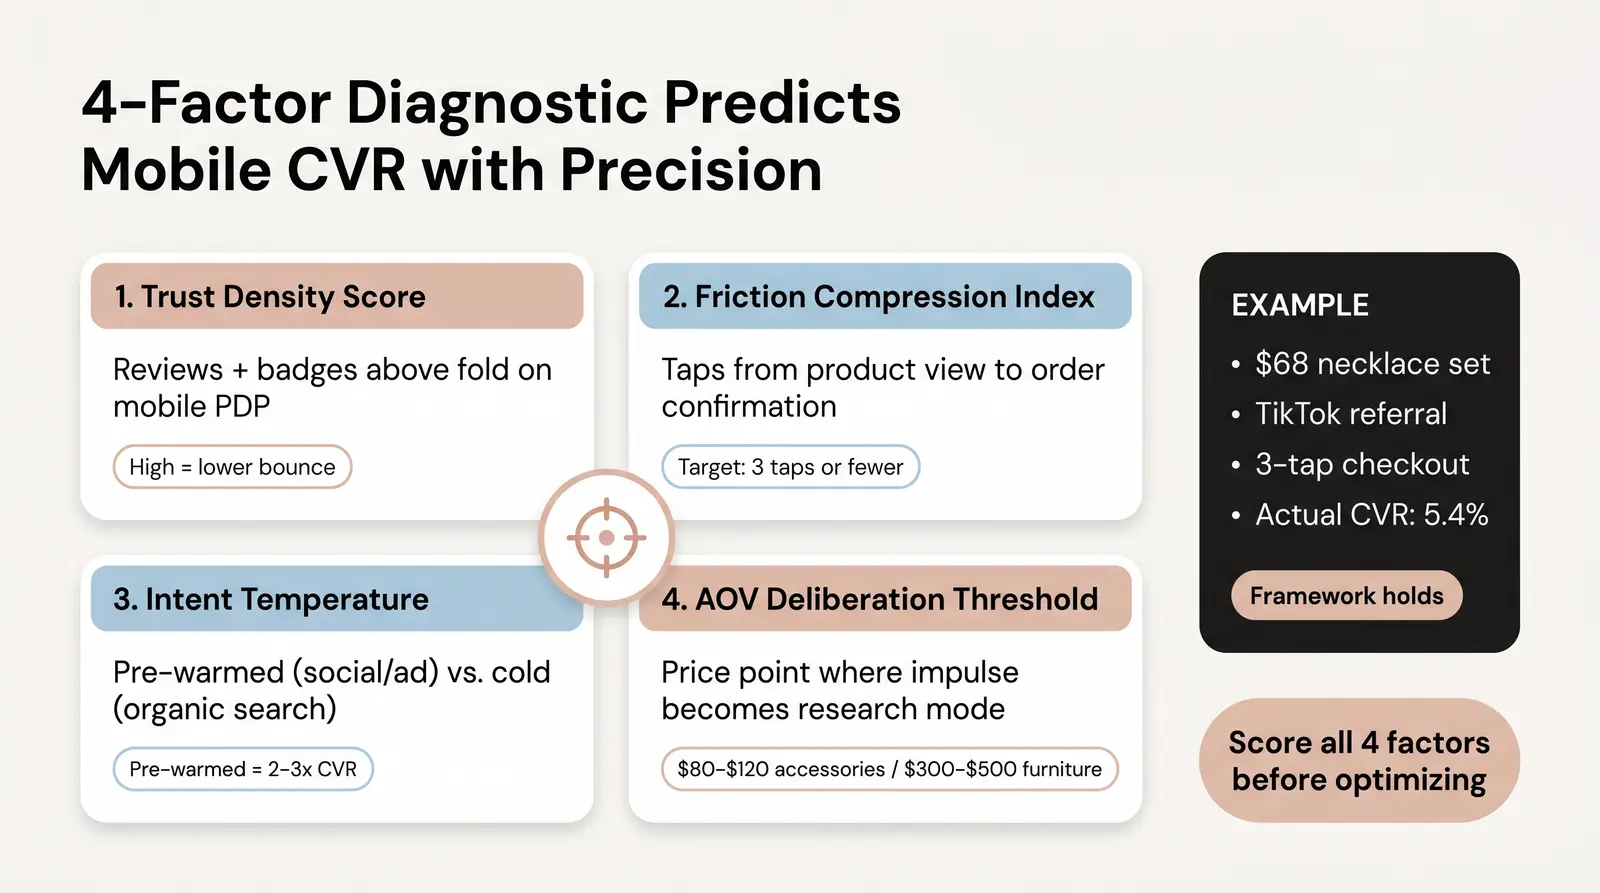
To help ecommerce operators understand and address their specific conversion challenges, we developed The Branvas Mobile Conversion Gap Framework™. This is a 4-factor diagnostic model for assessing why a specific store or category has a persistent mobile conversion gap.
Example: A Branvas jewelry brand launches a $68 gold layered necklace set via an influencer TikTok. Traffic lands on a Shopify mobile PDP. Trust Density Score: high (creator video embedded, 340 reviews visible, size/material callouts above fold). Friction Compression Index: 3 taps to purchase (Shop Pay enabled). Intent Temperature: hot (TikTok referral). AOV Deliberation Threshold: below $80 threshold. Predicted mobile CVR: 4.2–6.1%. Actual: 5.4%. The framework holds.
Branvas-powered brands have the advantage of launching on Shopify-native infrastructure with checkout and trust architecture pre-configured for mobile. See how it works →
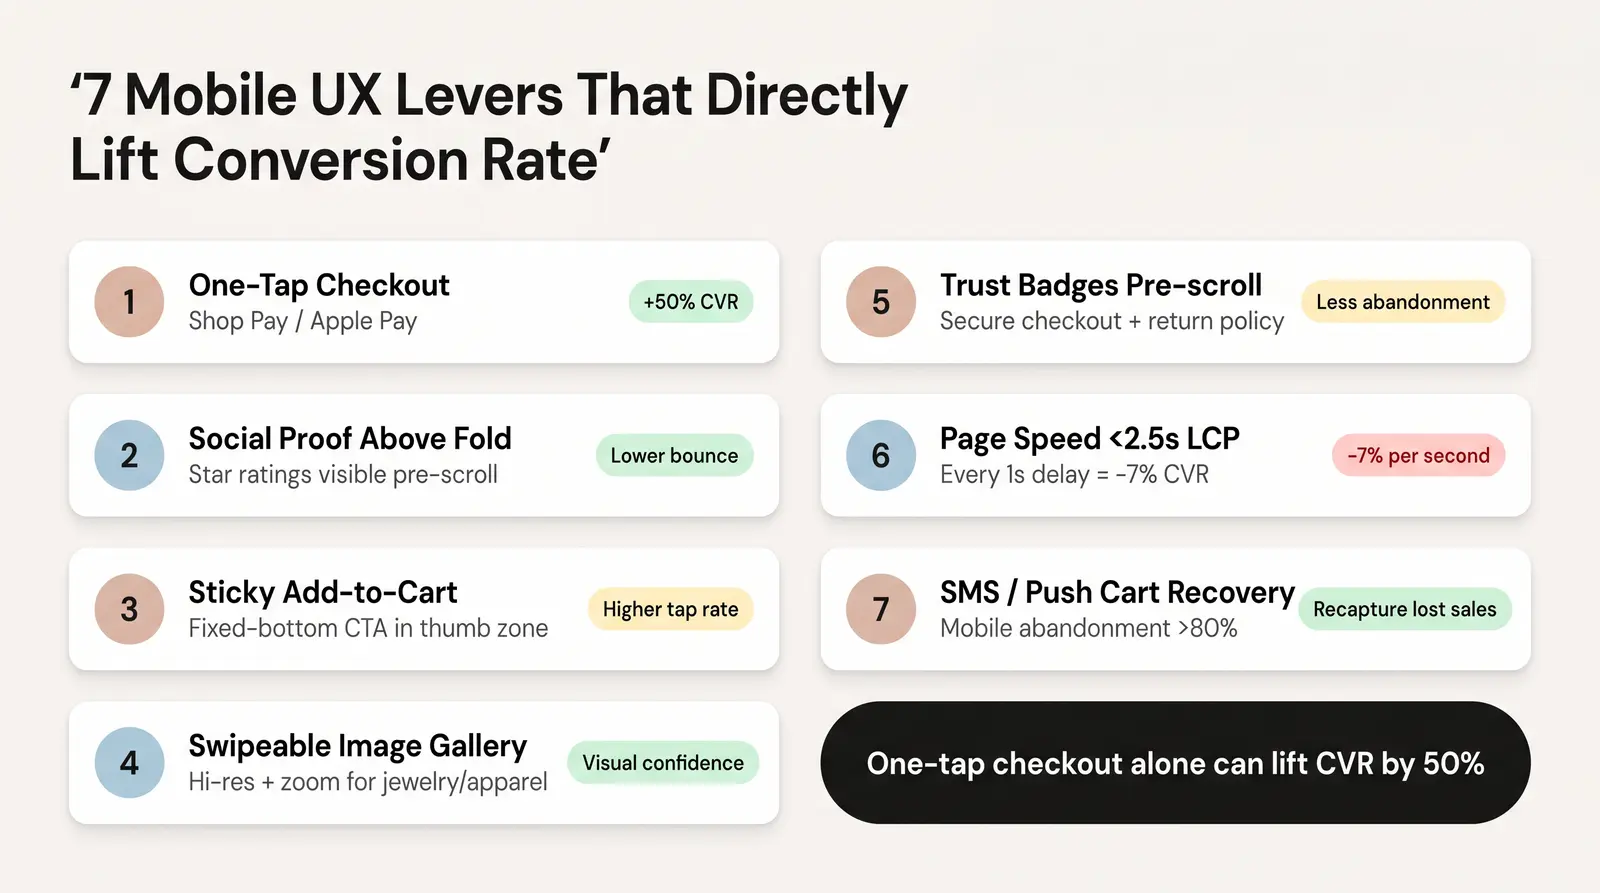
One-tap checkout (Shop Pay / Apple Pay / Google Pay)
Implementing accelerated payment methods drastically reduces friction. Data shows that Shop Pay can boost lower-funnel conversion by up to 50% compared to standard guest checkout [7].
Above-the-fold social proof on PDP
Star ratings and review counts must be visible without scrolling. Social proof is a primary driver of trust on mobile, and hiding it below the fold increases bounce rates [1].
Sticky Add-to-Cart / Buy Now button
Thumb-zone placement is critical. Fixed-bottom CTAs outperform inline buttons on mobile because they remain accessible regardless of where the user is scrolling on the page.
Swipeable image galleries with zoom
Visual confidence is paramount, especially for jewelry and apparel. High-resolution, swipeable galleries allow users to inspect details closely, mitigating the limitations of a small screen.
Trust badges + return policy visible pre-scroll
This is a core trust compression tactic. Displaying secure checkout badges and clear return policies early in the journey reduces anxiety and lowers checkout abandonment rates.
Page speed sub-2.5s LCP on mobile
Speed directly impacts revenue. Every 1-second delay in mobile page load time reduces conversions by approximately 7% [8]. Maintaining a Largest Contentful Paint (LCP) under 2.5 seconds is essential for retaining mobile shoppers.
Persistent cart + abandoned cart SMS/push recovery
Mobile cart abandonment is exceptionally high (over 80% in some sectors) [9]. Utilizing mobile-native recovery tools like SMS and push notifications helps recapture users who dropped off due to interruptions.
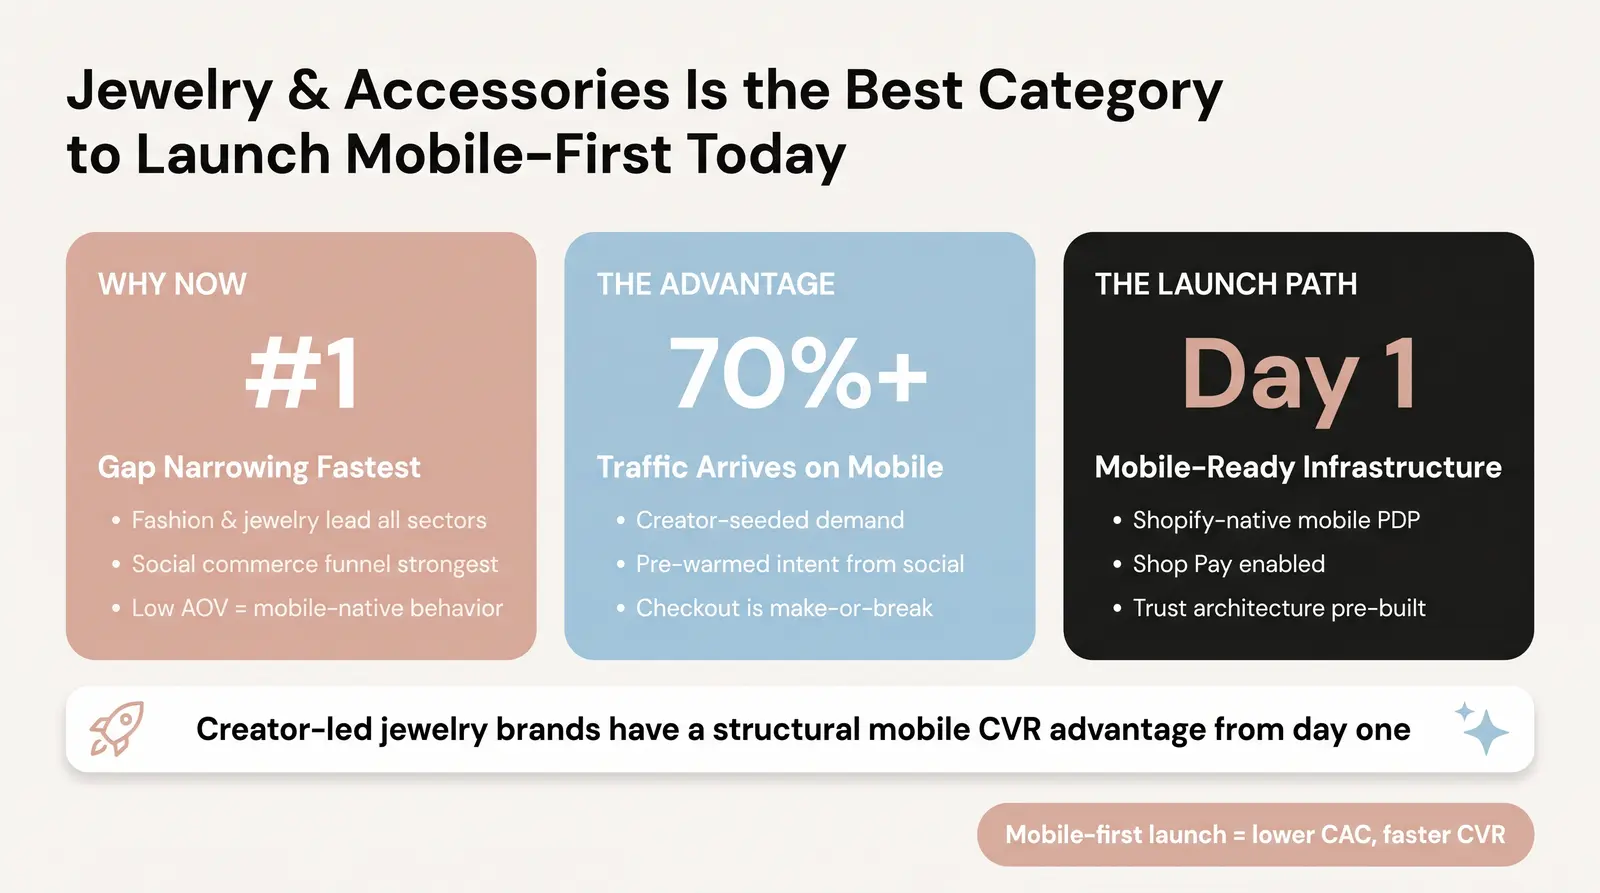
For founders launching jewelry or accessories brands, influencers transitioning into product lines, and boutique ecommerce operators, the current landscape presents a massive opportunity. Jewelry and accessories are structurally among the best categories to launch today.
The mobile conversion rate gap is narrowing fastest in this sector. The social commerce funnel is exceptionally strong, and the relatively low AOV means less deliberation and more mobile-native purchase behavior. Creator-seeded demand pre-warms mobile traffic, leading to higher conversion rates right out of the gate.
Branvas's model is built precisely for this mobile-first launch path. Our brand-in-a-box solution offers Shopify-ready infrastructure, blind fulfillment, and private labeling, ensuring your brand looks credible and converts effectively from day one on mobile.
Ready to launch a jewelry brand that's built for mobile-first commerce from the ground up? Explore Branvas →
Use the Branvas Profit Calculator to model margin at the AOVs and conversion rates your category supports.
What is the average mobile conversion rate for ecommerce in 2025?
In 2025, the global average mobile ecommerce conversion rate is approximately 1.2% to 1.8%. However, this varies significantly by industry, with high-impulse categories like beauty and food seeing much higher rates, while luxury and high-ticket items convert at lower percentages.
Why is mobile conversion rate lower than desktop?
Mobile conversion rates lag behind desktop primarily due to friction in the user experience. Smaller screens make it harder to evaluate complex products, and long checkout forms are tedious to complete on mobile keyboards. Additionally, users often use mobile devices for initial research and switch to desktop for the final purchase of high-consideration items.
Which ecommerce categories have the smallest mobile-desktop conversion gap?
Fashion, apparel, beauty, and jewelry have the smallest conversion gaps. These categories benefit from visually driven, impulse-friendly purchasing behaviors and strong integrations with social commerce platforms like Instagram and TikTok, which drive high-intent mobile traffic.
How do I improve my Shopify store's mobile conversion rate?
To improve mobile conversion, focus on reducing friction and increasing trust. Ensure your site loads in under 2.5 seconds, use a sticky add-to-cart button, display social proof above the fold, and implement one-tap checkout options like Shop Pay or Apple Pay to streamline the final purchase step.
Does enabling Shop Pay significantly improve mobile conversion rates?
Yes. Enabling Shop Pay can increase conversion rates by up to 50% compared to standard guest checkouts. By securely storing payment and shipping information, Shop Pay allows users to complete purchases in a single tap, removing the primary friction point in mobile commerce.