Men's jewelry market statistics for 2026 reveal a $42–$59 billion planning range, Gen Z as the highest-engagement cohort, and chains and rings as the strongest launch categories.
Published:
September 22, 2026
Author:
Yi Cui
Men's jewelry is the fastest-growing end-user segment in some current industry forecasts and one of the least documented. Every statistics page seems women-first. This one is not.
That gap matters because a founder, investor, or creator cannot build a product strategy from a total-jewelry number mislabeled as men's demand. The data below separates true male-specific estimates from broader proxies, shows where evidence is thin, and turns the strongest signals into practical decisions.
The most important number is also the least honest to present as a single fact. Research houses disagree because they do not define men's jewelry the same way.
Table 1: Men's Jewelry Market Size: Cross-Source Reconciliation
| Source | 2024 Market Size Estimate | 2026 Projected Size | CAGR | Methodology Note (sample source, regional scope, product scope) |
|---|---|---|---|---|
| Polaris Market Research, current edition | $48.56B, male-specific | n/a | 9.9%, 2025–2034 | Global men's-only commercial estimate. Covers rings, bracelets, necklaces, cufflinks, and earrings, with precious and non-precious materials. Full sizing model is gated.1 |
| Prophecy Market Insights | $35.87B, male-specific | n/a | 8.6%, 2024–2034 | Global men's-only commercial estimate. Includes necklaces, rings, earrings, bracelets, precious and non-precious materials, and online/offline channels. Full model is gated.2 |
| Grand View Research | n/a | n/a | 4.8%, 2026–2033 | Global men end-use slice of the jewelry market, not a separately defined standalone industry. Public page gives $97.51B for 2025 and $140.10B for 2033, but no 2024 or 2026 value.3 |
| Mordor Intelligence | n/a | n/a for men; $394.74B total-market proxy only | 6.03% for men's segment through 2031 | Global finished gems and jewelry across men, women, and children. Uses desk research, interviews, top-down sizing, and selective bottom-up checks. No male dollar value is public.5 |
Table note: “n/a” means the publisher does not print that male-specific value. The table does not back-calculate missing source figures. For planning only, the editorial 2026 range below compounds Prophecy's $35.87B 2024 base for two years at 8.6%, producing about $42.3B, and Polaris's printed $53.23B 2025 value for one year at 9.9%, producing about $58.5B. These calculations are not publisher-issued 2026 estimates.
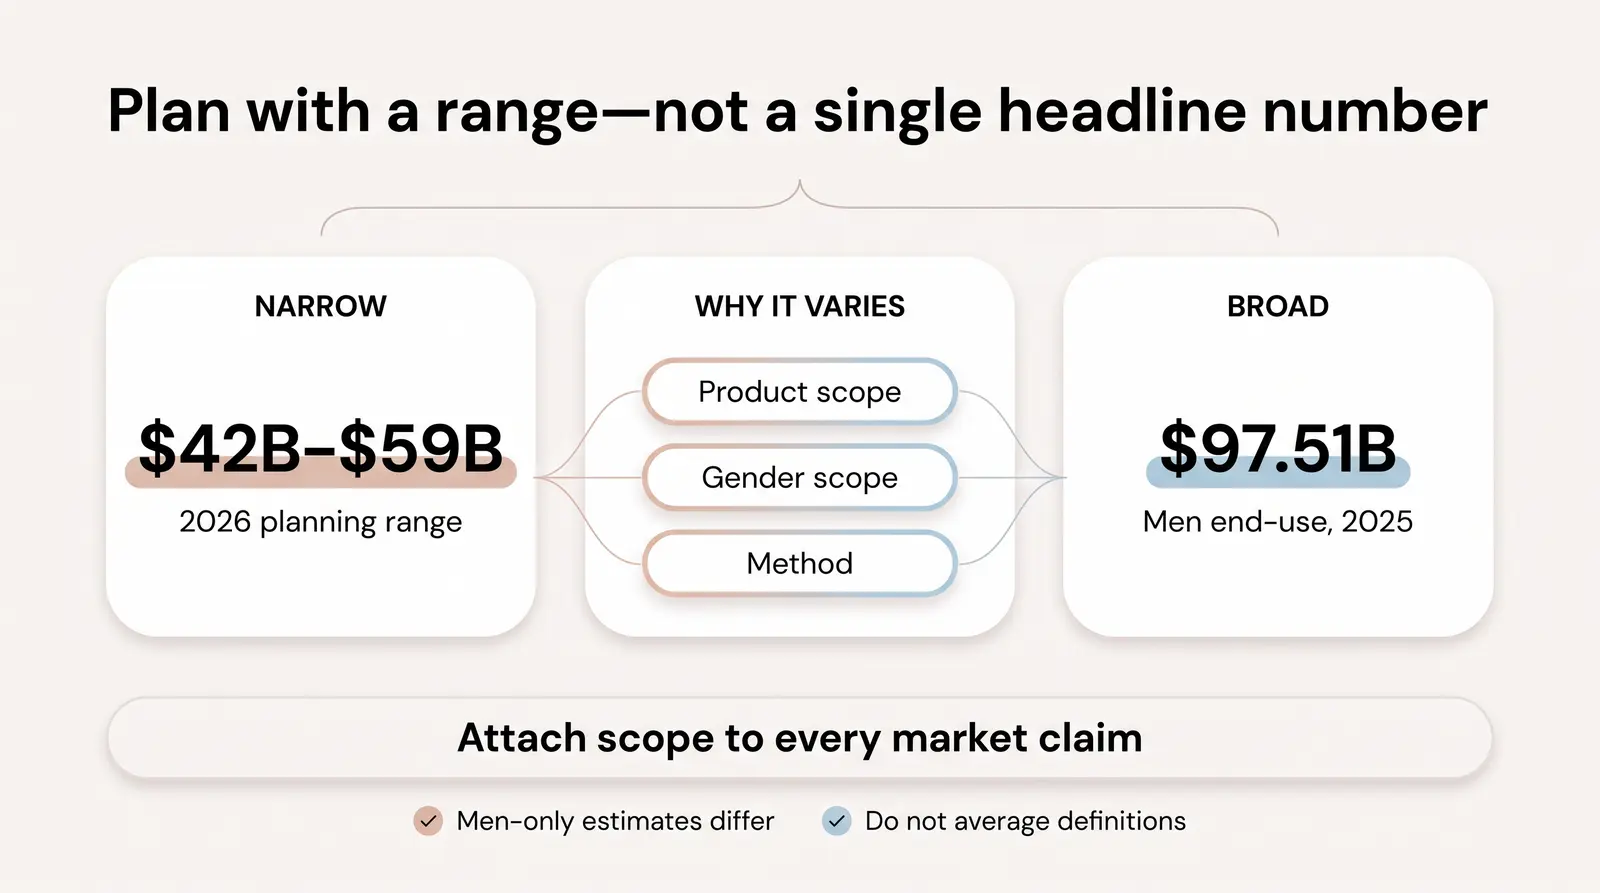
For a narrow standalone definition, the most defensible 2026 planning range is therefore about $42 billion to $59 billion. It is a triangulation, not a consensus forecast.
For a broad end-use definition, that range is too low. Grand View Research identifies a $97.51 billion global men segment in 2025, within its much larger jewelry universe, and forecasts $140.10 billion by 2033.3 That result should sit beside the narrower studies, not be averaged with them.
Mordor and IMARC provide useful boundaries. Mordor estimates all global gems and jewelry at $394.74 billion in 2026 but publishes no male value. IMARC reports $384.2 billion for all global jewelry in 2025 and likewise offers no public gender split.5 8 Neither total is a men's jewelry estimate.
Methodology transparency note: “Men's jewelry market” can mean a men's-only product universe, a male end-user slice of all jewelry, or a segment inside costume or luxury jewelry. Watches, wedding bands, cufflinks, loose stones, unisex products, and fashion jewelry may be included in one study and excluded or separated in another. Commercial summaries disclose segmentation and forecast periods, but usually not reproducible sizing equations. Use a figure only with its publisher, year, product boundary, and gender scope attached.
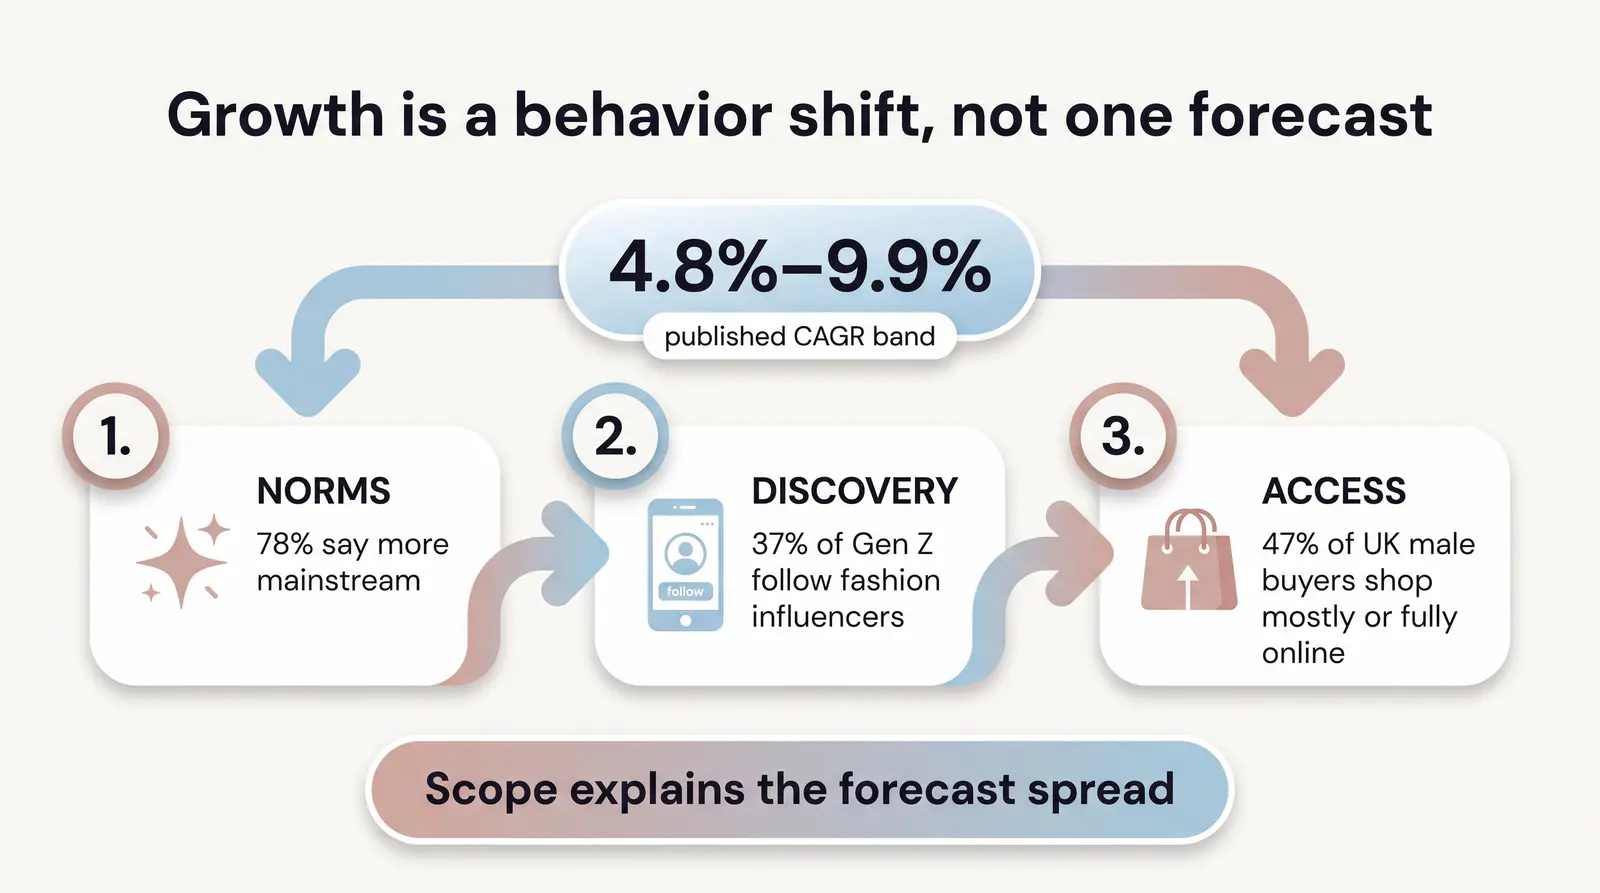
Published men's growth rates form a broad band. Grand View gives its men end-use segment a 4.8% CAGR for 2026–2033. Mordor projects 6.03% for men in gems and jewelry through 2031, 7.56% for men's costume jewelry, and 7.91% for men's luxury jewelry. Polaris and Prophecy forecast 9.9% and 8.6% for their standalone men's markets.1 2 3 5 6 7
The first driver is a change in norms. In a March 2024 survey of 1,002 U.S. men, 78% said men's jewelry was becoming more mainstream. Among Gen Z respondents, 66% considered jewelry essential to their style and 40% preferred gender-neutral designs.9 These are attitudes from a retailer-published survey, not national purchase incidence, but they show how the permission to wear jewelry is widening.
The second driver is social discovery. In the same survey, 37% of Gen Z men followed fashion influencers and 15% said they had bought jewelry recommended by an influencer.9 Vogue's coverage of Bad Bunny's necklace stacks, Lewis Hamilton's jewelry, and Barry Keoghan's pearls illustrates how unfamiliar forms become easier to style when audiences see them repeatedly.14 15
The third driver is easier access. A 2025 YouGov survey found that 47% of British men who had self-purchased jewelry bought mostly or entirely online, compared with 35% who usually bought in person.11 Digital access reduces the friction of asking for styling help, comparing materials, or entering a traditional jewelry store.
At Branvas, we've watched men's jewelry go from an afterthought in our catalog requests to one of the most-requested product categories by new brand founders; the shift happened faster than anyone predicted.
The contrarian view is not that published totals are wrong. It is that broad reports can under-identify or lag fast-moving men's fashion and direct-to-consumer niches. McKinsey's influential outlook, for example, is explicitly scoped to fine jewelry and premium-to-ultra-luxury watches, while trade coverage documents independent designers selling through their own sites and social discovery.18 19 20
Official U.S. e-commerce measurement can include online orders, so social sales are not automatically missing. What often disappears is the product niche, creator attribution, small-brand route, or speed of trend turnover.21 Aggregate coverage and segment visibility are different problems.
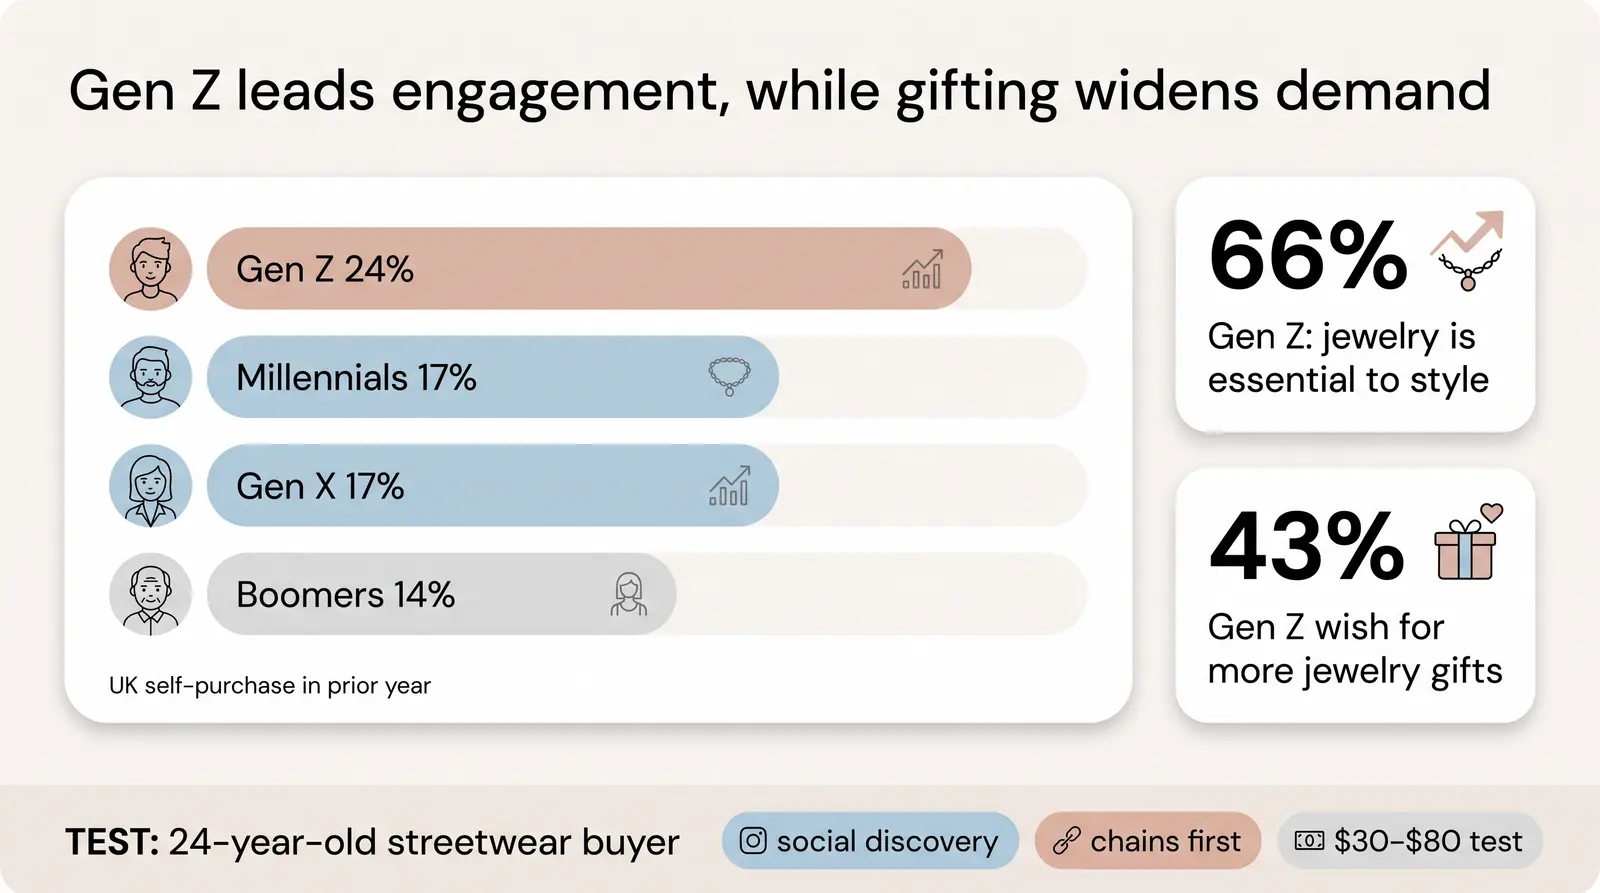
Gen Z supplies the strongest engagement signal, but not the whole customer base. The U.S. survey found that 66% of Gen Z men viewed jewelry as essential to their style, more than one in three sought styling inspiration on social media, and planned 2024 jewelry spending averaged $475.9 The public report does not disclose the Gen Z subgroup size, so these results are directional.
The clearest cross-generation comparison comes from Britain. YouGov found that 24% of Gen Z men had bought jewelry for themselves in the prior year, compared with 17% of Millennials, 17% of Gen X, and 14% of Baby Boomers.11 Those are UK self-purchase rates, not U.S. adoption rates.
Psychographically, the opportunity combines self-expression, status, identity, and meaning. Personalized pendants, engraved signets, mixed materials, and gender-neutral styling let a buyer signal affiliation without buying traditional fine jewelry.13 Sentiment also matters: in a survey of 2,000 Americans, 86% preferred jewelry with emotional significance over a more expensive but less meaningful piece, although that result was not men-only.12
Gifting is easy to overlook. In the U.S. men's survey, 28% wished they received more jewelry as gifts, rising to 43% among Gen Z respondents. At the same time, 58% of the overall sample said they rarely purchased jewelry for themselves.9 A brand that only targets male self-purchasers misses partners, parents, and friends looking for a meaningful but style-safe gift.
The tempting claim is that “a 24-year-old U.S. streetwear buyer who follows 3+ fashion influencers is statistically the highest-converting demographic for $30–$80 chain necklaces.” No reviewed dataset proves that exact cross-tab, price band, or conversion ranking.
It is still a strong testable launch hypothesis. A 24-year-old sits inside the cohort with the highest UK self-purchase rate and the strongest U.S. style engagement. Chains also rank behind watches and wedding rings among regularly worn pieces, and more than two-thirds of surveyed U.S. men were willing to wear a chain or necklace.9 11
For product, start with one clean chain, one textured option, and one pendant-compatible style. For price, treat $30–$80 as an accessible merchandising test, not a proven optimum. For channel, lead with short styling demonstrations, material clarity, measurements, and outfit pairing, then retarget viewers to a simple product page.
Regional conclusions are less settled. Grand View says Asia Pacific was the largest men end-use region in 2025 and expects India to post the highest growth through 2033. Polaris's current standalone study instead gives North America 58.15% of 2024 revenue and forecasts Asia Pacific at 10.2% growth.1 3 The contradiction is a warning to validate geography against the exact market definition.
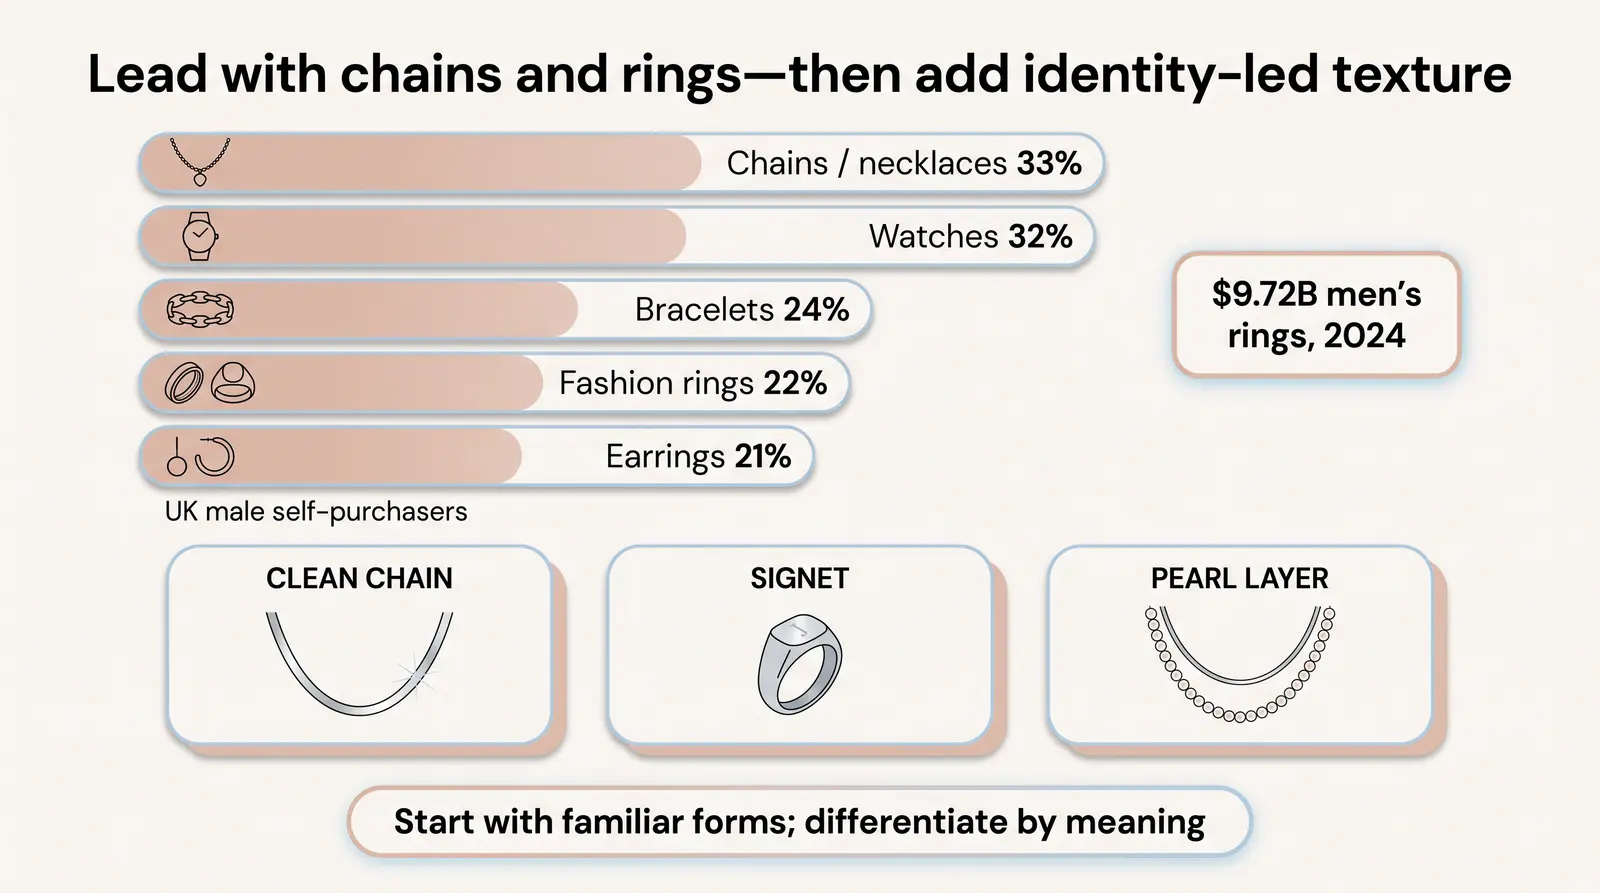
The observed hierarchy is clearer than the market shares. U.S. men reported regularly wearing watches, wedding rings, chains or necklaces, bracelets, and non-wedding rings, in that order. Among British male self-purchasers, chains or necklaces led at 33%, followed by watches at 32%, bracelets at 24%, fashion rings at 22%, and earrings at 21%.9 11
Table 2: Men's Jewelry Category Share and Trend Velocity
| Category | Estimated Market Share % | YoY Search Trend (Google Trends direction) | Key Demographic | Avg. Price Point Range | Social Driver |
|---|---|---|---|---|---|
| Chain necklaces | 25%–35% | n/a, no reproducible export verified | Gen Z and Millennial streetwear/lifestyle buyers | $30–$150 | Necklace stacks, mixed lengths, creator styling |
| Pendants | 5%–10% | n/a, no reproducible export verified | Identity-led and gift buyers | $40–$180 | Talismans, initials, symbols, personalization |
| Rings, including signets and bands | 20%–30% | n/a, no reproducible export verified | Broad age range; ceremony plus daily wear | $50–$500 | Engraving, heritage forms, statement styling |
| Bracelets, including chain, bead, and leather | 15%–25% | n/a, no reproducible export verified | Entry buyers and stackers | $25–$150 | Mixed materials, modularity, easy gifting |
| Earrings, including studs and hoops | 8%–15% | n/a, no reproducible export verified | Younger, fashion-forward buyers | $50–$250 | Celebrity red-carpet and music visibility |
| Other, including cuffs, brooches, and anklets | 5%–10% | n/a, no reproducible export verified | Experimental and occasion-led buyers | $30–$300+ | Runway styling and niche subcultures |
Table note: Every share and price range is a Branvas editorial directional estimate, not a published market distribution or audited platform statistic. The bands synthesize the available men's wear and purchase rankings, Polaris's ring-revenue evidence, YouGov's UK product mix, and dated editorial price examples. They are deliberately broad, may overlap, and should not be added as if they were a measured census. “Avg. Price Point Range” means a practical assortment band, not a statistical average. Google Trends publishes normalized relative interest from 0 to 100, not absolute search volume. No reproducible query export was supplied, so no direction or index is invented.1 9 11 14 16
In our experience at Branvas, chain necklaces and signet rings consistently top new brand launch requests; they're the category pair that converts fastest for founders starting with a 3–5 SKU lineup.
The modern men's pearl story is a cultural translation rather than a measured market-share event. Vogue documented Barry Keoghan and Lewis Hamilton wearing subtle pearls with streetwear and suits, while also placing Harry Styles' pearl choker and Rihanna's layered styling in the broader visual lineage.15
That visibility changes the styling instruction. Pearls can be worn as a restrained single strand, mixed with metal chains, or used as one texture inside a layered look. Vogue's June 2024 gift guide included a $180 men's pearl necklace, but that was one editorial selection, not a category average or a 2026 price benchmark.14
There is no verified Google Trends export here for “pearl necklace men.” The defensible conclusion is that celebrity and editorial visibility have widened the style vocabulary, not that a specific search index proves mass adoption.
Signet rings work because they connect heritage with personalization. Nialaya's 2024 trend editorial highlighted sleek gold, silver, and platinum signets, including engraved and gemstone details, as versatile everyday pieces.13
Polaris estimates the entire men's ring segment at $9.72 billion in 2024, while Vogue featured a $595 signet in its 2024 gift guide.1 14 Neither figure measures signets alone. Together, they show a commercially meaningful parent category and a premium editorial example, not a signet market share.
For a launch assortment, one plain signet, one engravable face, and one statement finish cover three jobs: entry, identity, and visual impact.
Important: unaudited merchant-trend observations. No auditable Branvas order export, time series, SKU-level volume file, or price dataset was supplied for this article. The snapshot is qualitative. It contains no percentages, growth rates, average selling prices, GMV, or independently verified rankings.
Share of launch activity: Men's styles have moved from an occasional add-on to a recurring part of new-brand assortment conversations. We are not publishing a share of merchant orders because a verified denominator is unavailable.
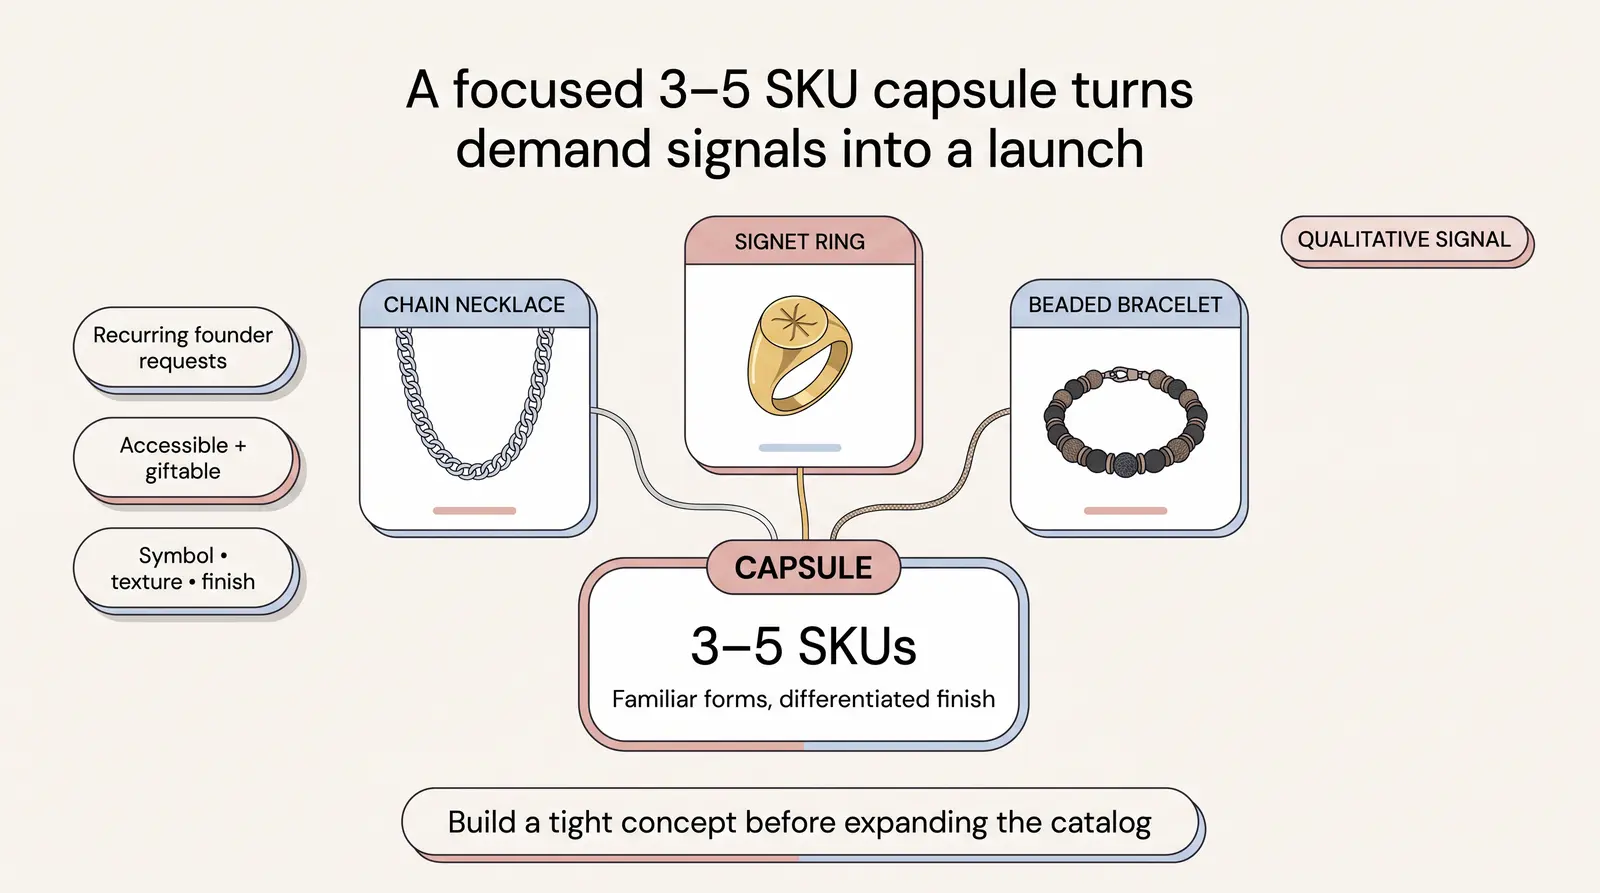
Most frequently observed form-factor requests: Chain necklaces, signet rings, and beaded bracelets recur most often in merchant conversations. This is a directional request pattern, not an audited top-three order-volume table.
Price positioning: Men's briefs tend to center on accessible, giftable mid-tier positioning, while women's briefs often span a wider set of forms and price anchors. We are not stating men's or women's averages without a comparable transaction extract.
The practical signal is that founders often position men's jewelry as a focused capsule rather than a large catalog. A tight group of familiar forms, differentiated by finish, symbolism, or texture, mirrors the broader move toward accessible self-expression.
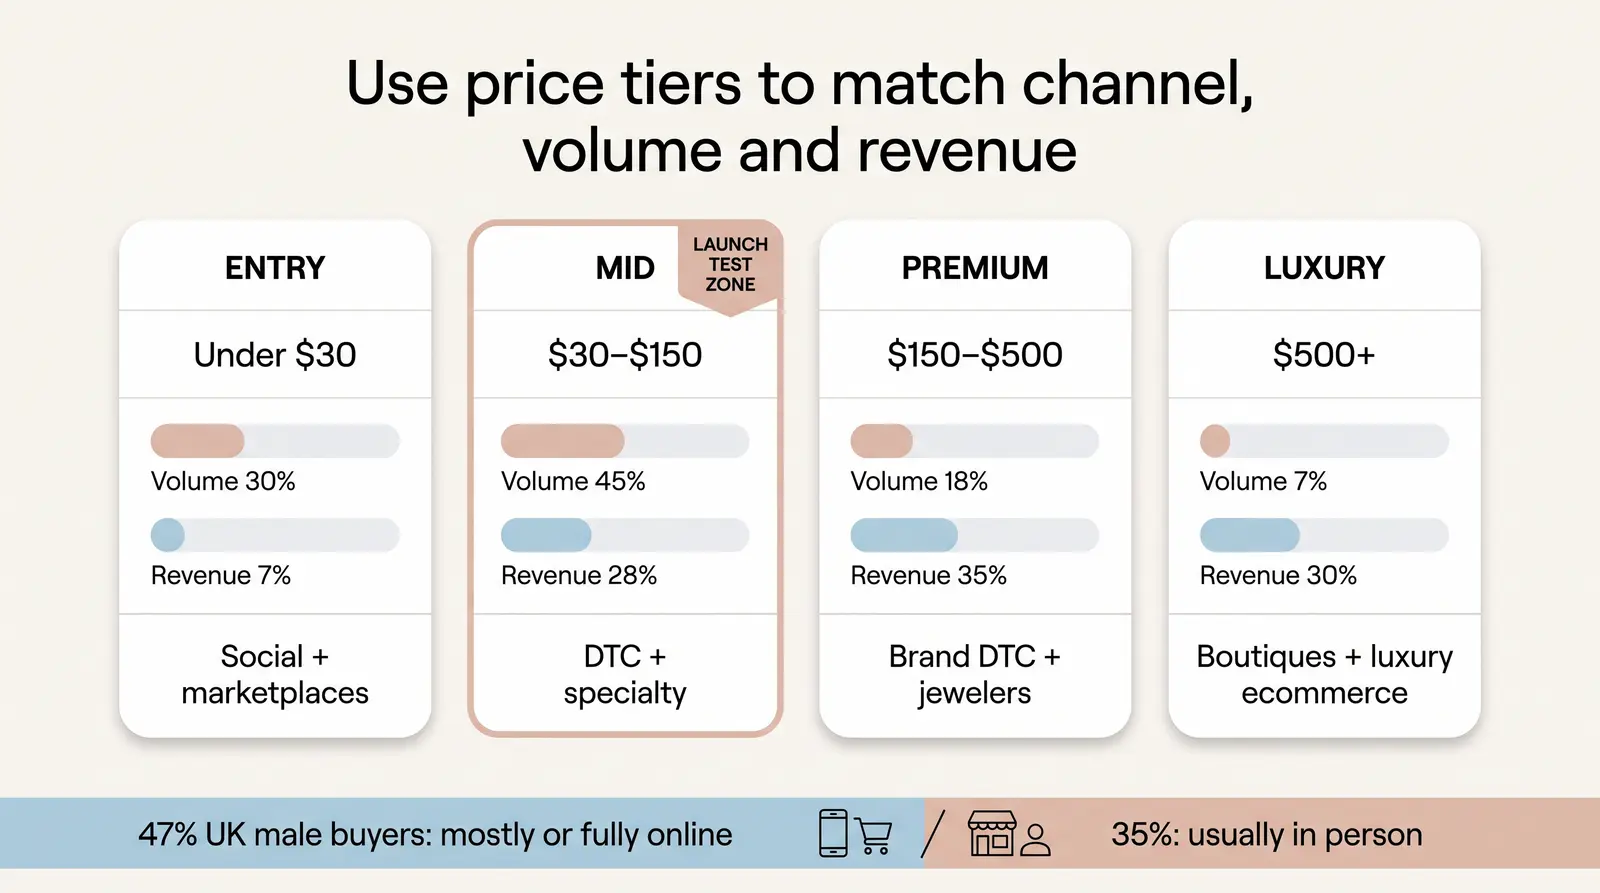
Men's jewelry spans impulse accessories to heirloom pieces. Volume is likely to concentrate below $150, while a smaller number of precious-metal, gemstone, and branded purchases can carry a disproportionate share of revenue.
Table 3: Men's Jewelry Price-Point Distribution by Channel
| Price Tier | Volume Share Est. | Revenue Share Est. | Dominant Channel | Key Consumer Profile |
|---|---|---|---|---|
| Entry, under $30 | ~30% | ~7% | Marketplaces and social-led storefronts | First-time, trend-testing, gift add-on |
| Mid, $30–$150 | ~45% | ~28% | DTC sites, marketplaces, and specialty retail | Gen Z/Millennial self-purchaser and accessible gift buyer |
| Premium, $150–$500 | ~18% | ~35% | Brand DTC, jewelers, and department stores | Material-conscious buyer seeking durability or meaning |
| Luxury, $500+ | ~7% | ~30% | Jewelers, boutiques, and luxury ecommerce | Occasion, status, collector, and heirloom buyer |
Table note: Volume and revenue shares are rounded Branvas editorial directional estimates, constructed as a planning model rather than measured market facts. They are informed by YouGov's incomplete UK annual-spend bands, Digital Commerce 360's $337 median ticket for its defined U.S. Top-1000 online jewelry set, and Vogue's dated product examples. Annual spend, basket tickets, and item prices are not equivalent, so the model should be replaced with first-party transaction data before forecasting.11 14 17
Channel data requires equal care. Grand View estimates that offline retail held 83.92% of global all-jewelry revenue in 2025 and forecasts online jewelry retail to grow at 8.0% annually through 2033.4 That is not a men's split.
The strongest men-specific comparison is YouGov's UK buyer survey: 47% bought mostly or entirely online, 35% usually bought in person, and 15% split purchases evenly. Independent or local jewelers were used by 39%, marketplaces by 30%, and brand websites by 18%.11 These are self-reported outlet-use rates, not revenue shares.
DTC sites, creator-led discovery, and marketplaces matter because they let a narrow men's concept reach buyers without national wholesale distribution. Public evidence does not establish a global men's DTC or social-commerce share, so claims of an “outsized” role should remain strategic, not numerical.19 20
If you're exploring launching a men's jewelry brand, Branvas's profit calculator can help you model margins across these price tiers before you commit to a product line.
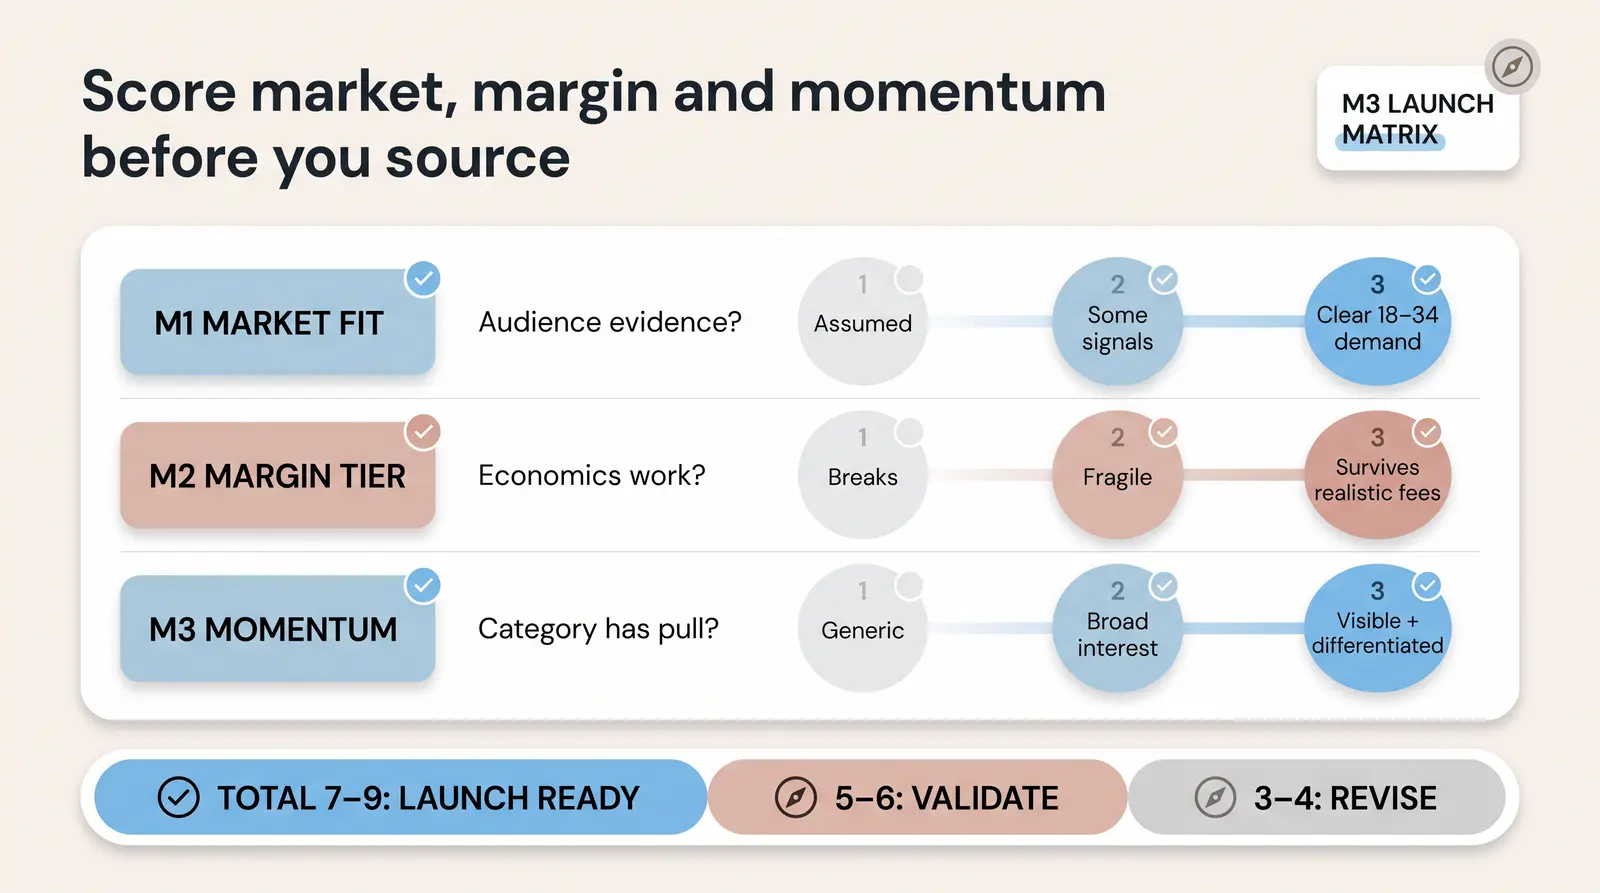
Branvas uses the M3 Launch Matrix, short for Market fit × Margin tier × Momentum category, to help founders validate a men's jewelry niche before sourcing. It turns an attractive trend into three decisions that can be tested.
M1, Market Fit: Does the founder's audience skew male and 18–34, with visible interest in fashion, streetwear, music, fitness, or lifestyle? Existing comments, saves, email clicks, and product questions are stronger than a guessed persona.
M2, Margin Tier: Which price band matches the route to market? TikTok Shop and marketplaces often need low-friction offers. Shopify DTC can support storytelling and bundles. Boutique wholesale needs room for retailer margin.
M3, Momentum Category: Which form factor has credible social visibility, repeated customer interest, and room for differentiation? Momentum without niche fit creates a copycat product. Niche fit without momentum creates an education burden.
Table 4: M3 Launch Matrix: Scoring Guide
| Dimension | Score 1 | Score 2 | Score 3 |
|---|---|---|---|
| M1: Market Fit | Audience fit is assumed; no behavioral signal | Some relevant audience engagement or adjacent sales | Clear 18–34 male interest, repeated product signals, or proven adjacent demand |
| M2: Margin Tier | Target price, landed cost, and channel fees do not work | Margin works only under optimistic conversion or discount assumptions | Margin survives realistic fees, fulfillment, promotions, and returns |
| M3: Momentum Category | Category is generic or declining in the niche | Broad interest exists, but differentiation is weak | Visible momentum plus a specific underserved angle and clear 3–5 SKU story |
Scoring note: Add the three scores. A total of 7–9 indicates high launch readiness, 5–6 means validate one weak dimension, and 3–4 means revise the concept before sourcing.
For creators, the matrix pairs naturally with Branvas's solutions for influencers and creators: use audience evidence for M1, unit economics for M2, and content response for M3.
The “faster” outcome below is an internal operating observation, not a revenue guarantee or audited performance claim.
Founders who walk through the M3 Matrix with us before sourcing tend to launch with a tighter SKU set and hit their first $10K in sales faster. See how Branvas works →
No reviewed research house publishes a definitive male-specific 2026 total. Men's-only 2024 estimates range from $35.87 billion at Prophecy to $48.56 billion at Polaris.1 2 Compounding disclosed source rates gives an editorial 2026 planning range of about $42 billion to $59 billion for narrower standalone definitions. Grand View's broader men end-use slice was $97.51 billion in 2025, showing why definitions cannot be mixed.3 Quote a range with its scope rather than presenting one universal number.
No current reviewed source provides a reliable global percentage of men who wear jewelry regularly. A 2024 U.S. survey found that 78% believed men's jewelry was becoming more mainstream, but that measures perception, not wear frequency.9 The same survey ranked watches and wedding rings first among regularly worn pieces, followed by chains or necklaces, bracelets, and non-wedding rings. In Britain, 17% of men said they had self-purchased jewelry in the previous year, which is a purchase measure rather than a wearing rate.11
Watches and wedding rings remain important entry forms, while chains or necklaces, bracelets, non-wedding rings, and earrings lead the broader style assortment.9 Among British male self-purchasers, chains or necklaces were the most commonly selected item at 33%, just ahead of watches at 32%.11 Polaris reports $9.72 billion in 2024 revenue for the global men's ring segment.1 Public evidence does not provide a complete global male category-share table, so exact shares for chains, bracelets, and earrings should be treated as directional estimates.
Some publishers identify men as the faster-growing end-user segment, but the answer depends on category and period. Grand View describes men as the fastest-growing end-user group and gives it a 4.8% CAGR for 2026–2033.3 Mordor forecasts 6.03% for men in its broad gems-and-jewelry market, 7.56% in costume jewelry, and 7.91% in luxury jewelry through 2031.5 6 7 These rates cannot be compared with women's shares or converted into male revenue without each report's underlying segment tables.
The strongest evidence is cultural visibility, not a published sales share. Vogue documented Barry Keoghan and Lewis Hamilton wearing subtle pearl necklaces with both streetwear and suits, while Harry Styles helped establish the pearl choker as a recognizable men's styling cue.15 Pearls also fit the wider movement toward gender-neutral design, which 40% of Gen Z men preferred in one U.S. survey.9 No reproducible Google Trends export was supplied, so an exact search index or year-over-year rate would be invented. Treat pearls as a visible momentum style that still needs audience testing.
Three conclusions matter. First, men's jewelry is already a large global business, but its 2026 size depends on whether a study counts a standalone men's product market or a male end-use slice of all jewelry. The honest answer is a scoped range, not one magic number.
Second, younger buyers are expanding the category's visual language. Chains, signets, pearls, earrings, and mixed materials work as identity tools, while gifting remains a major but underdeveloped demand path. Gen Z has the strongest measured engagement, but Millennials and Gen X still represent meaningful self-purchase audiences.
Third, channel behavior is changing faster than top-line market tables imply. Stores still dominate total jewelry revenue, yet male self-purchasers can be highly digital. DTC brands, marketplaces, and creator-led discovery make focused 3–5 SKU concepts viable, even when broad reports cannot isolate that niche.
Men's jewelry remains undercovered, high-growth, and increasingly shaped by younger cohorts and social commerce. The opportunity is not to chase every trend. It is to match the right audience, margin tier, and momentum category with evidence.
If you're ready to launch a men's jewelry brand, or add men's styles to an existing line, Branvas gives you the infrastructure to do it without inventory risk. Explore the Branvas catalog → or learn how it works.
- Men's Jewelry Market Demand, Analysis Report, 2025–2034: Polaris Market Research, 2025
- Men's Jewelry Market Share and Demand Will Surpass USD 75.9 Billion by 2034: Prophecy Market Insights, 2024
- Men: Jewelry Market Statistics: Grand View Research, 2026 data page
- Jewelry Market Size, Share & Trends Report, 2033: Grand View Research, 2026
- Gems and Jewelry Market Analysis, Industry Growth, Size & Trends: Mordor Intelligence, 2026
- Costume Jewelry Market Size, Share & 2031 Trends Report: Mordor Intelligence, 2026
- Luxury Jewelry Market Size, Share & 2031 Growth Trends Report: Mordor Intelligence, 2026
- Jewelry Market Size, Share, Growth & Trends Report 2034: IMARC Group, 2026
- 2024 Men's Jewelry Style Trends Survey: Luke Zion Jewelry, 2024
- Men Open to Wearing Jewelry, Survey Finds: JCK, 2024
- What Jewellery Are Men Buying and Why?: YouGov, 2025
- Surveying Americans on Giving and Receiving Jewelry: Shane Co., 2023
- Men's Jewelry Trends to Watch in 2024 & 2025: Nialaya, 2024
- The Best Men's Jewelry Gifts to Ice Out Every Man in Your Life: Vogue, 2024
- Why, Yes, Summer Pearl Necklaces Can Be Cool: Vogue, 2024
- FAQ About Google Trends Data: Google, accessed 2026
- Jewelry Ecommerce Statistics: Digital Commerce 360, 2023 data
- State of Fashion: Watches & Jewellery: McKinsey & Company and The Business of Fashion, 2021
- Cutting Out the Middleman: Rapaport, 2022
- Jewelry Designers Are Creating Ways to Sell Directly to Consumers: JCK, 2020
- Quarterly Retail E-Commerce Report: General FAQs: U.S. Census Bureau, accessed 2026