The PREP-X Framework ranks five levers for reducing ecommerce returns by impact, helping store owners diagnose root causes and fix the highest-leverage problem first.
Published:
August 17, 2026
Author:
Yi Cui
Most stores try to reduce returns by tweaking their return policy. That's the wrong place to start. Three of the five real levers exist entirely upstream of the policy: in the product page, the size data, the photography, and the box the customer opens. This article gives you a ranked, diagnostic system, not generic advice, so you can identify the root cause of your returns and fix the highest-leverage problem first.
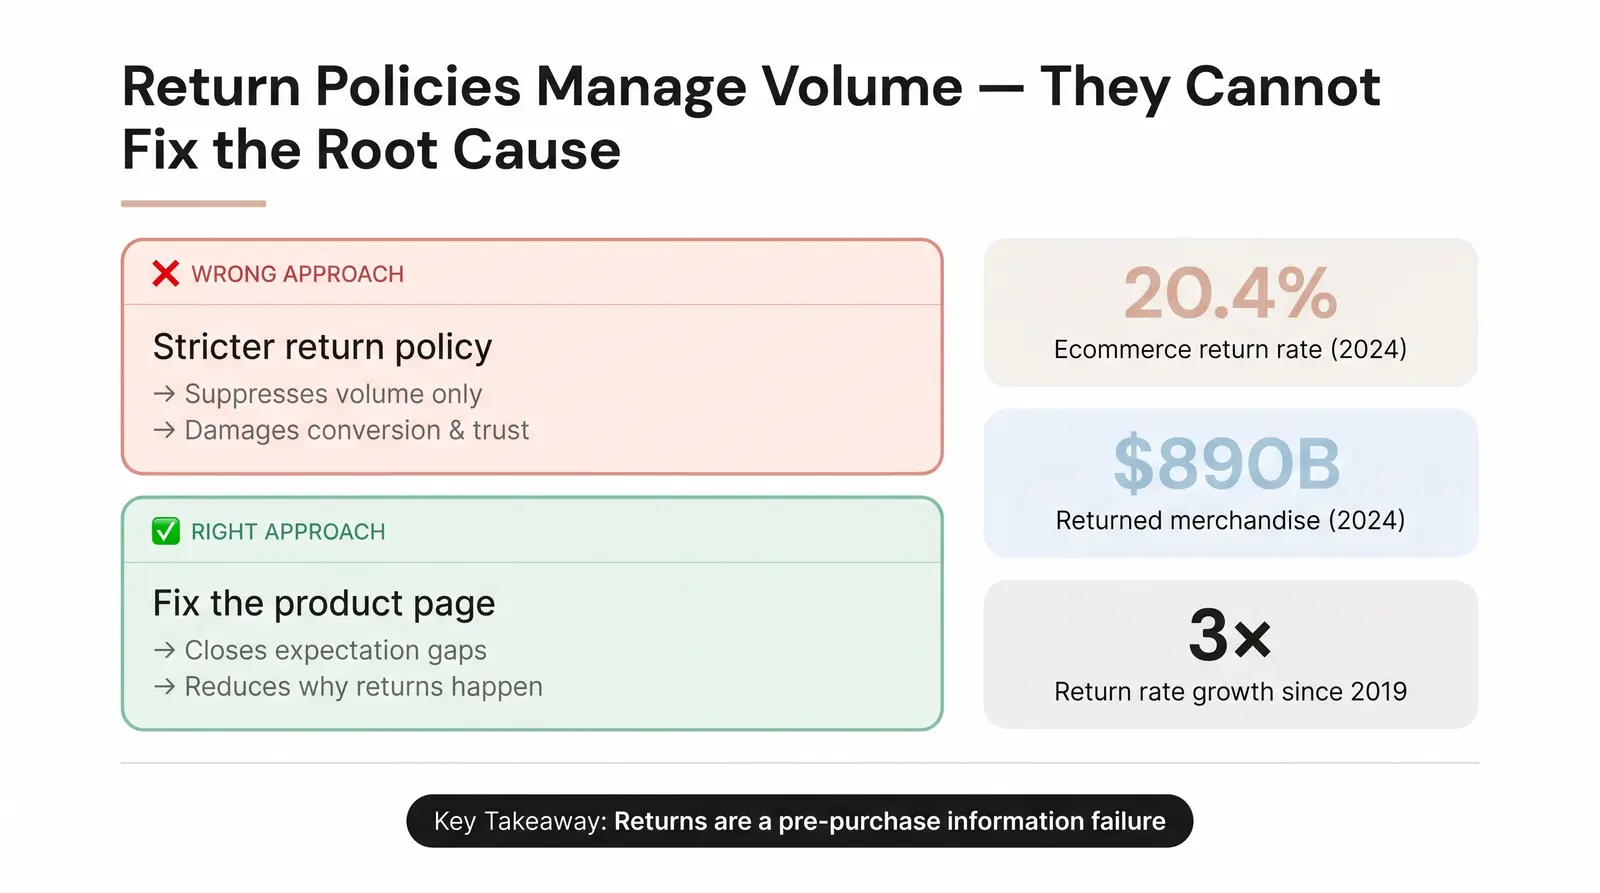
Return policies govern how returns are handled. They do not change why returns happen. A stricter return window or a return shipping fee might suppress a fraction of returns, but it does nothing to solve the underlying expectation gaps that cause customers to send products back in the first place. Worse, it often damages conversion and customer trust in the process.
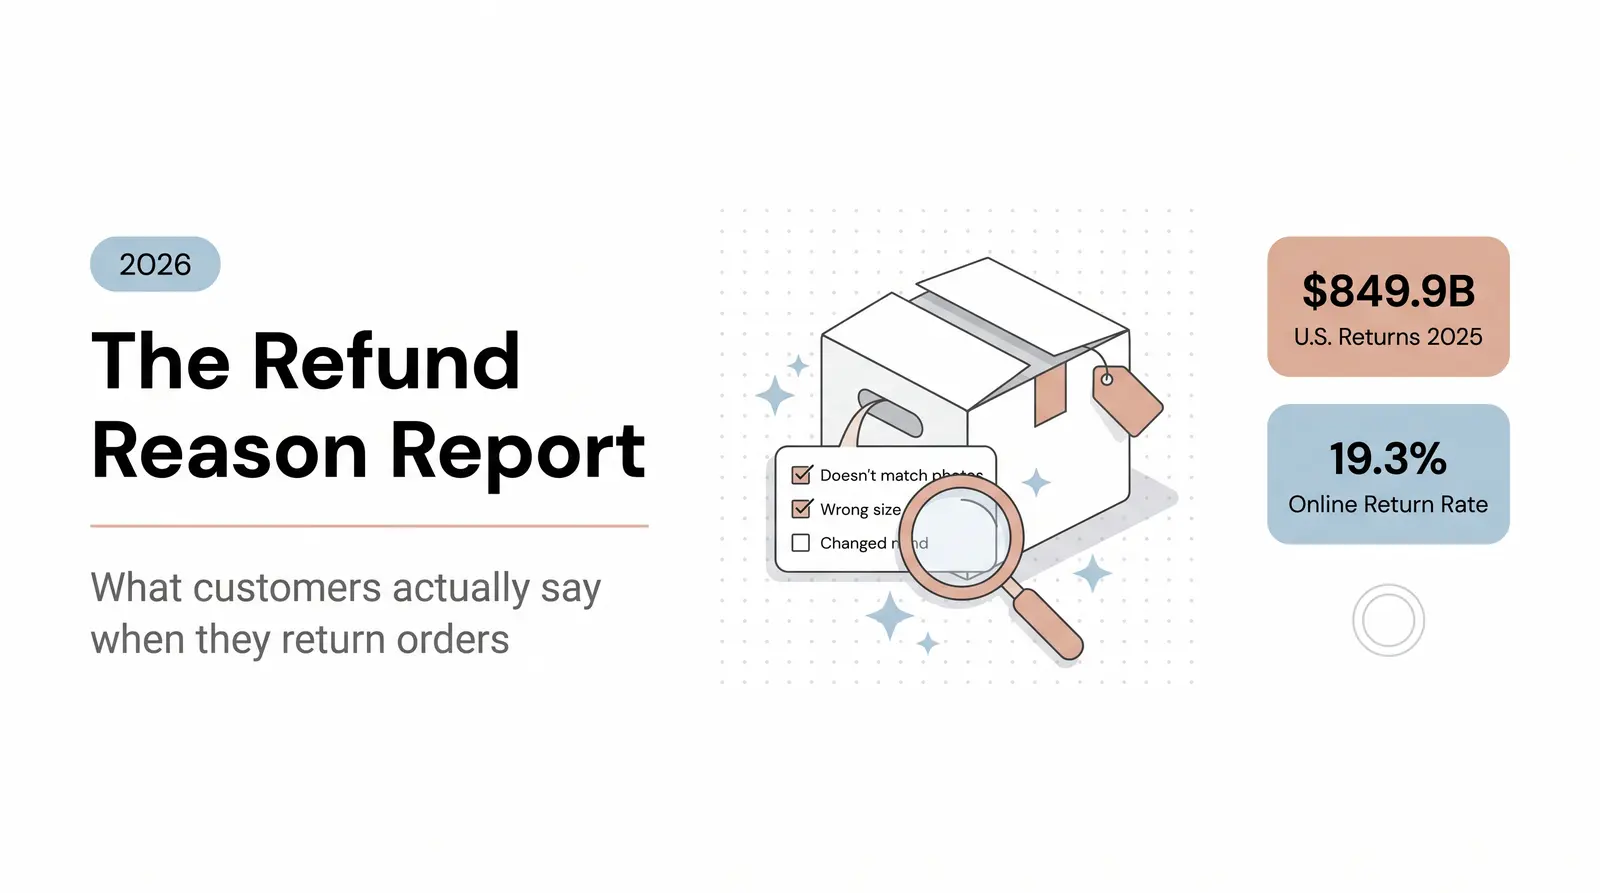
The numbers make the scale of this problem clear. The ecommerce return rate reached an estimated 20.4% in 2024, with total returned merchandise projected to hit $890 billion across the retail industry [1]. That figure has nearly tripled since 2019, when the average ecommerce return rate sat at just 8.1% [2]. But the overall average hides enormous variation by category. Apparel merchants routinely see rates of 25% to 40%. Accessories and jewelry fall into the 12% to 15% range. General ecommerce sits between 15% and 20% [2].
The core insight is this: returns are mostly a pre-purchase information failure, not a post-purchase behavior problem. Customers return items when the physical product fails to match the mental model they built from your product page. Fix the mental model, and you fix the return rate.
There is a contrarian point worth making here. Lowering friction in your return process can paradoxically increase conversion and reduce net return costs, but only if you have fixed the upstream levers first. When customers trust they can return easily, they buy with less hesitation. If your product presentation is highly accurate, they keep more of what they buy. The stores that get into trouble are the ones that offer easy returns without ever addressing why customers are returning.
In our experience at Branvas working with jewelry and accessories brands, the stores with the highest return rates almost always share one trait: their product pages were built for aesthetics, not accuracy.
The PREP-X Framework™ is the diagnostic and ranking system Branvas uses to help new brand operators launch with low return rates baked in from day one. Rather than waiting for returns data to accumulate and then reverse-engineering the problem, PREP-X gives operators a prioritized sequence of interventions based on where the highest-impact gaps typically exist.
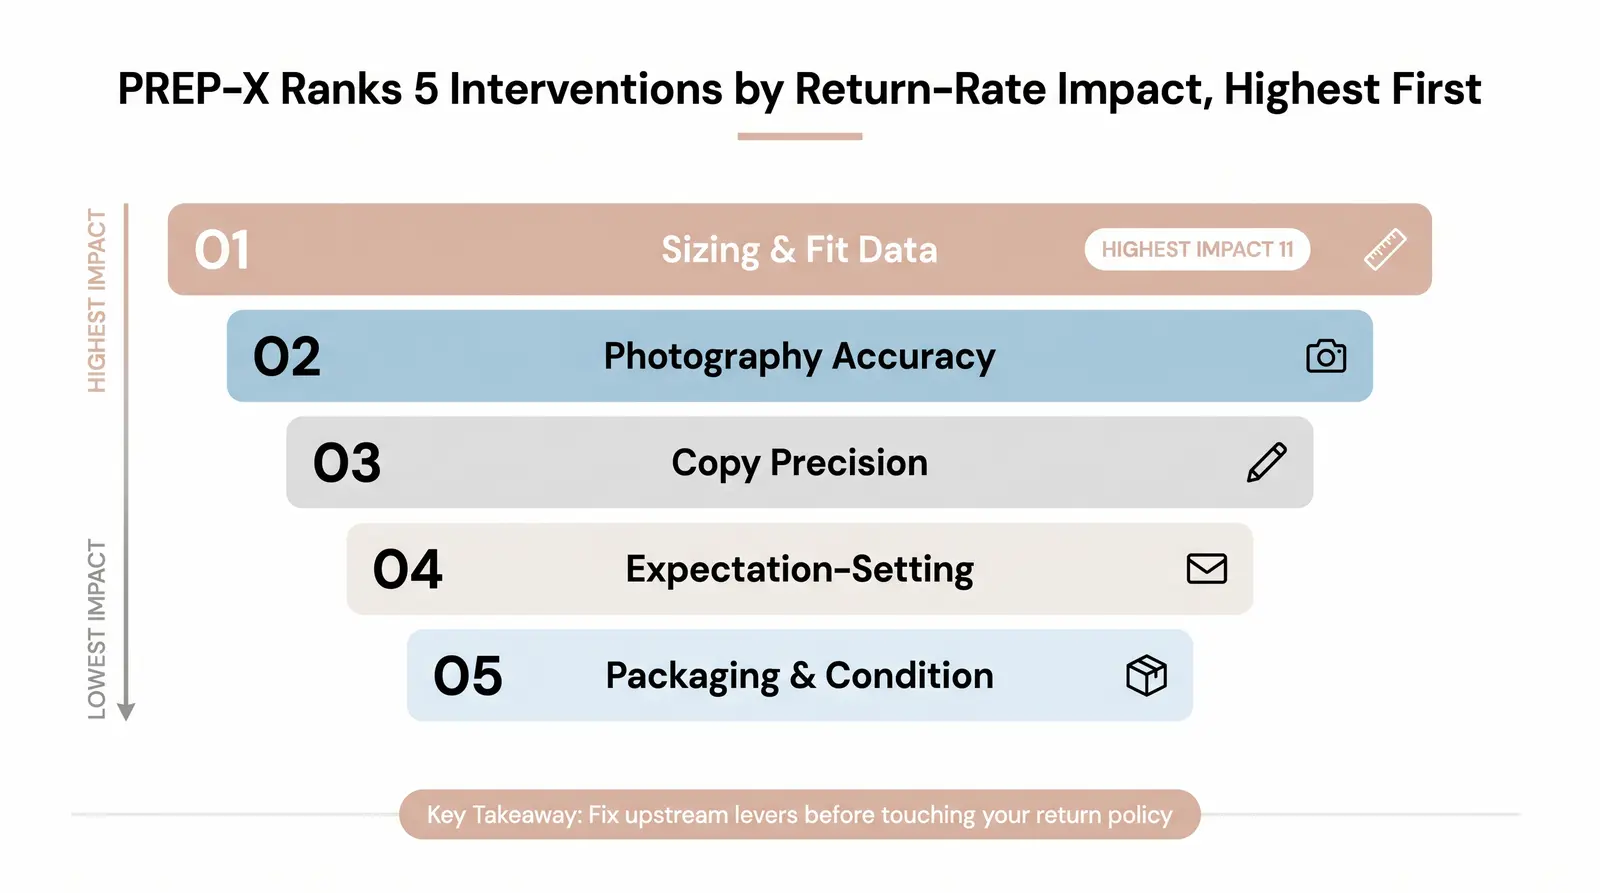
The framework identifies five levers ranked by their typical impact on return rate reduction, from highest to lowest. This ranking is based on typical patterns across apparel, accessories, and jewelry categories. Individual stores will vary based on their current gap, which is why the diagnostic flow later in this article matters.
| Lever | Root Cause Addressed | Typical Return Rate Impact | Hardest Part | Best For |
|---|---|---|---|---|
| Sizing & Fit Data | Fit mismatch | High (up to 30-50% reduction in size-related returns) | Collecting accurate data | Apparel, rings, bracelets |
| Photography Accuracy | Visual mismatch | High (significant reduction in "not as pictured" returns) | Studio investment | All categories |
| Copy Precision | Description mismatch | Moderate to High | Rewriting existing SKUs | Jewelry, home goods |
| Expectation-Setting | Buyer surprise | Moderate | Automation setup | All categories |
| Packaging & Condition | Damage/unboxing disappointment | Moderate (higher for fragile/luxury goods) | Supplier coordination | Jewelry, fragile goods |
Note: Impact figures represent directional estimates based on available industry research and Branvas operational experience. Individual results will vary based on category, current execution quality, and gap size.
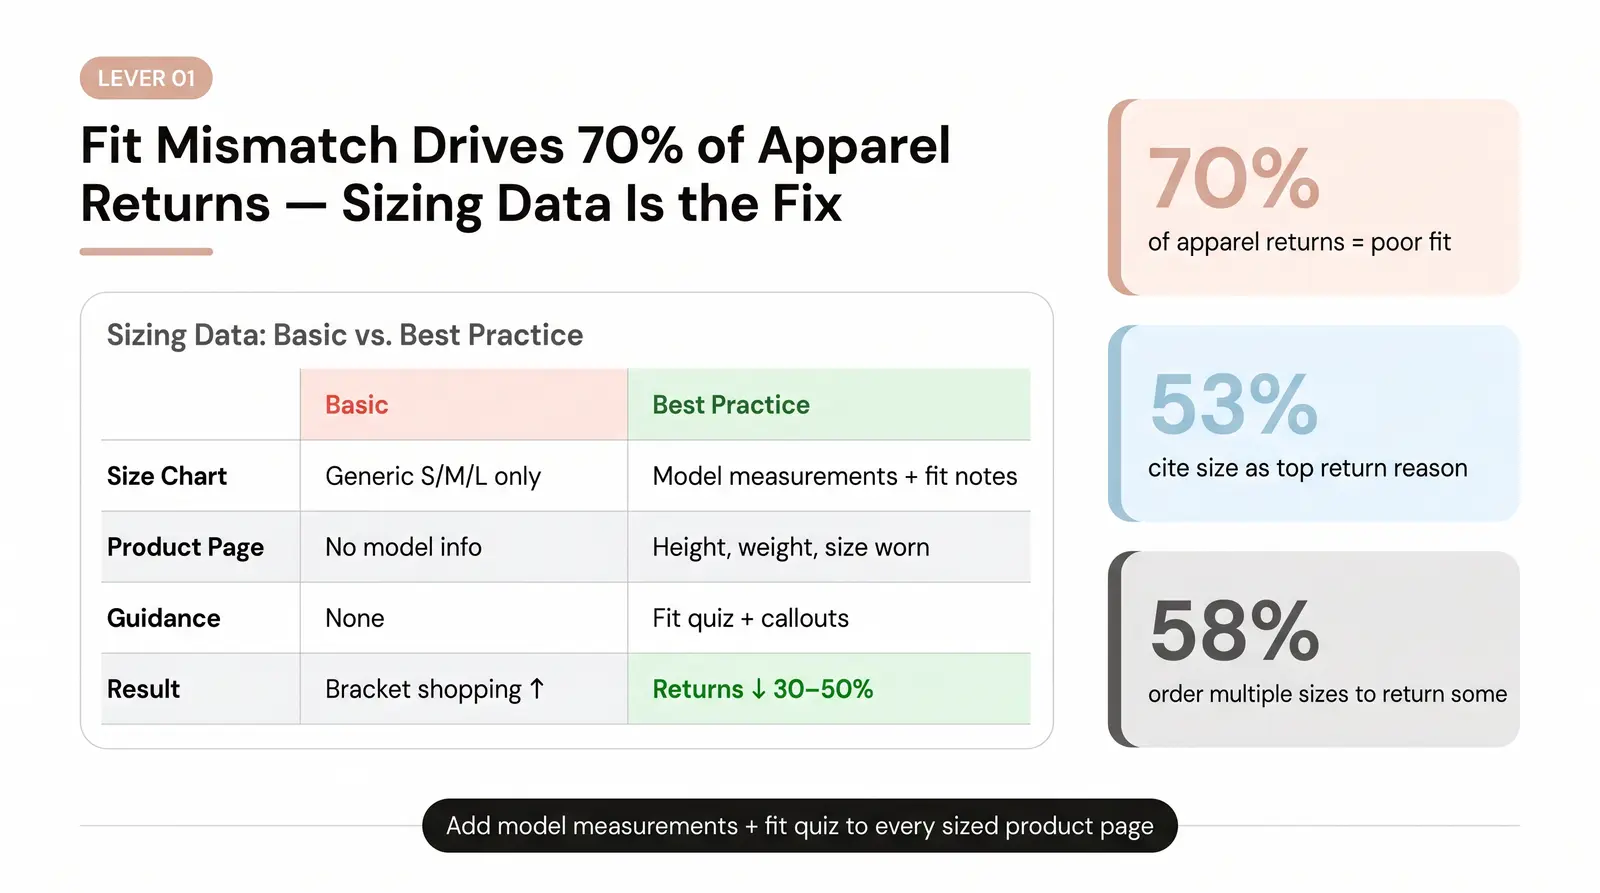
Fit mismatch is the undisputed number one driver of returns in apparel and sized accessories like rings, bracelets, and belts. According to McKinsey research, 70% of apparel returns are caused by poor fit or style [3]. Coresight Research found that size and fit is cited as the top return reason by 53% of online apparel shoppers [4]. Customers cannot try items on through a screen, so they guess. A significant percentage of them guess wrong.
This uncertainty also drives "bracket shopping," where customers deliberately order multiple sizes intending to return the ones that don't fit. Roughly 58% of U.S. consumers say they order multiple items in different sizes or colors with the explicit intent to return some [2]. For apparel stores, bracket shopping alone can inflate return volumes by 20% to 30% beyond what the return rate data suggests.
Sizing data means far more than a static size chart. It includes fit model measurements listed on the product page, customer-submitted fit feedback loops, size recommendation tools like fit quizzes, and real measurement callouts written directly into product descriptions. The difference between "Model is wearing size S" and "Model is 5'7", 130 lbs, wearing size S. She found this runs slightly long in the torso" is significant. The second version gives the customer a reference point they can actually use.
Consider a Shopify apparel store that relies solely on a generic S/M/L chart with no model measurements and no fit guidance. By adding a fit quiz and model measurement callouts to every product page, the store bridges the imagination gap. Customers gain sizing confidence, bracket shopping drops, and size-related returns fall meaningfully. The investment is primarily in content, not technology.
This lever is equally critical for jewelry. Ring sizing guides with clear instructions on how to measure at home, precise bracelet length callouts with wrist measurement guidance, and photos showing a necklace's exact drop length on a model's neck are all essential for preventing fit-related jewelry returns. A ring that arrives in the wrong size is a near-certain return. A ring listing that includes a sizing guide and a "how to measure your ring size" insert reduces that risk substantially.
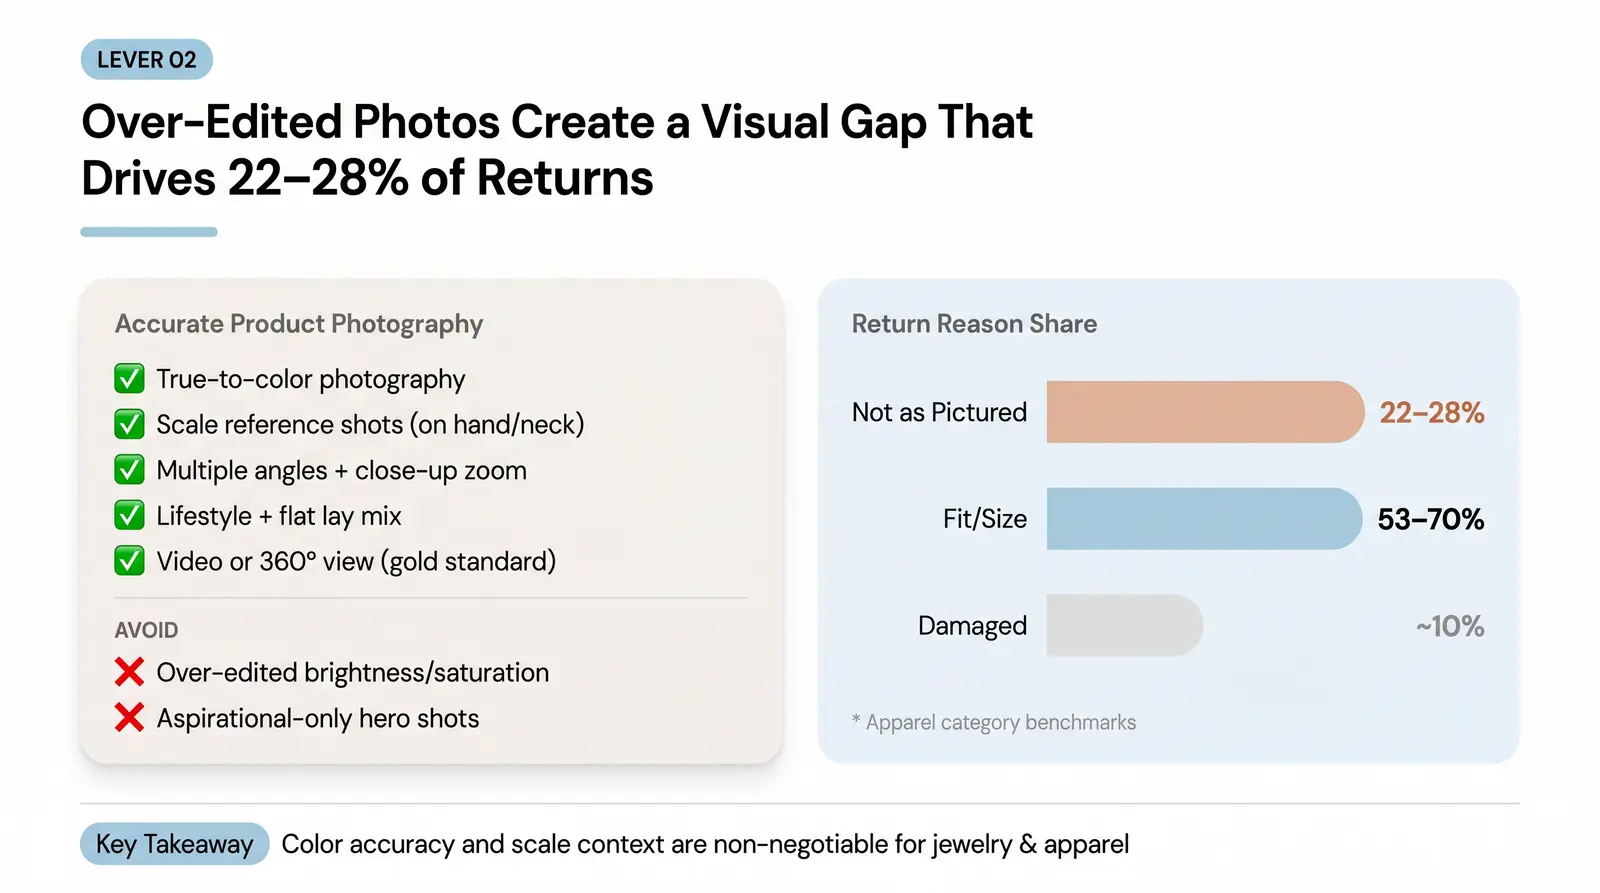
There is a gap between aspirational brand photography and accurate product photography. Aspirational photography is designed to make a product look its best. Accurate photography is designed to make a product look exactly as it will appear in the customer's hands, under normal lighting, in a real environment. When those two things diverge, you get "not as pictured" returns.
Misleading product pages are a leading cause of returns. Research from 2026 indicates that misleading product pages account for approximately 22% to 28% of all return reasons, with AI-generated product descriptions and over-edited imagery flagged as growing contributors [5]. The customer who orders a gold necklace based on a bright, studio-lit hero image and receives a piece that looks noticeably darker under natural light has a legitimate grievance. The product did not match the expectation the page created.
Closing this gap requires a specific set of photography practices. True-to-color photography is non-negotiable. Scale reference shots (the product on a hand, on a neck, or next to a recognizable object) are essential for any item where size matters. Multiple angles and close-up zoom shots for texture give customers the ability to inspect the product virtually. A mix of lifestyle and flat lay imagery shows both the product in context and its exact physical form. Video or 360-degree views are the gold standard where budget allows.
Over-editing product photos, specifically adjusting brightness, saturation, and contrast beyond what the physical product actually looks like, is one of the most common hidden return drivers. Many brands don't realize their edited hero image looks meaningfully different from the physical product under normal lighting.
We often see new jewelry brand founders submit beautifully edited product photos that, under natural light, look 20-30% brighter than the physical piece. That gap costs them returns. Color accuracy and realistic lighting are non-negotiable, especially for jewelry metal tones and apparel colors.
For jewelry specifically, the stakes are high. Metal tone accuracy (the difference between yellow gold, gold-filled, gold-plated, and gold-toned) is a major source of "not as pictured" returns. Stone size shown in context on a hand, rather than isolated on a white background, prevents the "it looked bigger online" complaint. For apparel, color accuracy under natural light is the primary concern, since screen calibration varies and even a minor color shift can feel like a different product in person.
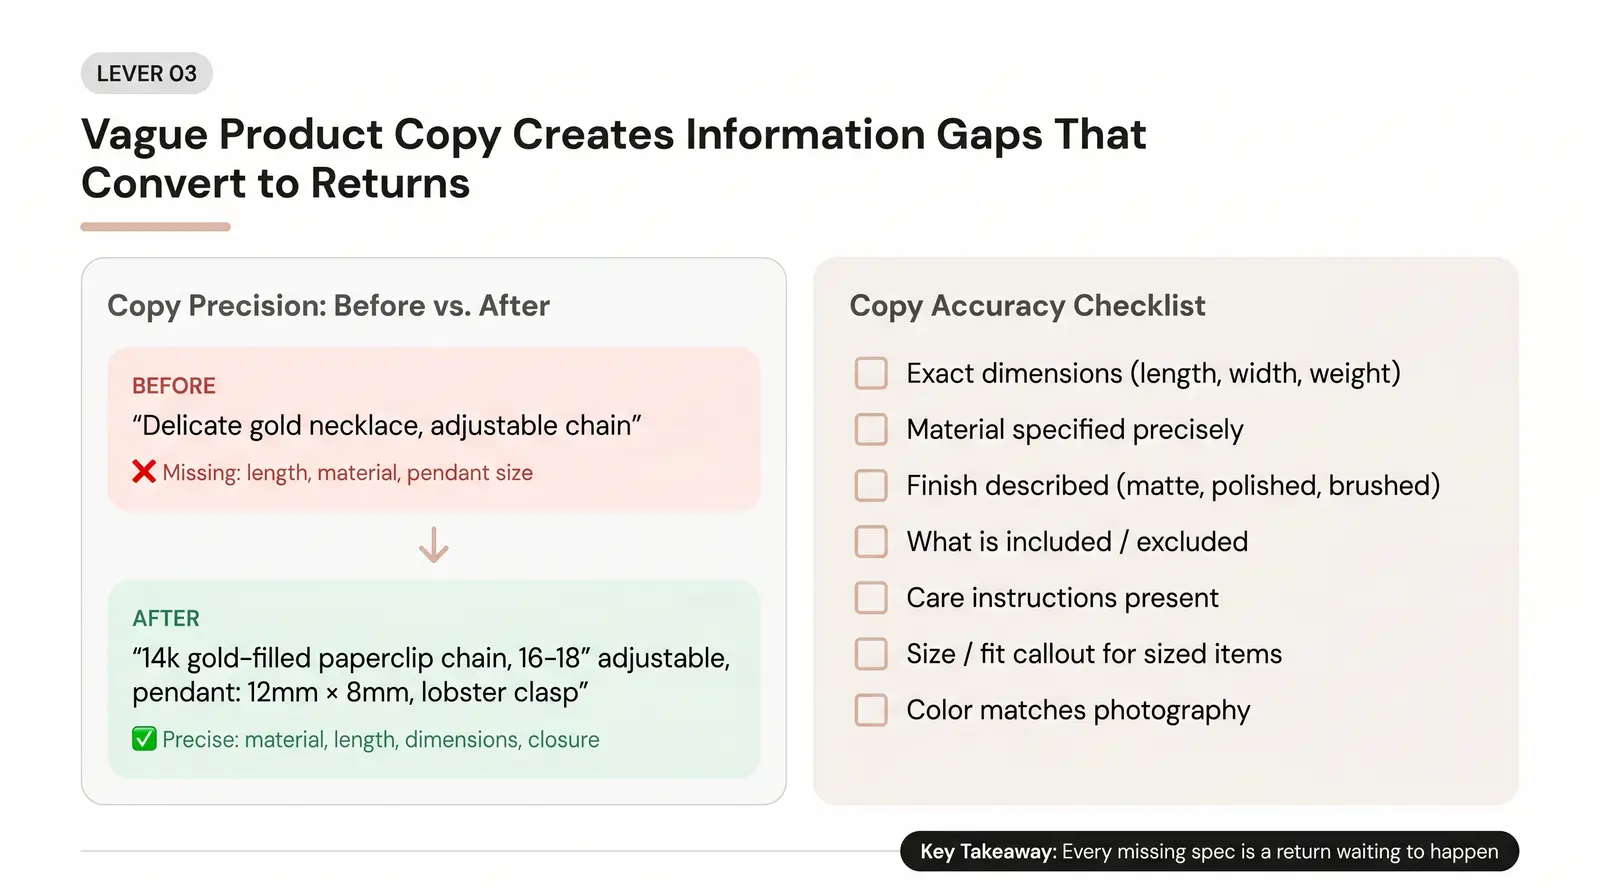
Product copy is the final checkpoint before a customer commits to a purchase. It must precisely state dimensions, materials, weight, finish, care requirements, and what is included in the box. Missing or vague details create information gaps that customers fill with assumptions. When the product arrives and the assumptions turn out to be wrong, you get a return.
Common copy failure modes are easy to spot once you know what to look for. Vague descriptors like "gold-toned," "lightweight," or "adjustable" tell the customer almost nothing useful. "Gold-toned" could mean gold-plated, gold-filled, or simply gold-colored. "Adjustable" could mean 2 inches of adjustment or 6. "Lightweight" is subjective. Missing dimensions are another frequent problem. A customer who cannot visualize the actual size of a pendant or a bracelet is making a purchase based on incomplete information. According to Baymard Institute research, 10% of the largest e-commerce sites fail to provide a consistently high level of detail in their product descriptions [6].
Every product page should pass this Copy Accuracy Checklist before going live:
The before-and-after difference is stark. A jewelry SKU described vaguely as a "delicate gold necklace, adjustable chain" invites assumptions about length, material, and pendant size. After a copy precision pass, it becomes: "14k gold-filled paperclip chain necklace, 16-18 inch adjustable length, pendant: 12mm x 8mm, lobster clasp closure." The accurate version eliminates the guesswork that leads to returns. It also tends to improve conversion, because customers who have all the information they need to make a confident decision are more likely to buy.
For home goods, the copy precision lever often centers on dimensions. A customer who orders a side table without knowing its exact height and surface area is guessing whether it will fit their space. For apparel, material composition and care requirements are the most commonly missing details. For jewelry, material specification is the single most important copy element, as it directly affects perceived value and return likelihood.
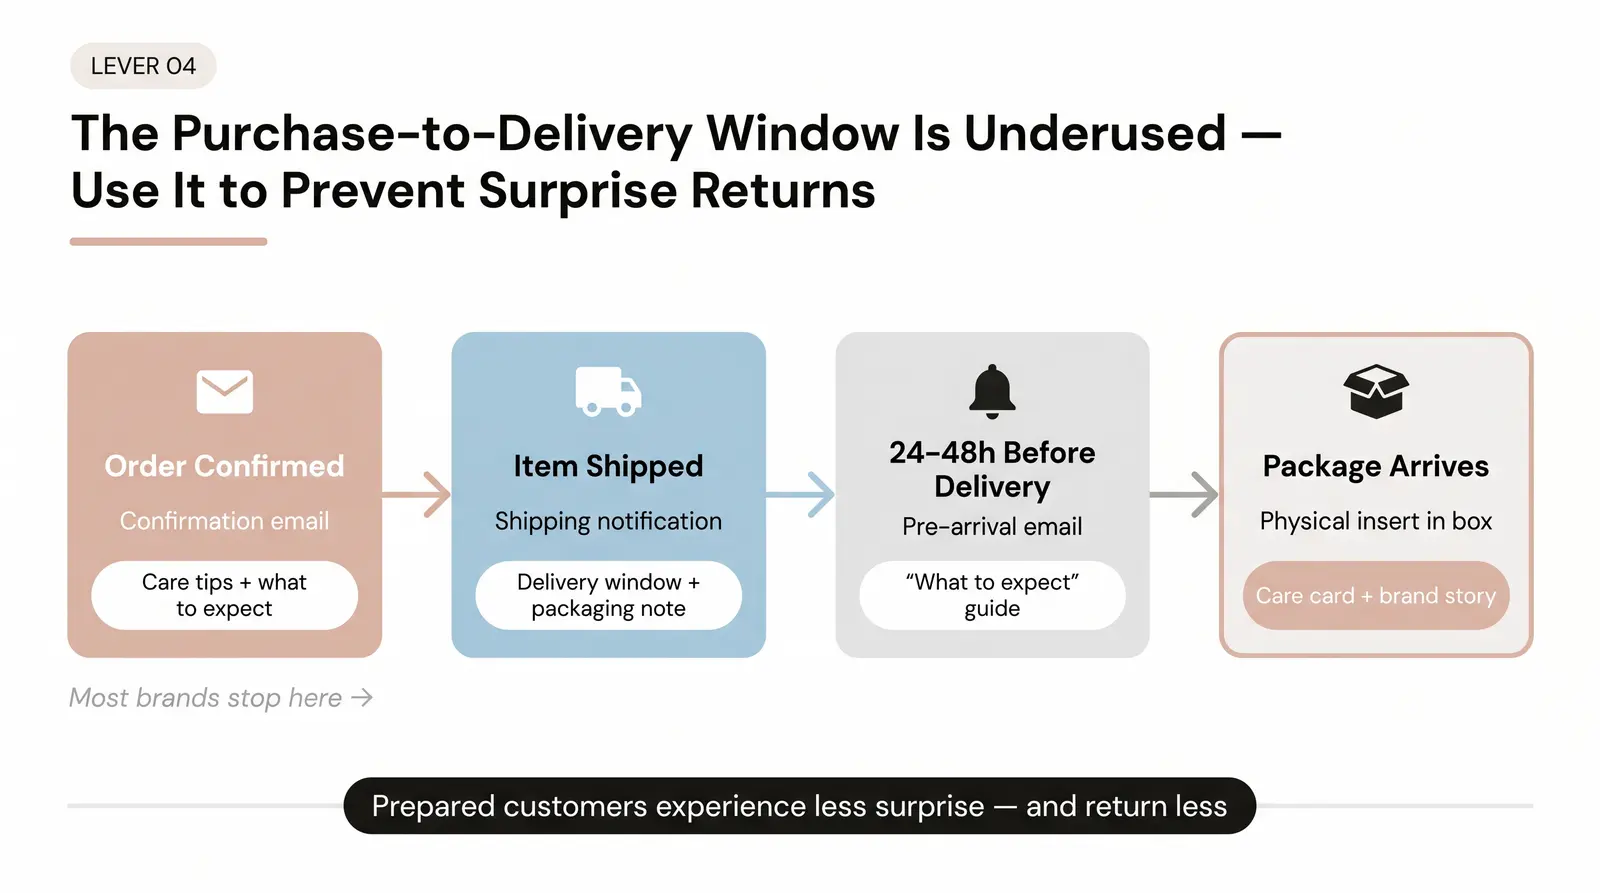
Expectation-setting happens in the confirmation email, the shipping notification, and any pre-arrival communication. This lever does not change the physical product. It prepares the customer to receive it correctly, reducing the post-purchase dissonance that drives "changed mind" and "not what I expected" returns.
The window between purchase and delivery is underused by most ecommerce brands. Customers who have just ordered are highly engaged and receptive to information. A confirmation email that simply confirms the order is a missed opportunity. A confirmation email that includes care tips for the product, a note about what the packaging will look like, a styling suggestion, or a "how to check fit" guide does something more valuable: it aligns the customer's expectations with the reality of what they are about to receive.
Effective expectation-setting tactics include a "what to expect" email sent 24 to 48 hours before delivery, a shipping notification that includes a delivery window and a note about the packaging, and a physical insert in the box that reinforces care instructions and brand story. For jewelry, a "how to care for your piece" card and a note about normal metal aging can preempt returns driven by tarnishing or minor color variation that customers mistake for a defect.
At Branvas, brands we work with include custom-printed inserts in every package, a small touch that dramatically changes how customers feel when they open the box. See how Branvas handles packaging and fulfillment.
The behavioral research supports this approach. Customers who feel prepared for what they are receiving are less likely to experience the surprise and disappointment that triggers a return. Managing the anticipation phase of the purchase journey is a low-cost, high-leverage intervention that most stores overlook entirely because it happens after the sale.
Packaging-related returns (damaged goods, items loose in a poly mailer, products that arrive in poor condition) represent a fulfillment failure rather than a content failure. The product page was accurate. The product itself is fine. But the customer received something that looked damaged or carelessly packed, and they returned it.
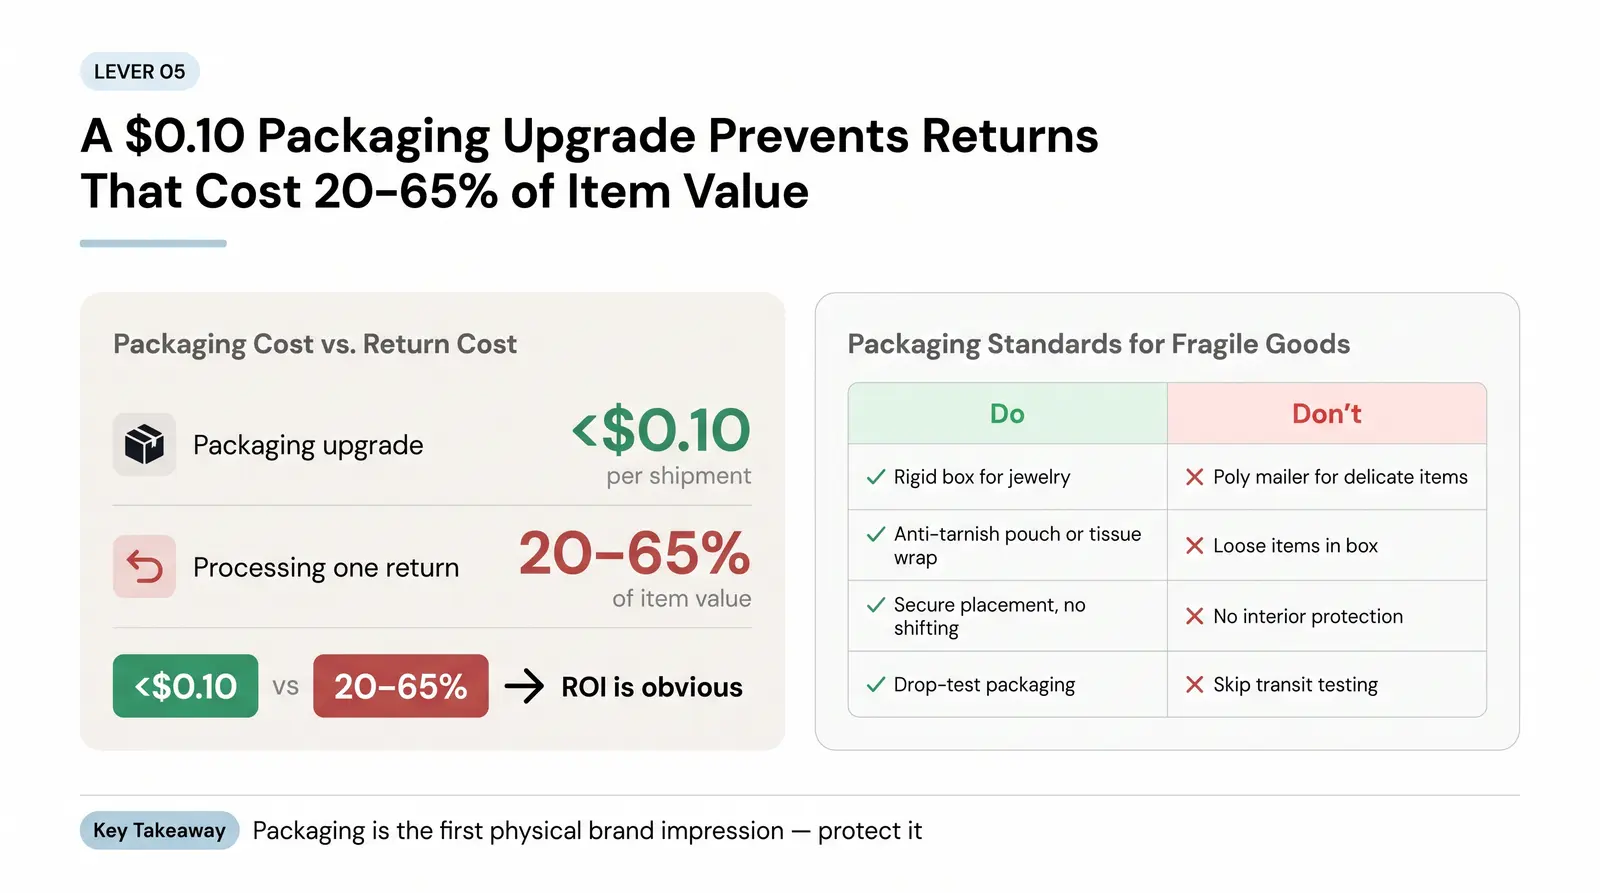
While this lever ranks fifth overall, it is disproportionately important for fragile categories. Jewelry, accessories, and home goods are particularly vulnerable. A delicate chain that arrives tangled or kinked because it was shipped loose in a poly mailer is a return. A pendant that arrives scratched because it was not protected in transit is a return. A pair of earrings that arrives with a bent post is a return. These are not product quality failures. They are packaging failures.
The fix is category-appropriate packaging. Rigid boxes instead of poly mailers for jewelry. Anti-tarnish pouches or tissue wrap to protect metal surfaces. Secure placement so items do not shift during shipping. Drop testing to verify that the packaging survives normal transit conditions. These are not expensive interventions. A premium packaging upgrade often adds less than $0.10 per shipment [7], while the cost of processing a single return can range from 20% to 65% of the item's original value [1].
In our experience at Branvas, packaging is not just a protection layer. It is the first physical brand impression. A damaged or carelessly packaged order does not just trigger a return. It kills repeat purchase intent. The customer who opens a beautiful, well-protected package has a fundamentally different emotional experience than the customer who opens a crumpled poly mailer. That difference shows up in return rates, repeat purchase rates, and brand reviews. Explore Branvas's packaging and branding options.
The framework only works if you apply it to your specific situation. Here is the five-step diagnostic process for identifying which lever to pull first.
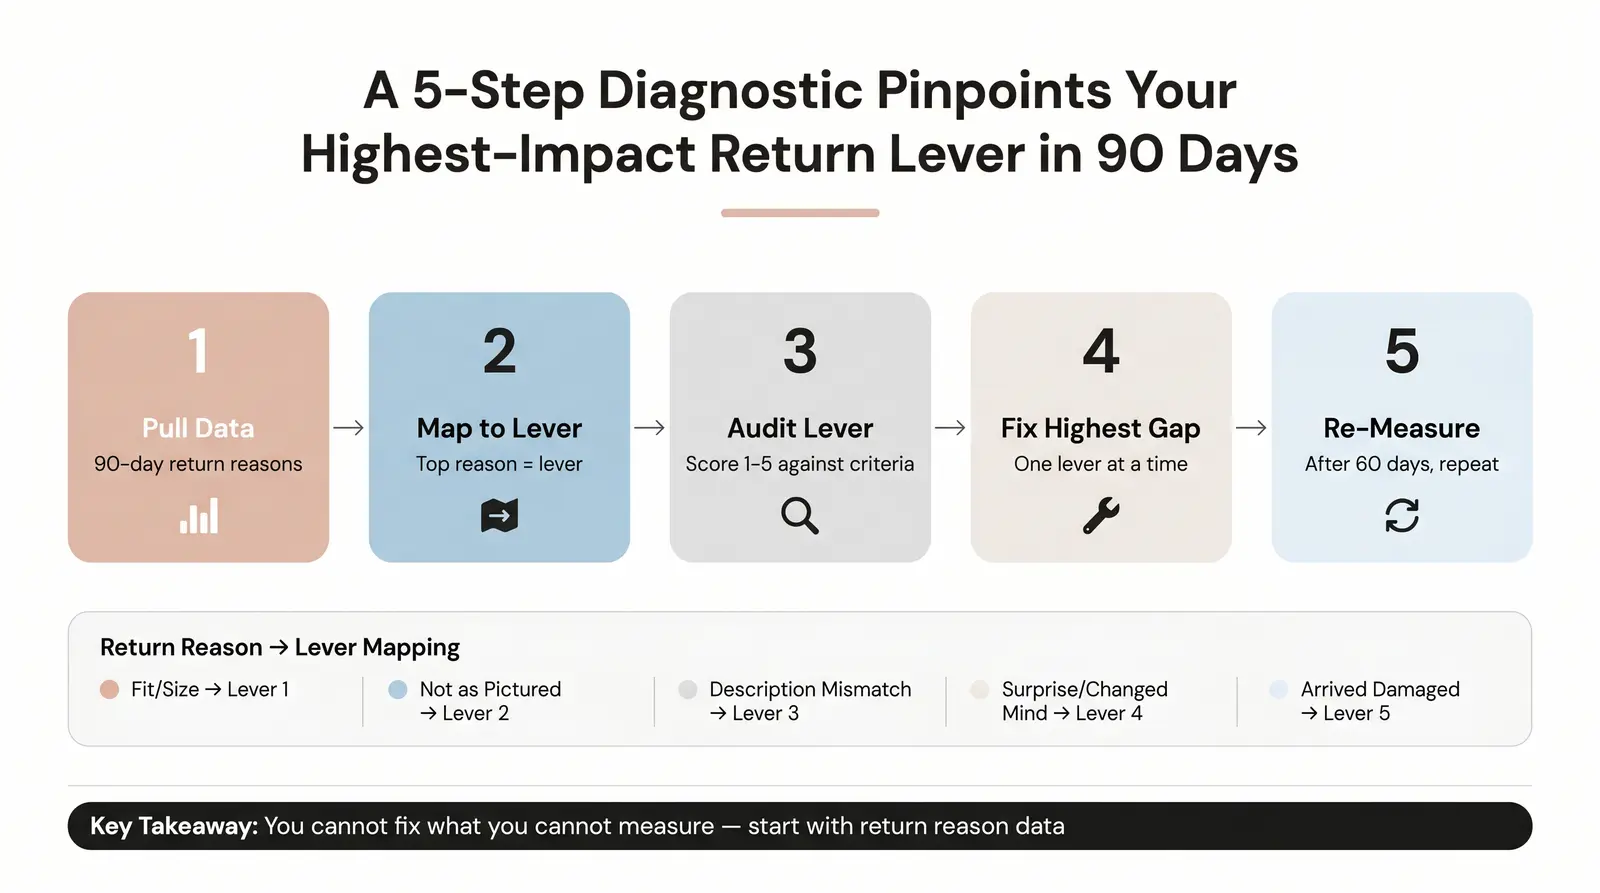
Step 1: Pull your return reason data for the last 90 days. Categorize every return into one of five buckets: Fit/Size | Not as Pictured | Description Mismatch | Arrived Damaged | Changed Mind/Other. If your return management system does not currently capture this data, set it up now. You cannot fix what you cannot measure.
Step 2: Identify your top return reason category. That category maps directly to a lever:
Step 3: Audit your current execution of that lever against the relevant criteria in this article. For copy precision, use the Copy Accuracy Checklist above. For photography, audit against the accuracy criteria in Lever 2. Score your current execution on a 1-to-5 scale. A score of 3 or below means this lever has a significant gap.
Step 4: Fix the highest-gap lever first before moving to the next. Each lever is independent. Fixing Lever 3 will not fix a Lever 1 problem. A customer who is returning because the product does not fit will not be retained by better copy. They need better sizing data.
Step 5: Re-measure your return reason distribution after 60 days. If the top return reason has shifted, you have made progress on that lever. Move to the next highest-volume reason and repeat the process.
Category-specific starting points are worth noting. An apparel brand will almost always start with Lever 1 (sizing) or Lever 2 (photography). A jewelry or accessories brand will most often start with Lever 2 (photography accuracy for metal tone and scale) or Lever 3 (copy precision for material callouts). A home goods store will typically focus on Lever 3 (exact dimensions) or Lever 2 (color accuracy in natural light).
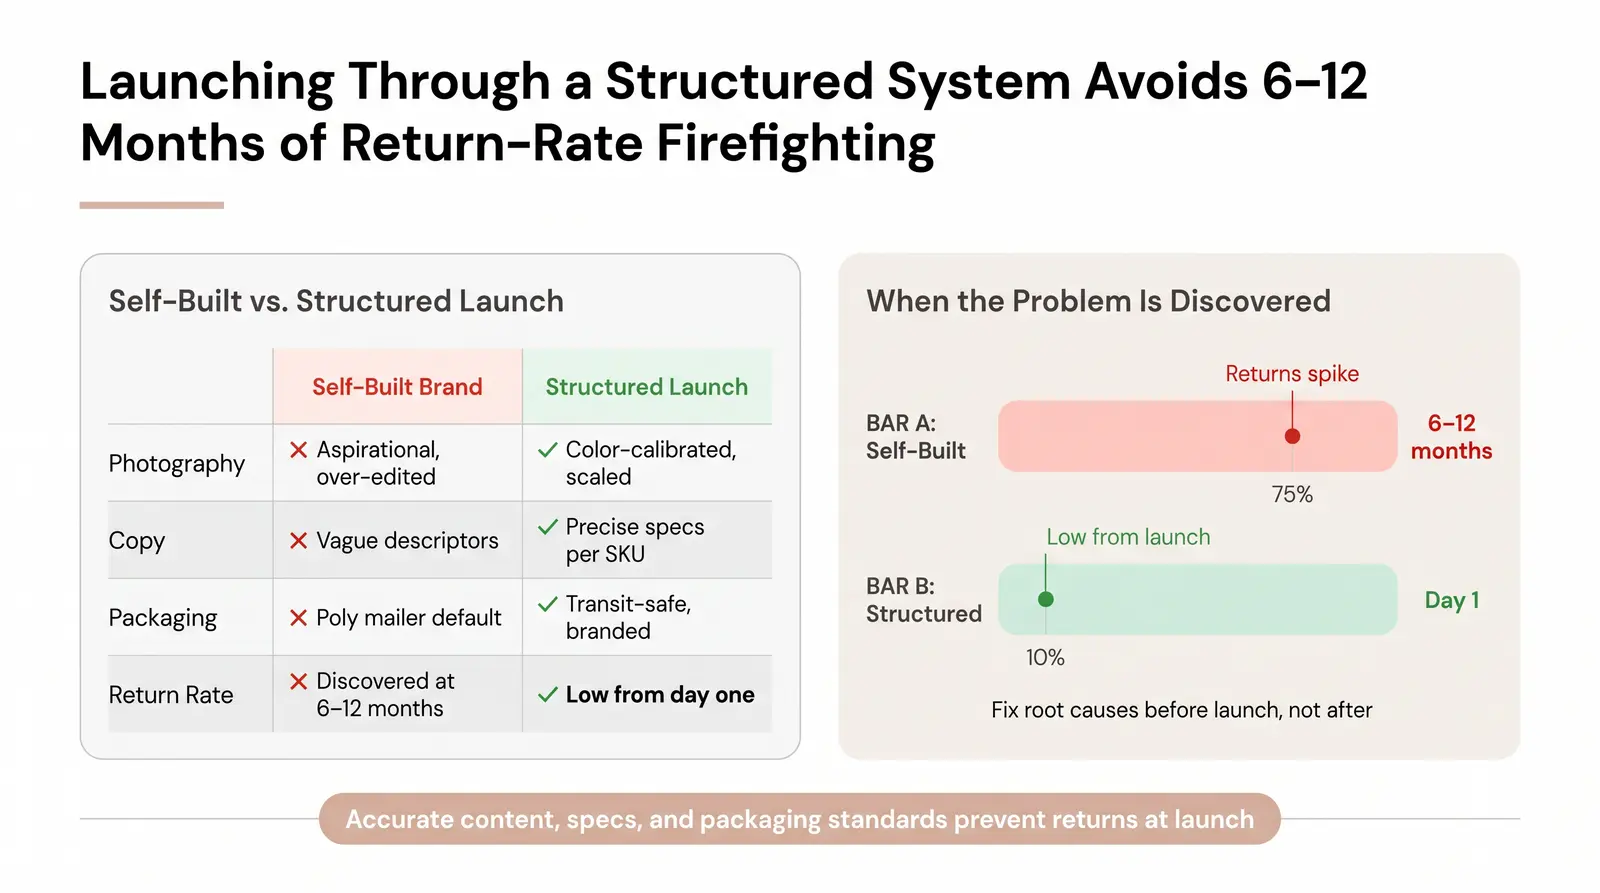
One reason new jewelry and accessories brands on Branvas tend to have lower return rates than self-built competitors is that the PREP-X framework is baked into the launch process. Branvas provides accurate product photography that is calibrated for color and scale, precise material specifications for every SKU, packaging designed for transit safety, and fulfillment designed for consistency at scale.
Most self-built brands accumulate a return rate problem over their first six to twelve months and then spend significant time and money diagnosing and fixing it. The root causes (inaccurate photography, vague copy, inadequate packaging) are usually visible in hindsight but were never addressed at launch because the founder was focused on aesthetics and speed to market.
Founders who launch through Branvas do not have to reverse-engineer their product pages after accumulating returns data. The accurate content, specs, and packaging standards are part of what they get at launch. The PREP-X framework is not an afterthought. It is the operating standard.
If you are launching a jewelry or accessories brand and want to avoid building a high-return-rate store from scratch, see how Branvas works. Or explore our profit calculator to model margins with a realistic return assumption built in.
A "good" return rate depends entirely on your product category. Apparel stores often see normal return rates between 25% and 40% due to sizing challenges. A 30% rate in apparel is not necessarily a problem. For jewelry and accessories, a healthy return rate typically falls between 12% and 15%. For general ecommerce, 15% to 20% is the broad benchmark. The more useful question is whether your return rate is higher than the category average, and if so, which return reason is driving the gap.
Fit and sizing issues are the most common reason for returns in apparel and footwear, cited by 53% to 70% of shoppers depending on the study [3] [4]. Beyond sizing, the leading causes are products not matching their online photos or descriptions, and items arriving damaged. For jewelry and accessories, visual mismatch (the product looking different in person than it did in the product photos) is the dominant return driver.
Focus on pre-purchase information quality rather than post-purchase policy restrictions. Improve your product photography to show accurate colors and scale. Add detailed sizing data, fit model measurements, and fit quizzes where relevant. Ensure your product copy precisely lists materials, dimensions, and finish. These upstream interventions address the root causes of returns rather than just managing the volume of returns that occur.
Yes, and the mechanism is straightforward. High-quality, accurate photography reduces "not as pictured" returns by setting correct visual expectations before purchase. Showing multiple angles, scale references, and true-to-life colors under natural lighting prevents the disappointment that triggers a return. The key word is "accurate." Photography that is over-edited or aspirational rather than realistic can actually increase return rates by creating an expectation the physical product cannot meet.
The most direct method is to require customers to select a return reason when initiating a return through your return management system. Common categories to include are: does not fit, not as pictured, description was inaccurate, arrived damaged, and changed my mind. Review this data every 90 days to identify the dominant return reason. That reason maps directly to a PREP-X lever, which tells you exactly where to focus your improvement effort first.