Analyzing top ecommerce refund reasons reveals most returns stem from fixable product page gaps, not logistics failures, giving operators clear interventions to reduce return rates and protect margins.
Published:
May 4, 2026
Author:
Yi Cui
We analyzed refund forms across multiple ecommerce stores. The top three reasons aren't what category benchmarks suggest — and one of them is fixable directly on your product detail page (PDP).
The ecommerce returns landscape is staggering. In 2025, U.S. retail returns totaled $849.9 billion, with an estimated 19.3% of all online sales being returned [1]. For ecommerce operators, the financial impact is severe. The average ecommerce return rate sits between 19% and 20.5%, and processing a single return costs between $10 and $65 [2]. Reverse logistics alone can consume 20% to 30% of the original product value, and only 48% of returned items are resold at full price [2]. A 25% return rate can reduce a brand's contribution margin by up to 70% [2].
Most merchants treat returns as a logistics problem. The data suggests it is predominantly a pre-purchase information problem — meaning the refund is decided at the point of product discovery, not at the point of delivery. While operators obsess over reverse logistics software and carrier rates, the root cause of the return often lives on the product page. In fact, 22% of returns happen simply because the product looks different in real life than it did online [3].
In our experience at Branvas working with new ecommerce brand owners, the stores with the highest return rates aren't the ones with bad products — they're the ones with underdeveloped product pages.

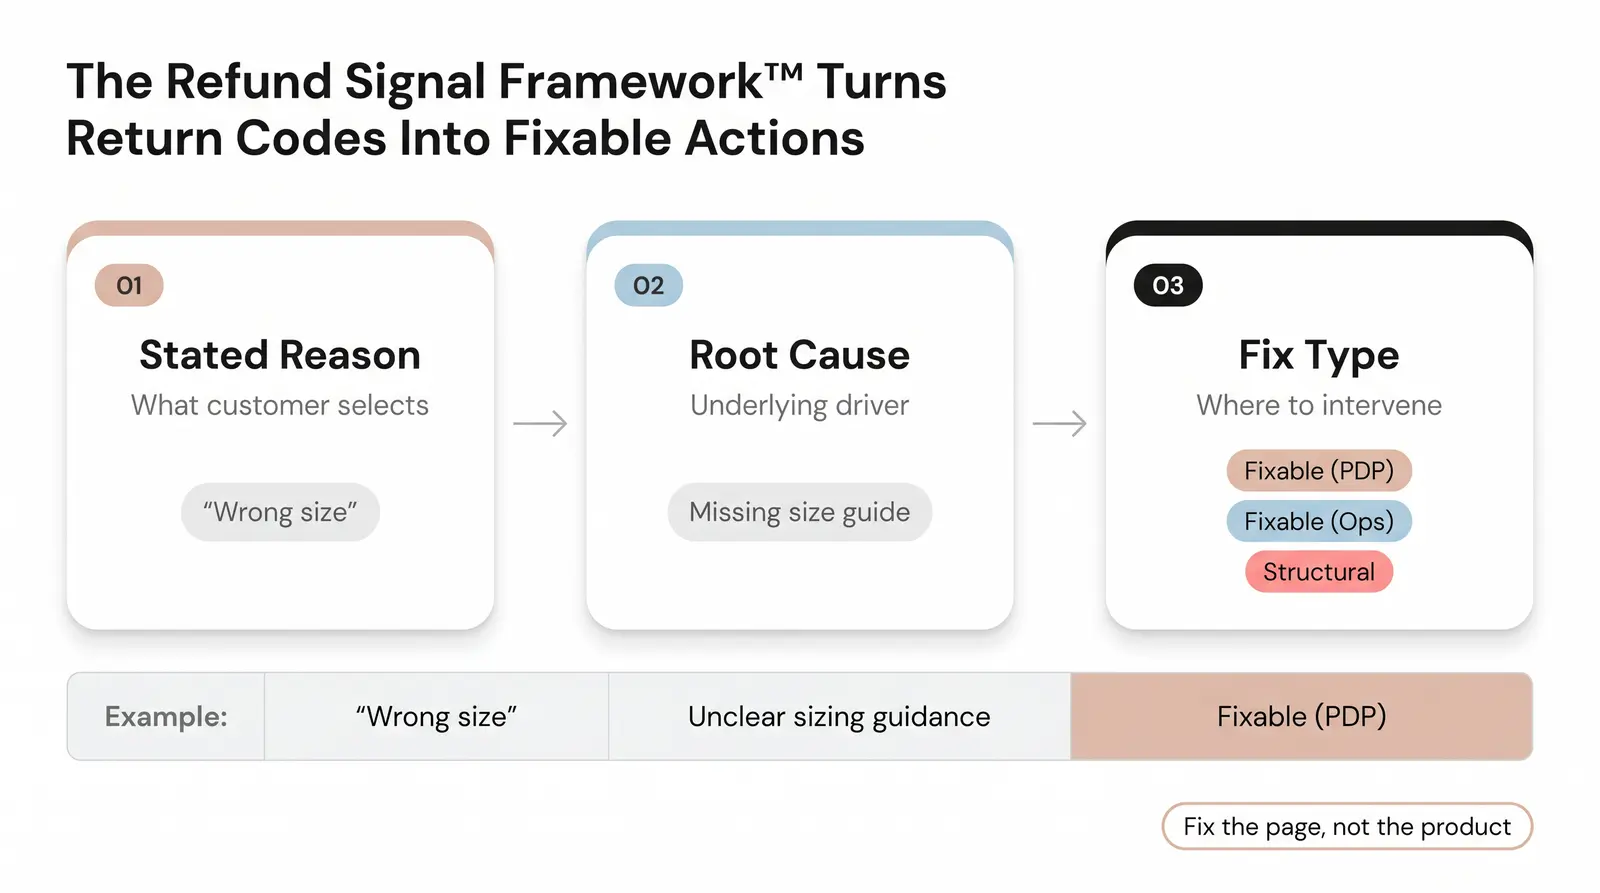
To understand what drives returns, we developed The Refund Signal Framework™. This proprietary model categorizes return reason data into actionable signals, moving beyond generic return codes to identify exactly what operators can fix. The framework consists of three layers:
We applied this framework to refund-form data and industry benchmarks across thousands of ecommerce stores. By analyzing stated reasons against product page content and operational workflows, we identified which returns are preventable and where merchants should focus their optimization efforts.
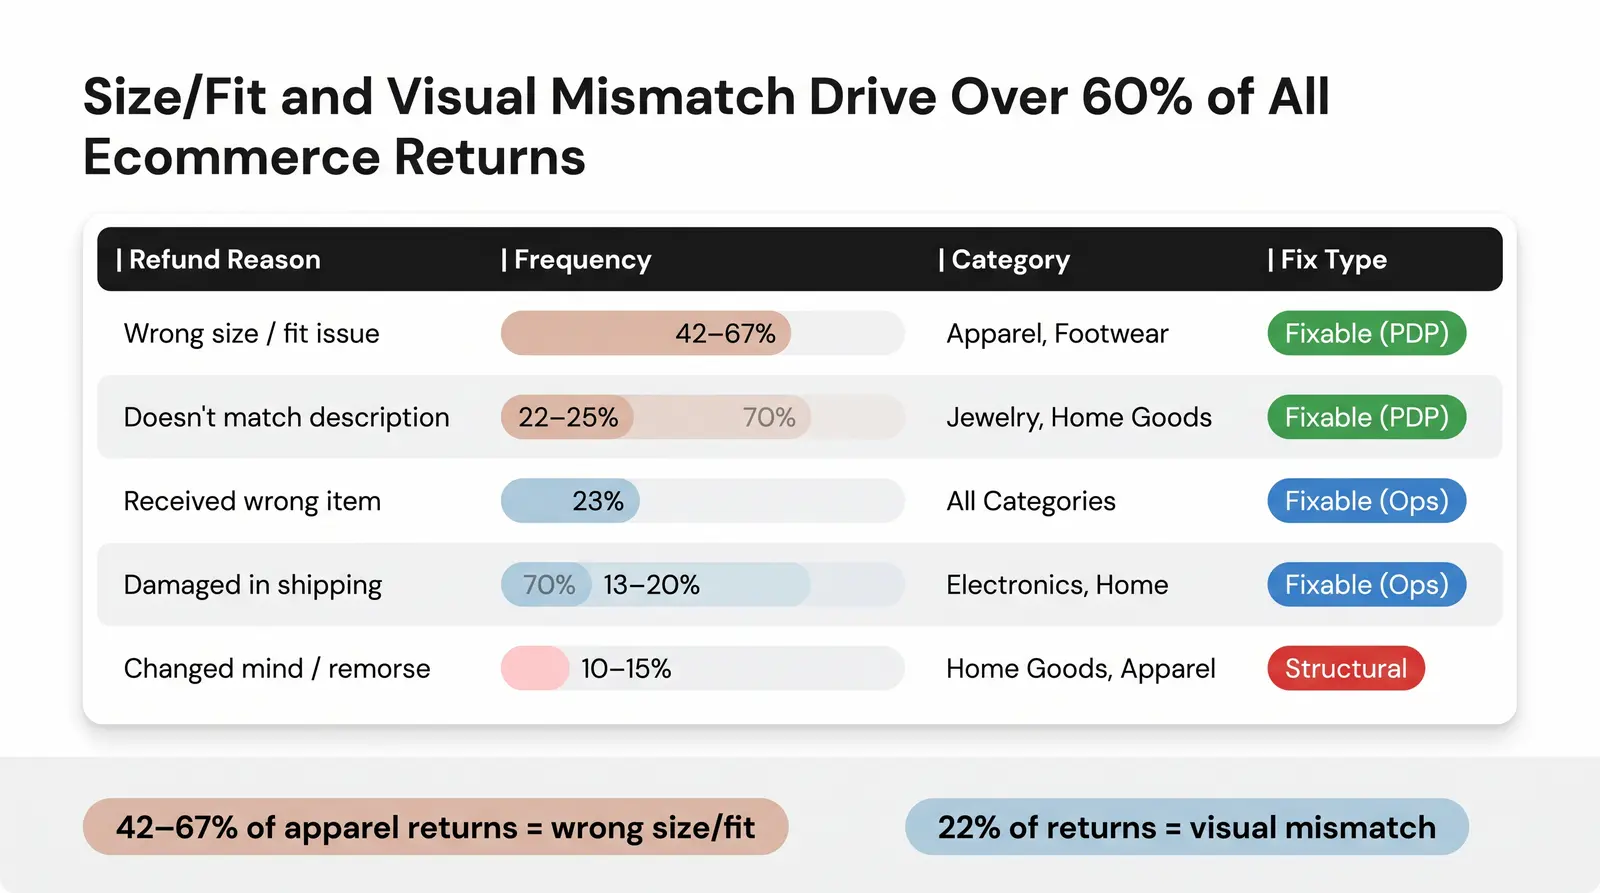
When customers initiate a return, they are telling you exactly where your pre-purchase experience failed. The table below breaks down the most common refund reasons, their estimated frequency, and how they map to the Refund Signal Framework™.
| Refund Reason | Frequency (est. %) | Categories Where It Peaks | Root Cause (via Framework) | Fix Type |
|---|---|---|---|---|
| Wrong size / fit issue | 42% - 67% | Apparel, Footwear, Intimates | Unclear sizing guidance or vanity sizing | Fixable (PDP) |
| Doesn't match description / photos | 22% - 25% | Jewelry, Home Goods, Beauty | Inaccurate color, scale, or texture representation | Fixable (PDP) |
| Received the wrong item | 23% | All Categories | Fulfillment error or SKU mismatch | Fixable (Ops) |
| Damaged in shipping | 13% - 20% | Electronics, Home Goods, Beauty | Poor packaging or carrier mishandling | Fixable (Ops) |
| Changed mind / buyer's remorse | 10% - 15% | Home Goods, Apparel | Cognitive dissonance or impulse purchase | Structural/Unfixable |
| Quality below expectation | 10% | Apparel, Jewelry | Material feels cheaper than imagery suggests | Fixable (PDP) |
| Arrived too late | 5% - 8% | Gifting, Apparel | Unclear delivery estimates at checkout | Fixable (Ops) |
| Allergic reaction / sensitivity | 2% - 5% | Jewelry, Beauty | Missing material or ingredient transparency | Fixable (PDP) |
| Found cheaper elsewhere | 3% - 5% | Electronics, Branded Goods | Price sensitivity and comparison shopping | Structural/Unfixable |
| Impulse purchase regret | 5% - 10% | Fast Fashion, Beauty | Emotional buying behavior | Structural/Unfixable |
Frequency estimates aggregated from Narvar, Loop Returns, and Invesp data [3] [4] [5].
The most surprising insight from the data is the sheer volume of returns driven by the expectation-reality gap. While merchants often blame the customer for "bracketing" (buying multiple sizes to return the ones that don't fit), 29% of consumers who bracket say they only do so when sizing or product options are unclear [4]. The most underestimated reason is "doesn't match description," which accounts for nearly a quarter of all returns [3]. This is also the most controllable factor. If a customer returns a product because it looks different than the photos, the product isn't the problem — the photography is.
Not all returns are created equal. To reduce return rates effectively, operators must distinguish between returns they can prevent and returns that are simply the cost of doing business online.
Fixable (PDP)
This is where operators have the highest leverage. Returns caused by sizing, fit, color mismatch, and material expectations can be drastically reduced by upgrading the product detail page. Interventions include:
Fixable (Ops)
These returns stem from post-purchase execution failures. They are entirely within the merchant's control but require operational changes rather than marketing updates. Interventions include upgrading packaging quality to prevent damage, setting accurate delivery expectations at checkout, and improving pick-and-pack accuracy in the warehouse.
Partially Fixable
Returns related to perceived value or quality fall here. While you cannot change the physical product instantly, you can adjust the marketing language to set more accurate expectations, ensuring the price aligns with the perceived quality.
Structural/Unfixable
Some returns are driven by buyer behavior, not merchant failure. Cognitive dissonance, impulse purchase regret, and finding the item cheaper elsewhere are psychological drivers [7]. You cannot eliminate these returns, and attempting to do so by restricting return policies often damages customer lifetime value.
We often see founders at Branvas obsess over their shipping carrier when their return data is screaming at them to rewrite their product description.

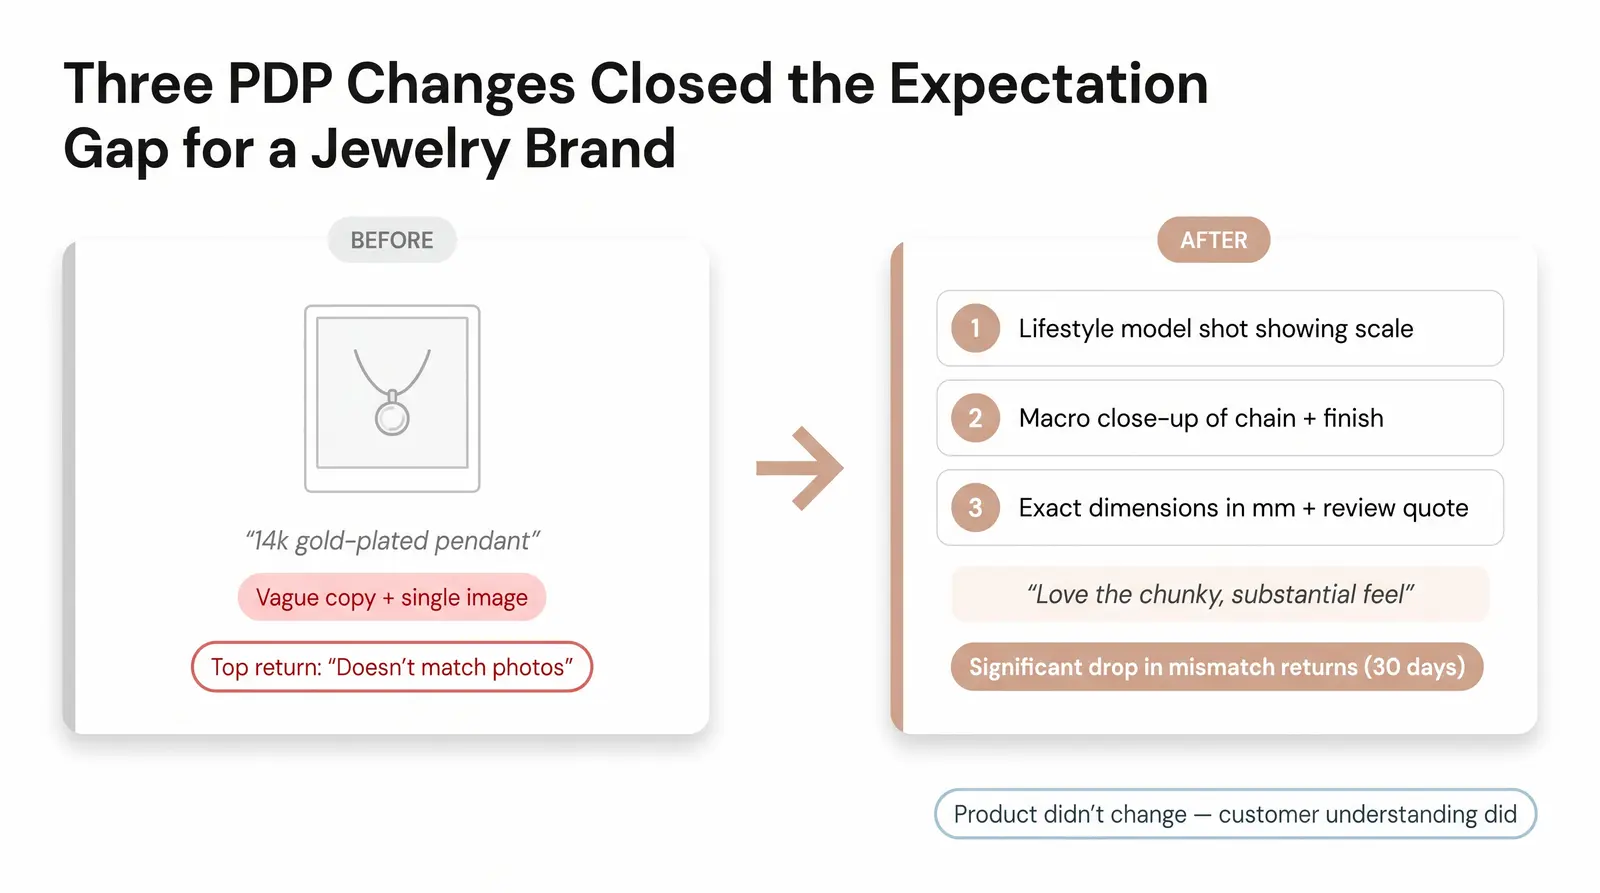
Consider a composite example of a direct-to-consumer jewelry brand struggling with a high return rate. Their number one reason code was "doesn't match photos."
The original PDP featured a single, high-resolution flat-lay image of a gold pendant necklace on a white background. The description simply read "14k gold-plated pendant." Customers were buying the necklace expecting a delicate, dainty piece, but receiving a chunky, heavy pendant. The expectation-reality gap was massive.
The brand implemented three specific PDP changes:
By setting accurate expectations through scale imagery and precise copy, the brand saw a significant reduction in the "doesn't match photos" reason code within the next 30-day return window. The product didn't change, but the customer's pre-purchase understanding did.
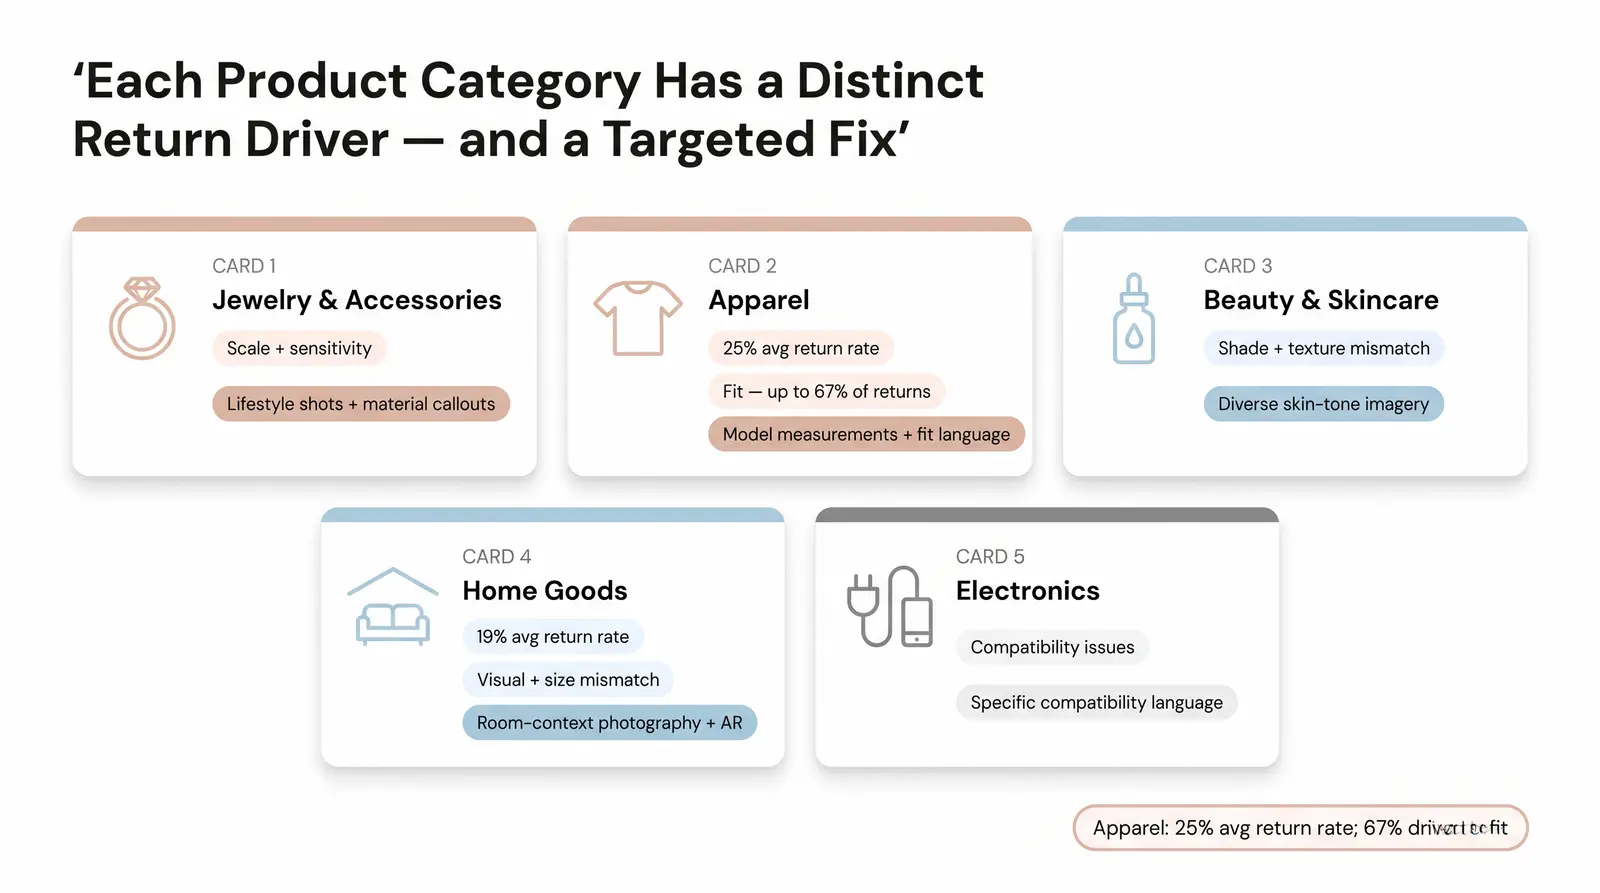
Different product categories suffer from different return drivers. Here is how to apply the Refund Signal Framework™ to the top ecommerce verticals:
Jewelry & Accessories
The highest leverage interventions here are scale imagery and material transparency. Customers frequently return jewelry because it is larger or smaller than expected, or because of metal sensitivities. Include lifestyle photos showing the product on a model, and explicitly call out hypoallergenic materials or specific metal plating. If you're launching or scaling a jewelry brand and want product pages that convert and keep returns low, Branvas's catalog and brand studio tools are built with this in mind — product assets, descriptions, and packaging that set accurate expectations from day one.
Apparel
Apparel suffers the highest return rate, averaging 25% [2]. Fit and size drive up to 67% of these returns [8]. To combat this, disclose model measurements (height and size worn), use fabric feel language (e.g., "stiff denim with zero stretch"), and implement interactive sizing tools or detailed fit feedback from reviews.
Beauty & Skincare
Expectation gaps drive beauty returns, particularly shade mismatches and texture disappointment [5]. Reduce these by offering diverse skin-tone imagery, ingredient transparency, and clear "who this is for" framing to prevent customers with incompatible skin types from purchasing.
Home Goods
With a 19% average return rate, home goods suffer from "buyer's remorse" when items don't fit a space visually or physically [2] [5]. Dimension language is critical, but room-context photography and augmented reality (AR) visualization tools are the most effective ways to reduce visual mismatch returns.
Electronics/Accessories
Returns in this category are driven by functionality and compatibility issues [5]. Use highly specific compatibility language ("Works with iPhone 14 and 15 only") and provide clear use-case specificity to prevent customers from buying the wrong accessory for their device.
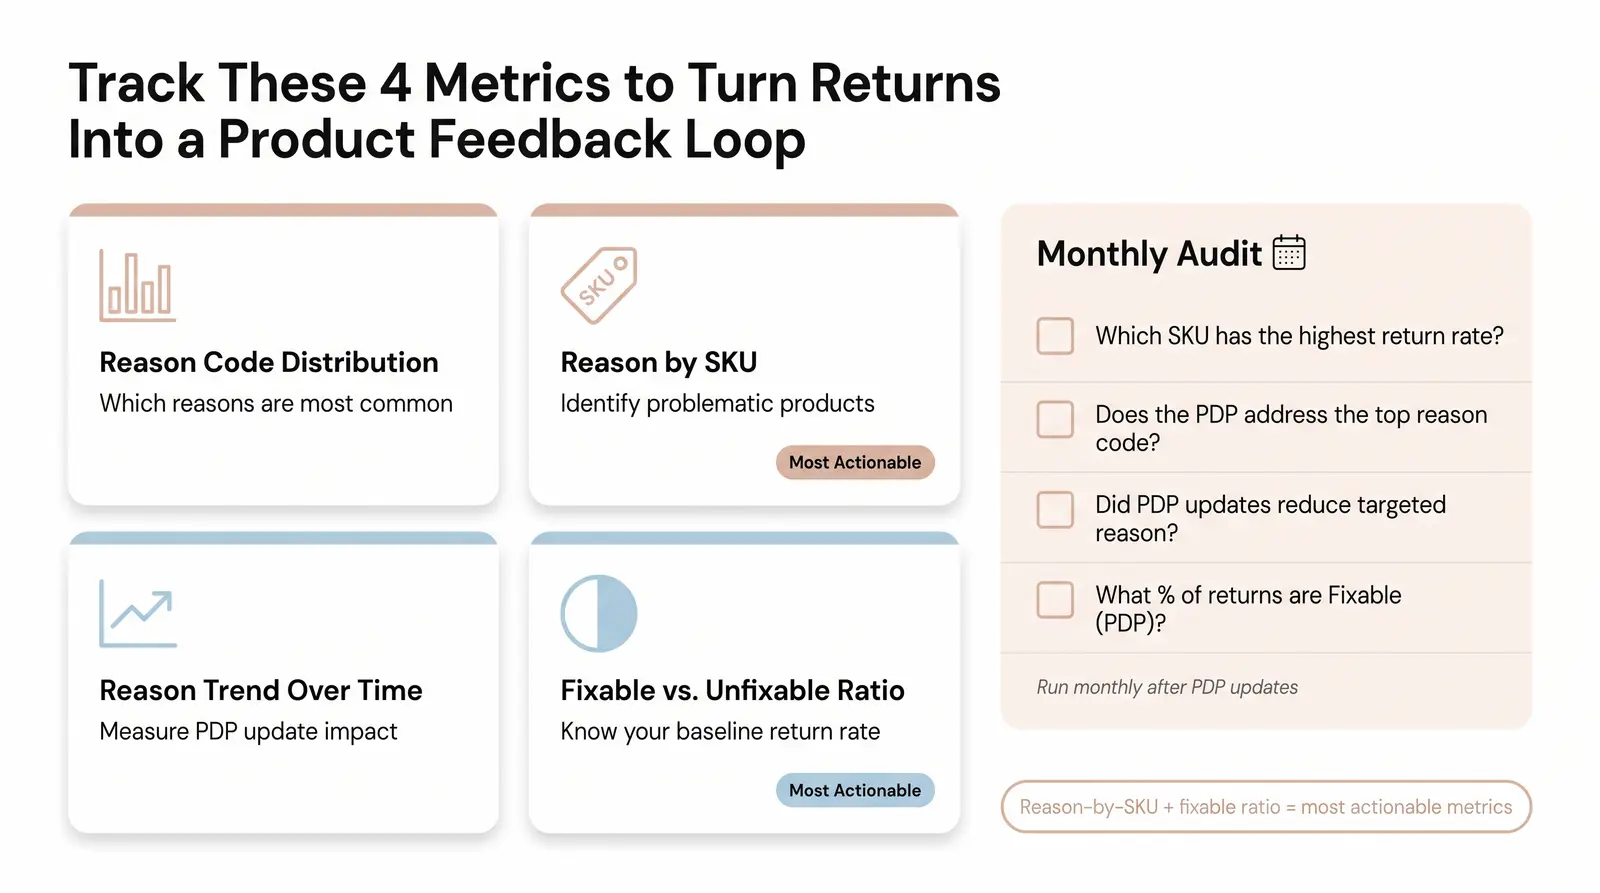
To turn returns from a cost center into a feedback loop, operators need a system for tracking and analyzing return reasons.
Major return platforms like Loop Returns, Narvar, AfterShip, and native Shopify now expose detailed reason-code data. However, relying solely on drop-down menus is insufficient. Operators should set up a free-text tagging system to capture qualitative signals from customer comments.
Key metrics to track include:
Your Monthly Refund Signal Audit — 7 Questions to Ask Your Return Data
Q: What are the most common reasons customers return ecommerce orders?
A: The most common reasons are size and fit issues, the product looking different in person than it did online, and receiving damaged or incorrect items. In apparel, size and fit account for the vast majority of returns, while in categories like jewelry and home goods, expectation-reality gaps drive the highest return volumes.
Q: How do I reduce my ecommerce return rate without restricting my return policy?
A: Focus on improving the pre-purchase experience on your product detail pages. By adding scale imagery, detailed material descriptions, accurate size guides, and lifestyle photography, you can set accurate expectations and significantly reduce returns caused by sizing issues and visual mismatches.
Q: What should I include on a refund form to collect useful reason data?
A: A refund form should include specific, actionable reason codes rather than generic options. Instead of just "didn't like it," offer options like "too small," "color didn't match photo," or "material felt cheap." Always include an optional free-text field so customers can provide qualitative context.
Q: Which product categories have the highest return rates — and why?
A: Apparel and fashion have the highest return rates, averaging around 25%, primarily driven by the difficulty of assessing fit and size online. Home goods and footwear also see high return rates due to the importance of physical dimensions and comfort, which are hard to convey through a screen.
Q: Can better product photography actually reduce returns?
A: Yes. Data shows that 22% of returns occur because the product looks different in real life than it did online. By providing high-quality images from multiple angles, macro shots of textures, and lifestyle images that show scale, you close the expectation gap and reduce preventable returns.
Return reason data is one of the most underused product-development and content inputs available to ecommerce operators. The stores that treat their refund forms as a feedback loop — not a cost center — systematically reduce preventable returns over time. By applying the Refund Signal Framework™, merchants can identify exactly which returns are fixable and deploy targeted PDP updates to protect their margins.
If you're building a jewelry or accessories brand and want to start with a product line, packaging, and page assets designed to minimize return friction from day one, see how Branvas works — or explore the profit calculator to model your margin after returns.