This guide benchmarks 2026 ecommerce return rates across 10 product categories, reveals true return costs, and provides proven category-specific tactics to reduce returns.
Published:
April 26, 2026
Author:
Yi Cui
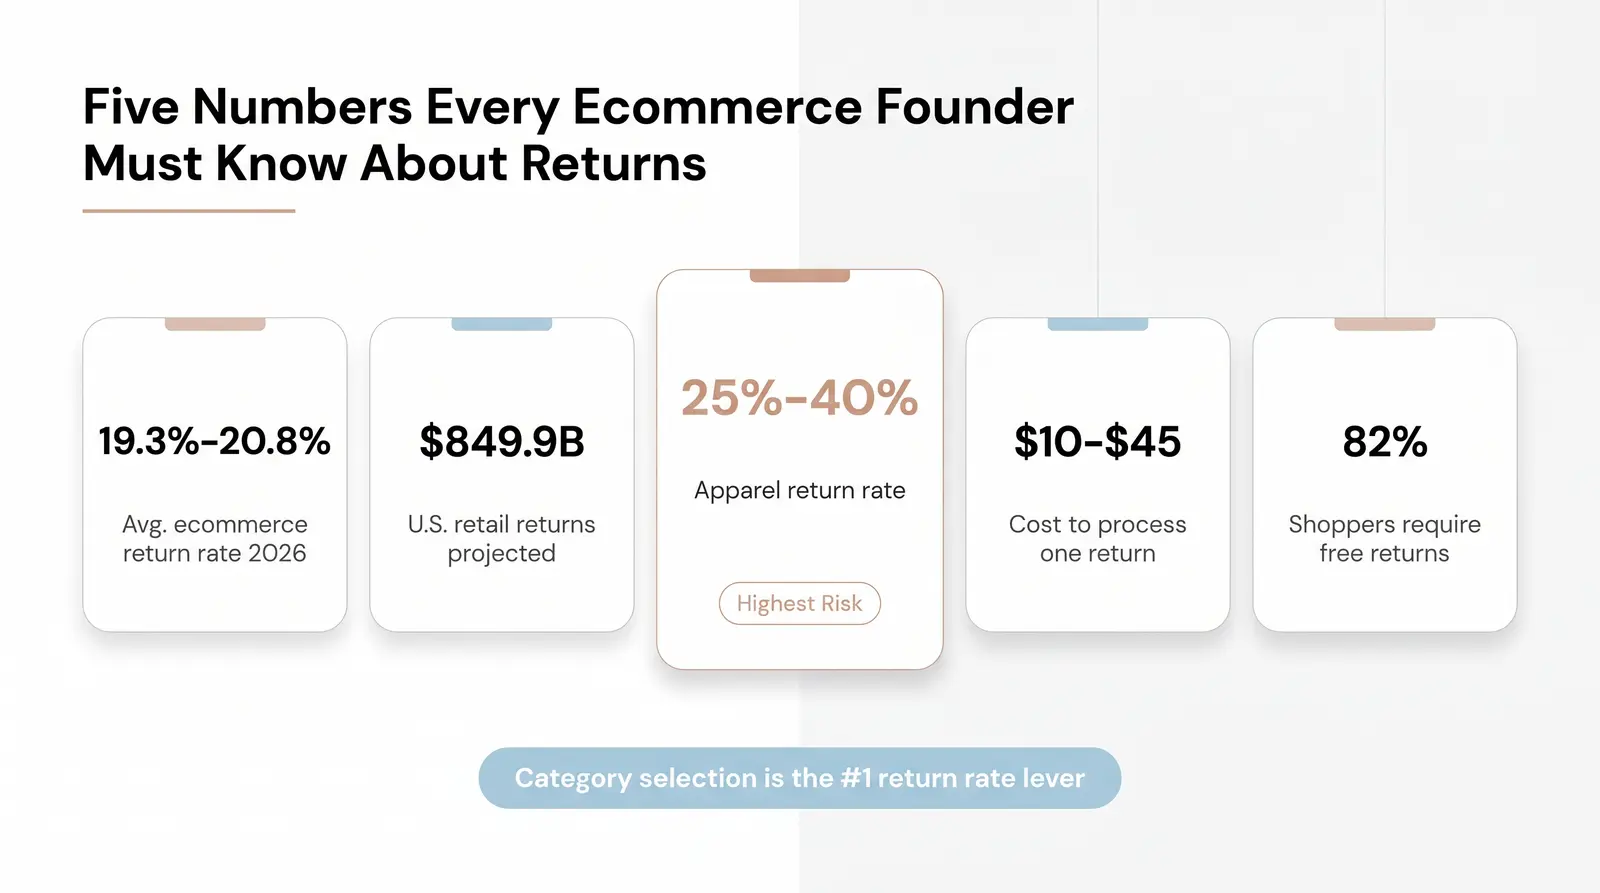
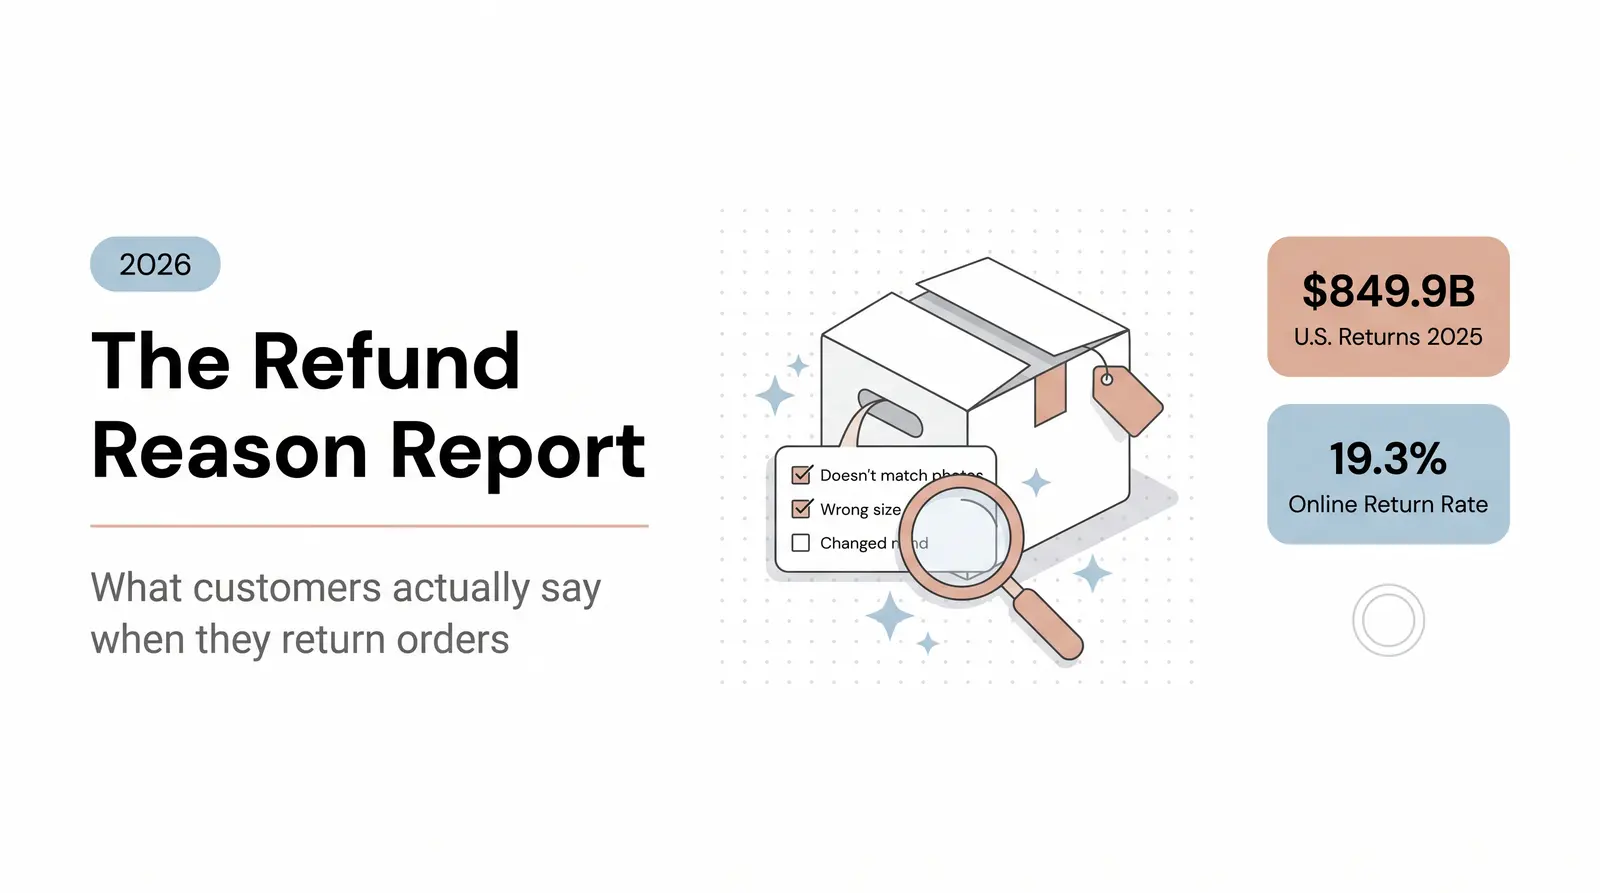
Average return rates are useful, but category benchmarks are what actually matter. A fashion store, jewelry brand, electronics seller, and supplement brand all have different return economics and different ways to reduce avoidable returns. Looking at the headline figure—the projected 19.3% to 20.8% overall ecommerce return rate for 2026 [1] [2]—is like looking at the average temperature of the globe to decide what to wear today. It tells you nothing about the climate you actually operate in.
The reality is that a 20% return rate means something entirely different for a fast-fashion brand than it does for a consumer electronics retailer. The cost structure behind reverse logistics, the likelihood of an item being resold at full price, and the root causes of customer dissatisfaction vary wildly depending on what is in the box.
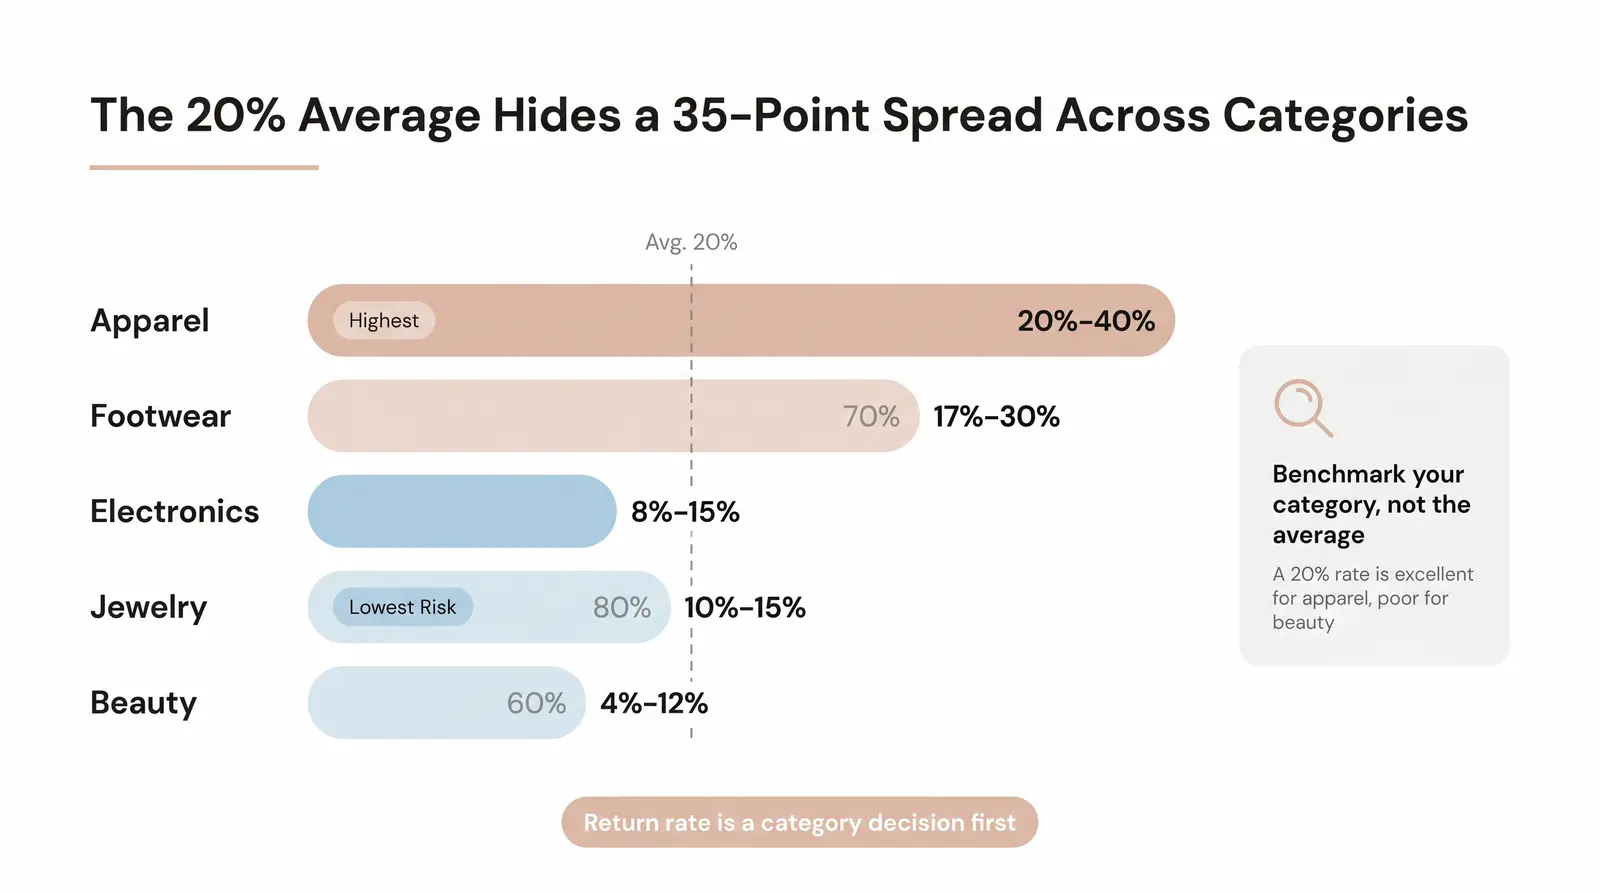
This brings us to a contrarian insight that most ecommerce operators miss: return rate is a product category selection decision as much as it is an operations decision. The structural floor of your return rate is set the moment you choose your catalog. As industry data shows, categories where fit and silhouette uncertainty is highest—like apparel—have the highest return rates [6]. Many brands can structurally reduce returns by 30% to 50% simply by shifting their product mix toward lower-fit-risk, lower-expectations-gap categories. You cannot engineer a 30% apparel return rate down to 5% with better size charts, but you can build a business in a category where 5% to 12% is the baseline.
To understand this dynamic, we use the Branvas Return Risk Framework.
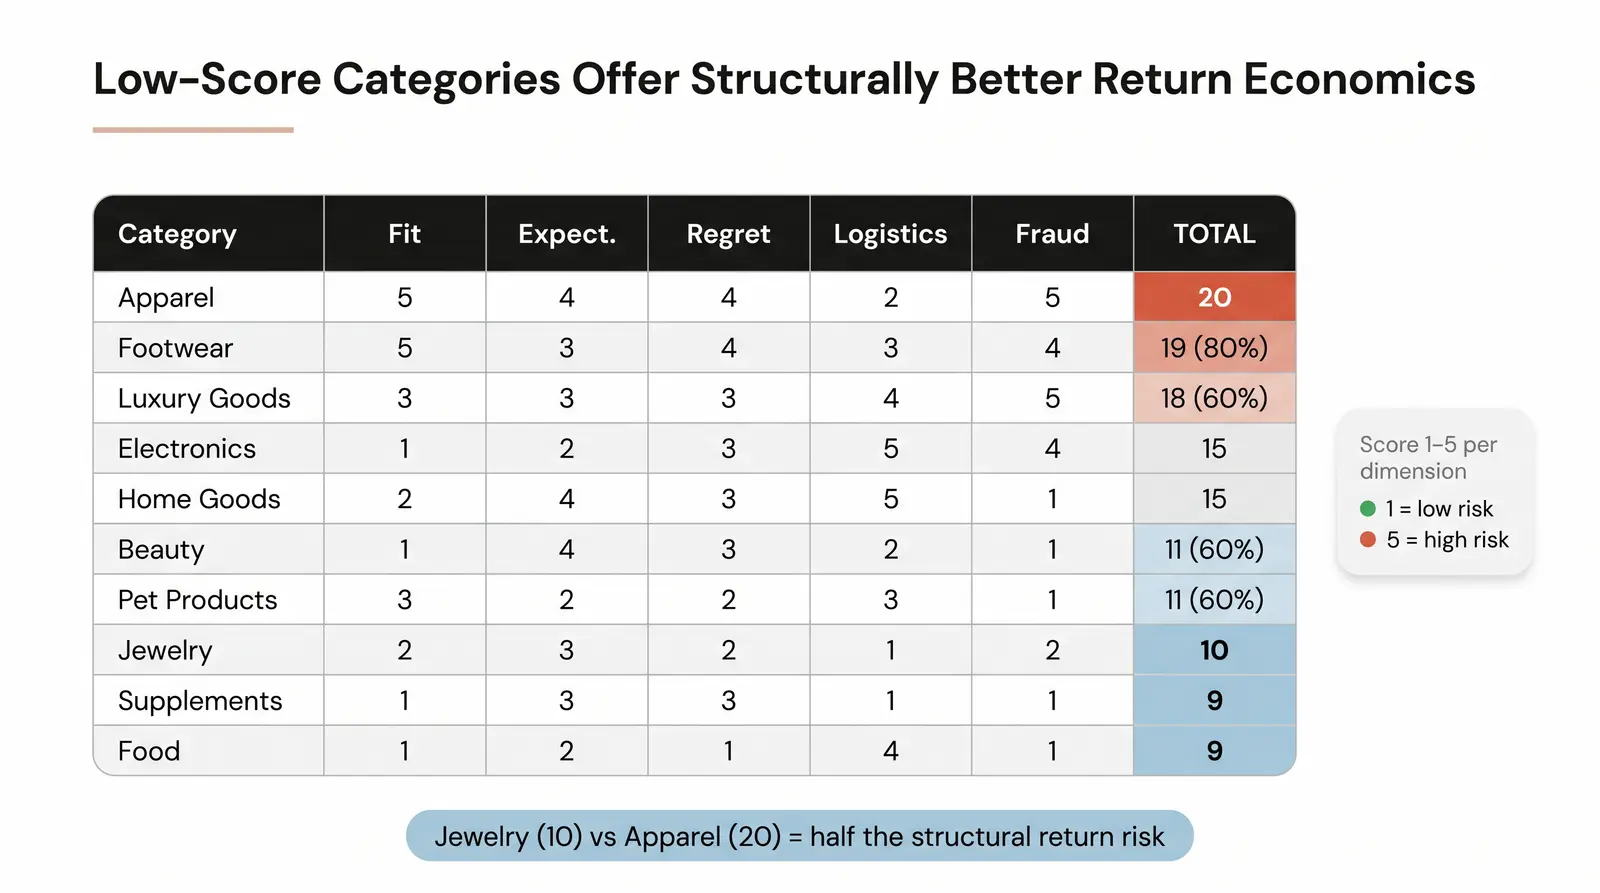
When evaluating new product lines or advising founders on catalog expansion, we use The Branvas Return Risk Framework™. This is a scoring model that rates product categories on five dimensions that fundamentally drive returns.
Each dimension is scored from 1 to 5, where 1 represents low return risk and 5 represents high return risk.
| Product Category | Fit Sensitivity | Expectations Gap Risk | Use-Case Regret Rate | Return Logistics Cost | Fraud/Wardrobing Exposure | Total Return Risk Score |
|---|---|---|---|---|---|---|
| Apparel/Clothing | 5 | 4 | 4 | 2 | 5 | 20 |
| Footwear | 5 | 3 | 4 | 3 | 4 | 19 |
| Consumer Electronics | 1 | 2 | 3 | 5 | 4 | 15 |
| Home Goods & Furniture | 2 | 4 | 3 | 5 | 1 | 15 |
| Luxury Goods | 3 | 3 | 3 | 4 | 5 | 18 |
| Beauty & Cosmetics | 1 | 4 | 3 | 2 | 1 | 11 |
| Pet Products | 3 | 2 | 2 | 3 | 1 | 11 |
| Jewelry & Accessories | 2 | 3 | 2 | 1 | 2 | 10 |
| Supplements & Health | 1 | 3 | 3 | 1 | 1 | 9 |
| Food & Grocery | 1 | 2 | 1 | 4 | 1 | 9 |
Note: Higher scores indicate a higher structural risk of returns.
Founders should use this table as a strategic filter. If you are launching a brand with limited working capital, starting in a category with a score of 18–20 means you are immediately taking on a massive reverse logistics burden. Conversely, categories scoring 9–11 offer much more forgiving unit economics, allowing you to focus cash on customer acquisition rather than return processing.
To understand where your store stands, you must benchmark against your specific vertical. Below is the most current data on ecommerce return rates by category for 2025–2026.
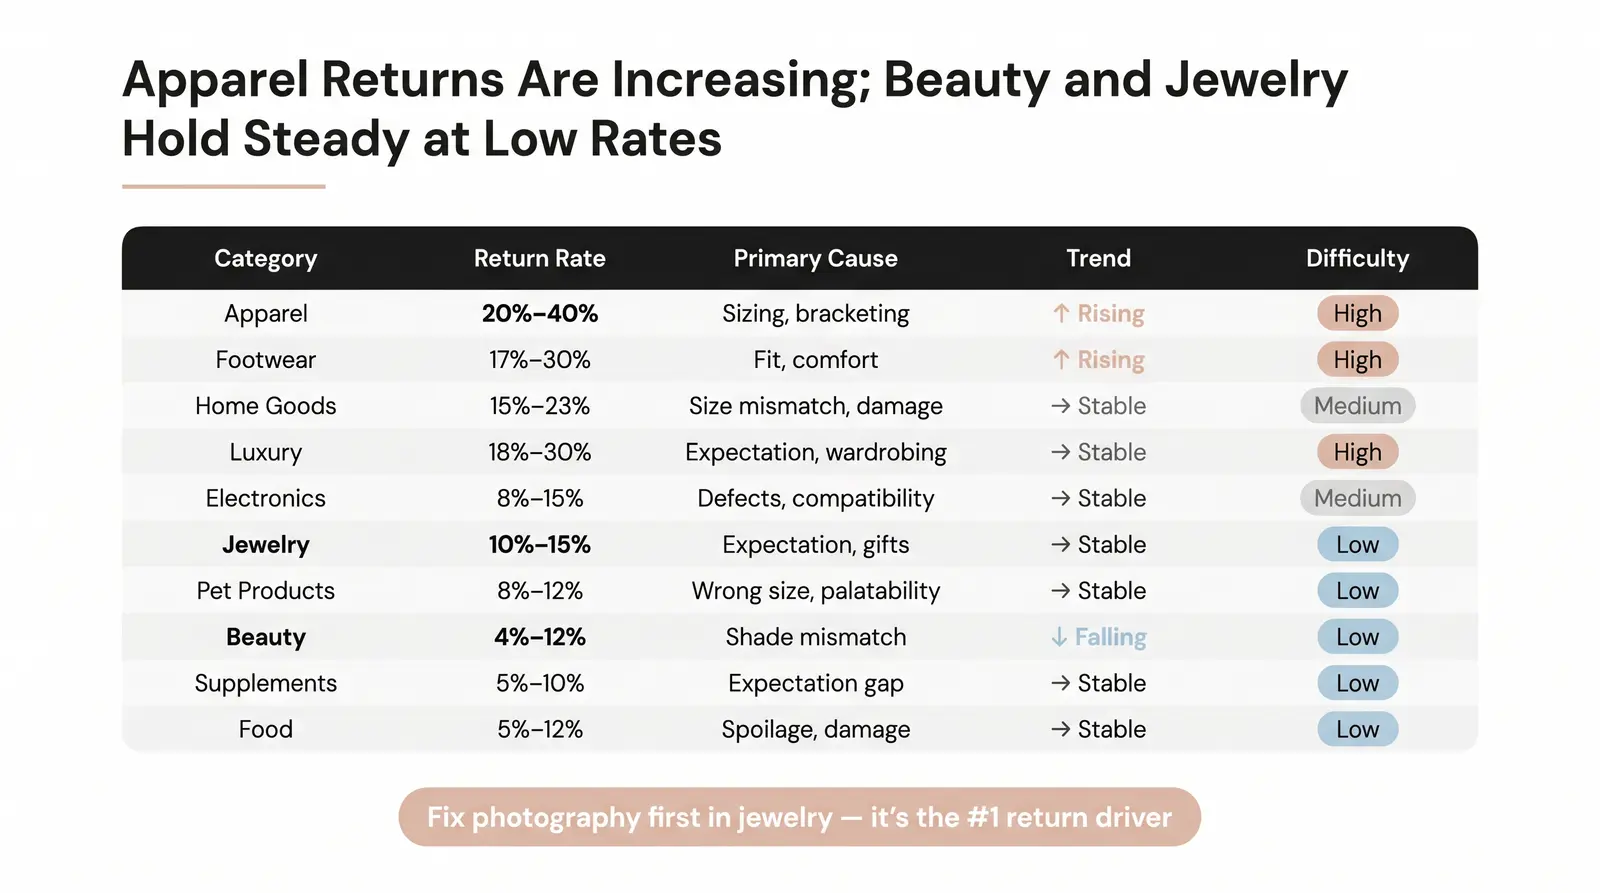
| Product Category | Estimated Return Rate Range (%) | Primary Return Reason(s) | Return Trend | Difficulty to Reduce |
|---|---|---|---|---|
| Apparel/Clothing | 20% – 40% | Sizing issues, bracketing, wardrobing | ↑ Increasing | High |
| Footwear | 17% – 30% | Fit issues, comfort, bracketing | ↑ Increasing | High |
| Home Goods & Furniture | 15% – 23% | Size/space mismatch, transit damage | → Stable | Medium |
| Luxury Goods | 18% – 30% | Expectation mismatch, wardrobing | → Stable | High |
| Consumer Electronics | 8% – 15% | Defective, compatibility issues | → Stable | Medium |
| Jewelry & Accessories | 10% – 15% | Expectation mismatch, gift returns | → Stable | Low |
| Pet Products | 8% – 12% | Wrong size, palatability | → Stable | Low |
| Beauty & Cosmetics | 4% – 12% | Wrong shade, allergic reaction | ↓ Decreasing | Low |
| Supplements & Health | 5% – 10% | Expectation gap, subscription churn | → Stable | Low |
| Food & Grocery | 5% – 12% | Spoilage, transit damage | → Stable | Low |
(Data compiled from NRF, Statista, Appriss Retail, and industry benchmarks [1] [3] [4] [7].)
Apparel/Clothing: The apparel category consistently leads ecommerce returns, hovering between 20% and 40% [3] [4]. The primary driver is fit uncertainty, exacerbated by the growing trend of "bracketing"—where shoppers buy multiple sizes with the intent to return the ones that do not fit [1]. To reduce these rates, merchants must invest in virtual try-on technology or exact garment measurements rather than generic size charts.
Footwear: Running closely behind apparel, footwear return rates sit between 17% and 30% [3]. Comfort and brand-to-brand sizing variance are the main culprits. Brands that implement 3D foot scanning tools or highly detailed descriptions of width and arch support see the best reduction results.
Home Goods & Furniture: At 15% to 23%, furniture returns are moderately frequent but extremely expensive [3]. Returns are usually driven by a visual mismatch between the screen and the room, or transit damage. Augmented reality (AR) room visualization tools are the most effective non-generic tactic for this category.
Luxury Goods: Luxury return rates often surprise founders, landing between 18% and 30% [7]. The high price point creates a low tolerance for any expectation mismatch, and the category is highly susceptible to wardrobing (wearing an item once and returning it). Implementing discrete, tamper-evident tags that must remain attached for a refund is a proven reduction tactic.
Consumer Electronics: Electronics maintain a lower rate of 8% to 15% [3]. Because specifications are standardized, returns are rarely about preference; they are usually due to perceived defects or compatibility issues. Pre-shipment testing protocols and strict compatibility checkers on the product page can meaningfully cut these returns.
Jewelry & Accessories: This category enjoys a very manageable 10% to 15% return rate [4]. In our experience working with jewelry founders at Branvas, the most common return driver isn't product quality—it's expectation mismatch from low-quality product photography and missing size context. Fixing photography alone can cut return rates materially.
Pet Products: Pet returns are moderate, typically 8% to 12% [4]. Sizing for accessories (like harnesses) and palatability for consumables drive the bulk of returns. Offering trial-size consumable packs prevents full-size product returns.
Beauty & Cosmetics: Kept low by hygiene restrictions, beauty returns range from 4% to 12% [3]. The main driver is shade mismatch. Offering digital shade-matching tools or shipping a tiny sample packet alongside the full-size sealed product (allowing the customer to test the sample before opening the main product) is highly effective.
Supplements & Health: At 5% to 10%, supplement returns are low [4]. The real attrition in this category shows up as subscription churn rather than physical returns. Framing satisfaction guarantees around confidence rather than open-door return policies helps maintain this low rate.
Food & Grocery: Sitting between 5% and 12%, food returns are almost entirely logistical [4]. Transit damage, spoilage, or picking errors are the causes. Upgrading packaging durability is the single best tactic here.
The refund amount is only a fraction of what a return actually costs your business. The true cost of a return includes reverse logistics (shipping), restocking labor, repackaging materials, inventory depreciation (items that can no longer be sold at full price), fraud or wardrobing losses, and the write-off of the Customer Acquisition Cost (CAC) spent to get that order [5].
Industry data indicates that processing a single return costs between $10 and $45 [5]. When you factor in all operational drag, returns can consume up to 21% of an order's value [8].
Worked Example: The $500K Brand Comparison
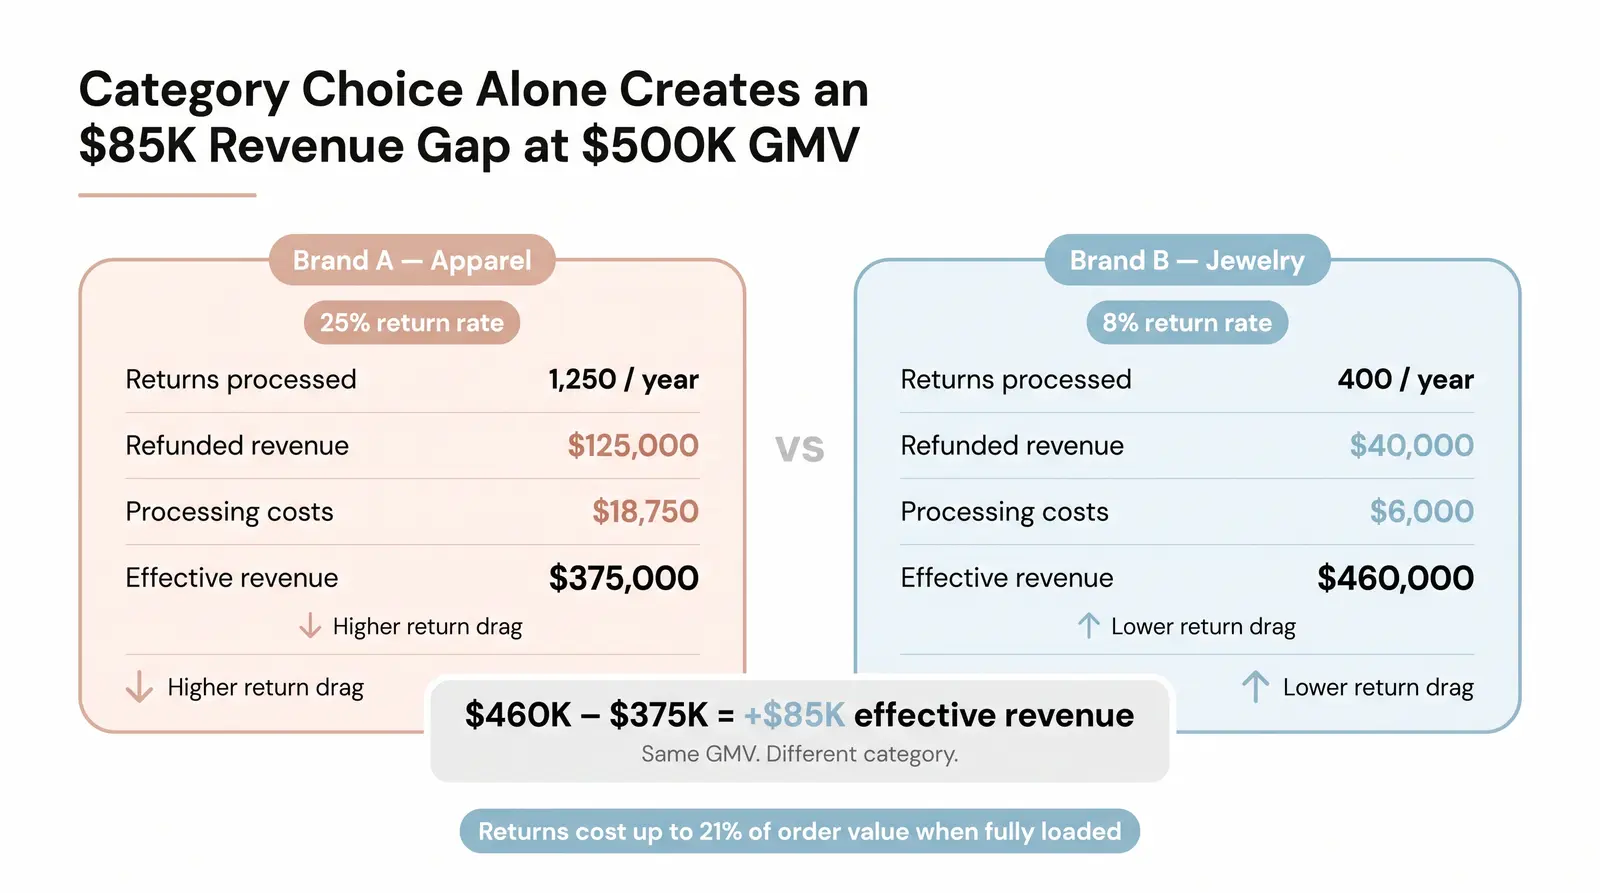
Consider two DTC brands on Shopify, both doing $500,000 a year in Gross Merchandise Value (GMV) with an Average Order Value (AOV) of $100. That is 5,000 orders per year. Assume a conservative processing cost of $15 per return.
Brand A (Apparel): Operates at a 25% return rate. They process 1,250 returns annually.
Refunded Revenue: $125,000
Processing Costs (1,250 x $15): $18,750
Effective Revenue: $375,000
Margin lost to processing: $18,750
Brand B (Jewelry): Operates at an 8% return rate. They process 400 returns annually.
Refunded Revenue: $40,000
Processing Costs (400 x $15): $6,000
Effective Revenue: $460,000
Margin lost to processing: $6,000
These numbers are why category selection matters as much as return policy optimization. A lower-return-risk category can mean tens of thousands of dollars in recovered margin at the same revenue level. Brand B has $85,000 more in effective revenue and saves over $12,000 in pure operational costs, simply by existing in a different product category.
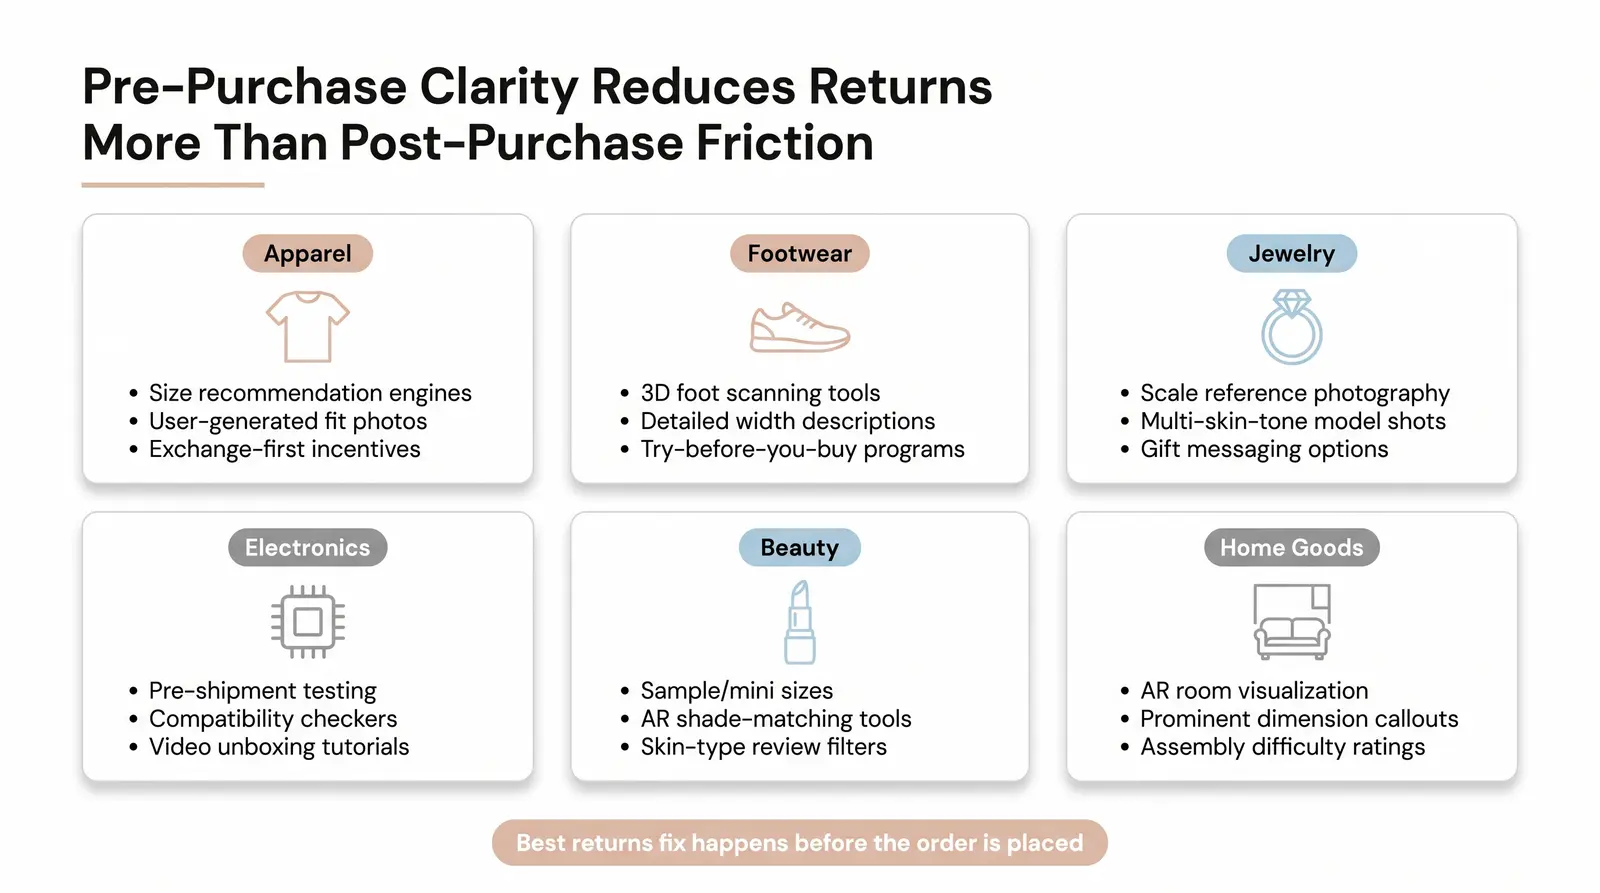
You cannot optimize a return rate to zero, but you can prevent the avoidable returns. Here are specific, actionable tactics by category.
Apparel:
Footwear:
Jewelry:
Electronics:
Beauty:
Home Goods:
Supplements:
Luxury:
We often see founders over-invest in return policy language and under-invest in pre-purchase clarity. The best return rate reduction happens before the order is placed.
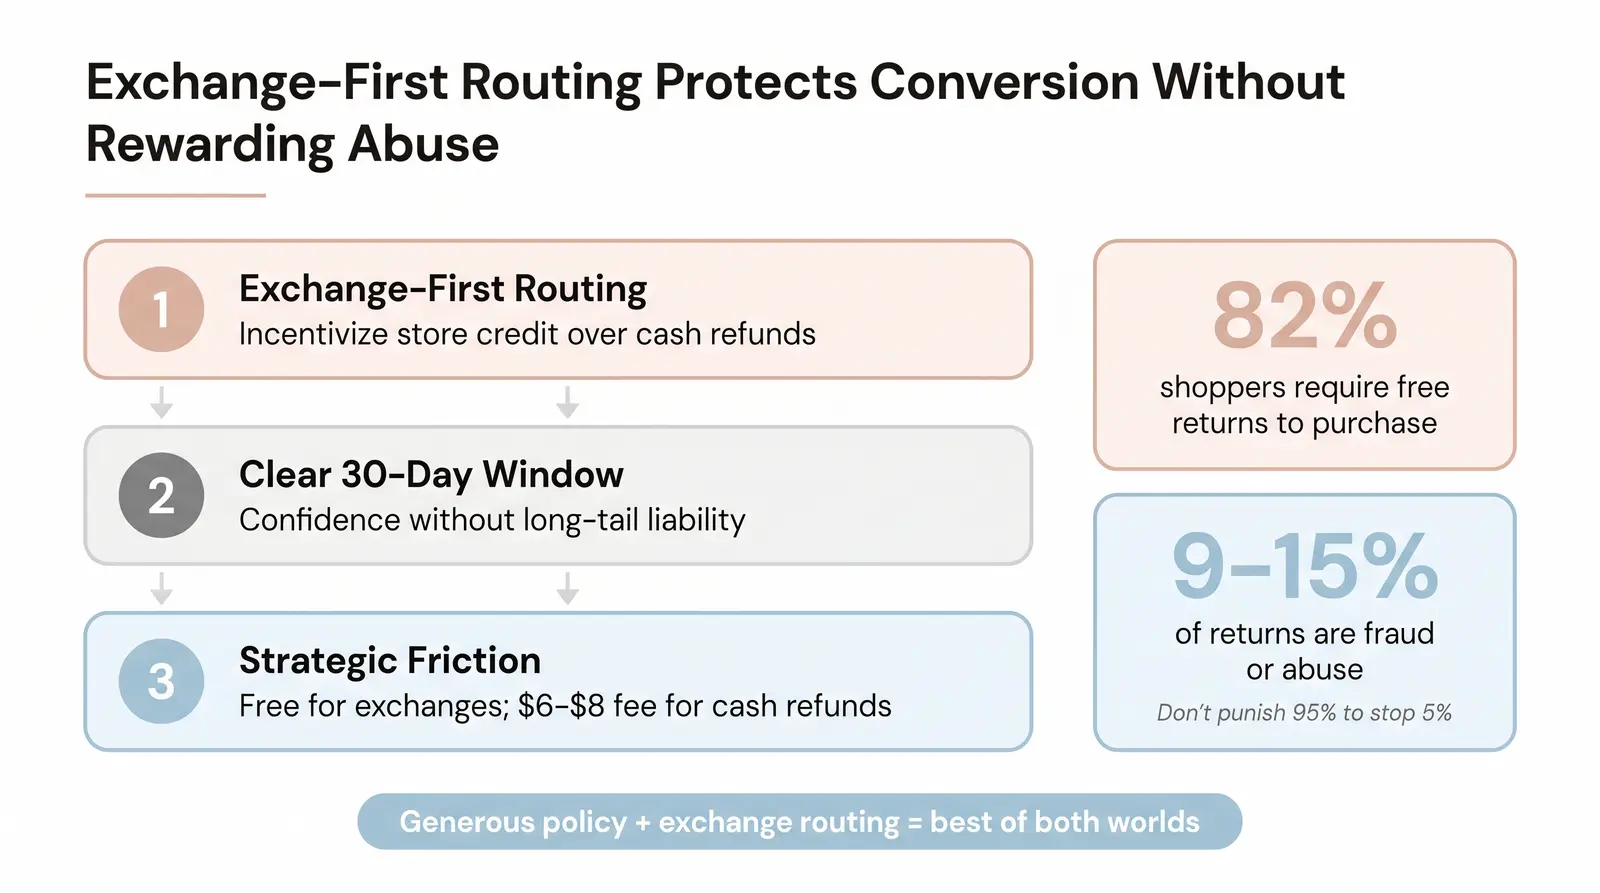
There is a fundamental tension in ecommerce: generous return policies increase conversion, but they also increase return rates. Data from the NRF shows that 82% of consumers consider free returns a major factor in their purchase decision, and 71% will abandon a retailer after a poor return experience [1].
However, founders must distinguish between the return rate and the return abuse rate. Return fraud and abuse (like wardrobing or empty-box returns) account for roughly 9% to 15% of all returns [1] [9]. Most small to mid-size brands do not need to build hostile, friction-heavy return policies to fight abuse until they scale past a certain threshold. Punishing 95% of your honest customers to deter 5% of bad actors will hurt your conversion rate more than it saves in return costs.
For DTC brands under $2M in GMV, follow these three return policy principles:
If you're launching a product line and want to start with a lower-return-risk category, explore Branvas's jewelry and accessories catalog — small, giftable, and designed for low-regret purchasing.
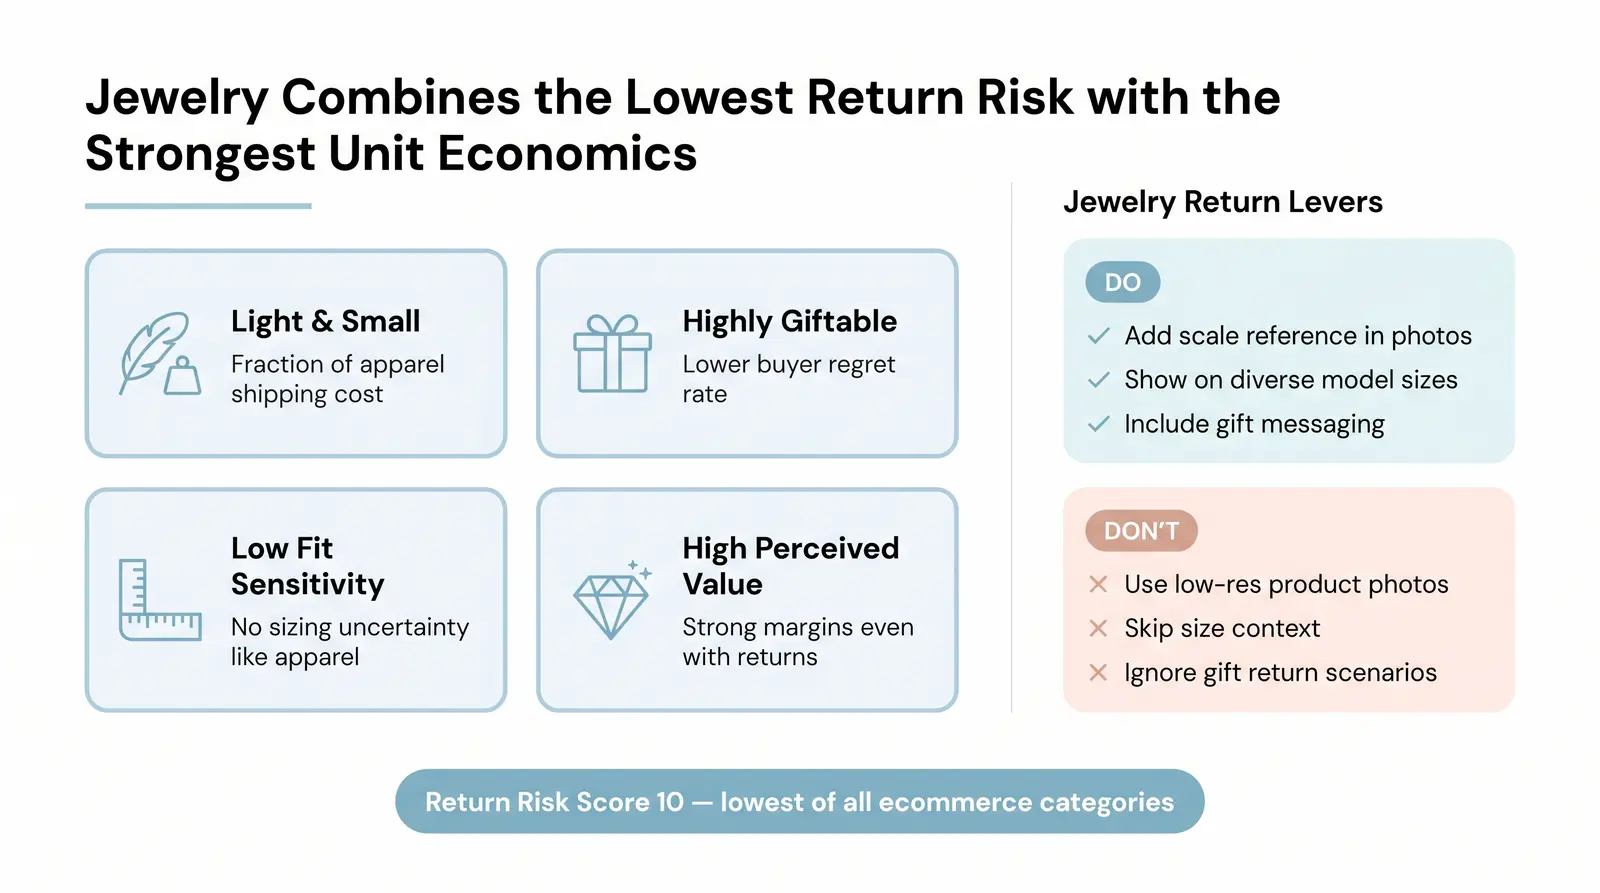
When you look at the Return Risk Framework and the benchmark data, jewelry and accessories emerge as one of the most operationally attractive categories for ecommerce founders.
The physical nature of the product provides massive logistical advantages. Their small size and light weight mean both outbound shipping and reverse logistics costs are a fraction of what it costs to ship apparel or home goods. Furthermore, jewelry is highly giftable, which naturally carries a lower buyer regret rate. Because there is significantly lower fit sensitivity than apparel, the structural return rate is inherently lower. Combined with a high perceived value relative to product cost, the unit economics remain strong even when returns do occur.
This doesn't mean jewelry returns don't happen—it means the levers to reduce them are entirely within a founder's control. You can fix a scale issue with better photography; you cannot fix a customer's changing waistline.
Branvas helps founders launch private-label jewelry and accessories brands without inventory risk. If you're evaluating product categories for a new DTC brand or want to expand into a lower-return-risk vertical, see how Branvas works or check our pricing.
The average ecommerce return rate heading into 2026 is approximately 19.3% to 20.8%. This is significantly higher than brick-and-mortar retail, which sits around 8.7%. However, this average varies heavily by product category.
Apparel and clothing consistently have the highest return rates, typically ranging from 20% to 40%. This is driven primarily by sizing issues, fit uncertainty, and the consumer habit of "bracketing" (buying multiple sizes to try on at home).
A "good" return rate depends entirely on what you sell. For an apparel brand, 20% is excellent. For a consumer electronics store, 8% is standard. For a jewelry or beauty brand, you should aim for under 10%. Always benchmark against your specific category, not the global ecommerce average.
Apparel returns are high because of fit sensitivity and the expectations gap. Customers cannot try garments on, feel the fabric, or see the exact drape online. This leads to speculative purchasing and bracketing, resulting in massive return volumes.
Focus on pre-purchase clarity rather than post-purchase friction. Improve your product photography, use exact measurement size guides, offer AR visualization, and implement an exchange-first returns portal that incentivizes store credit over cash refunds.