Inventory is a silent cash trap. Uncover hidden carrying costs (up to 41%), calculate your true expenses, and learn ten strategies to prevent dead stock and improve your cash flow.
Published:
January 29, 2026
Author:
Yi Cui
For many Shopify merchants, inventory is both a primary growth driver and a silent cash trap. While revenue and profit margins are celebrated, the true cost of holding inventory often goes unmeasured, quietly eroding a brand’s financial health. This article provides a comprehensive breakdown of these hidden costs, supported by recent data, and offers actionable strategies for Shopify founders to build more resilient, cash-efficient businesses.
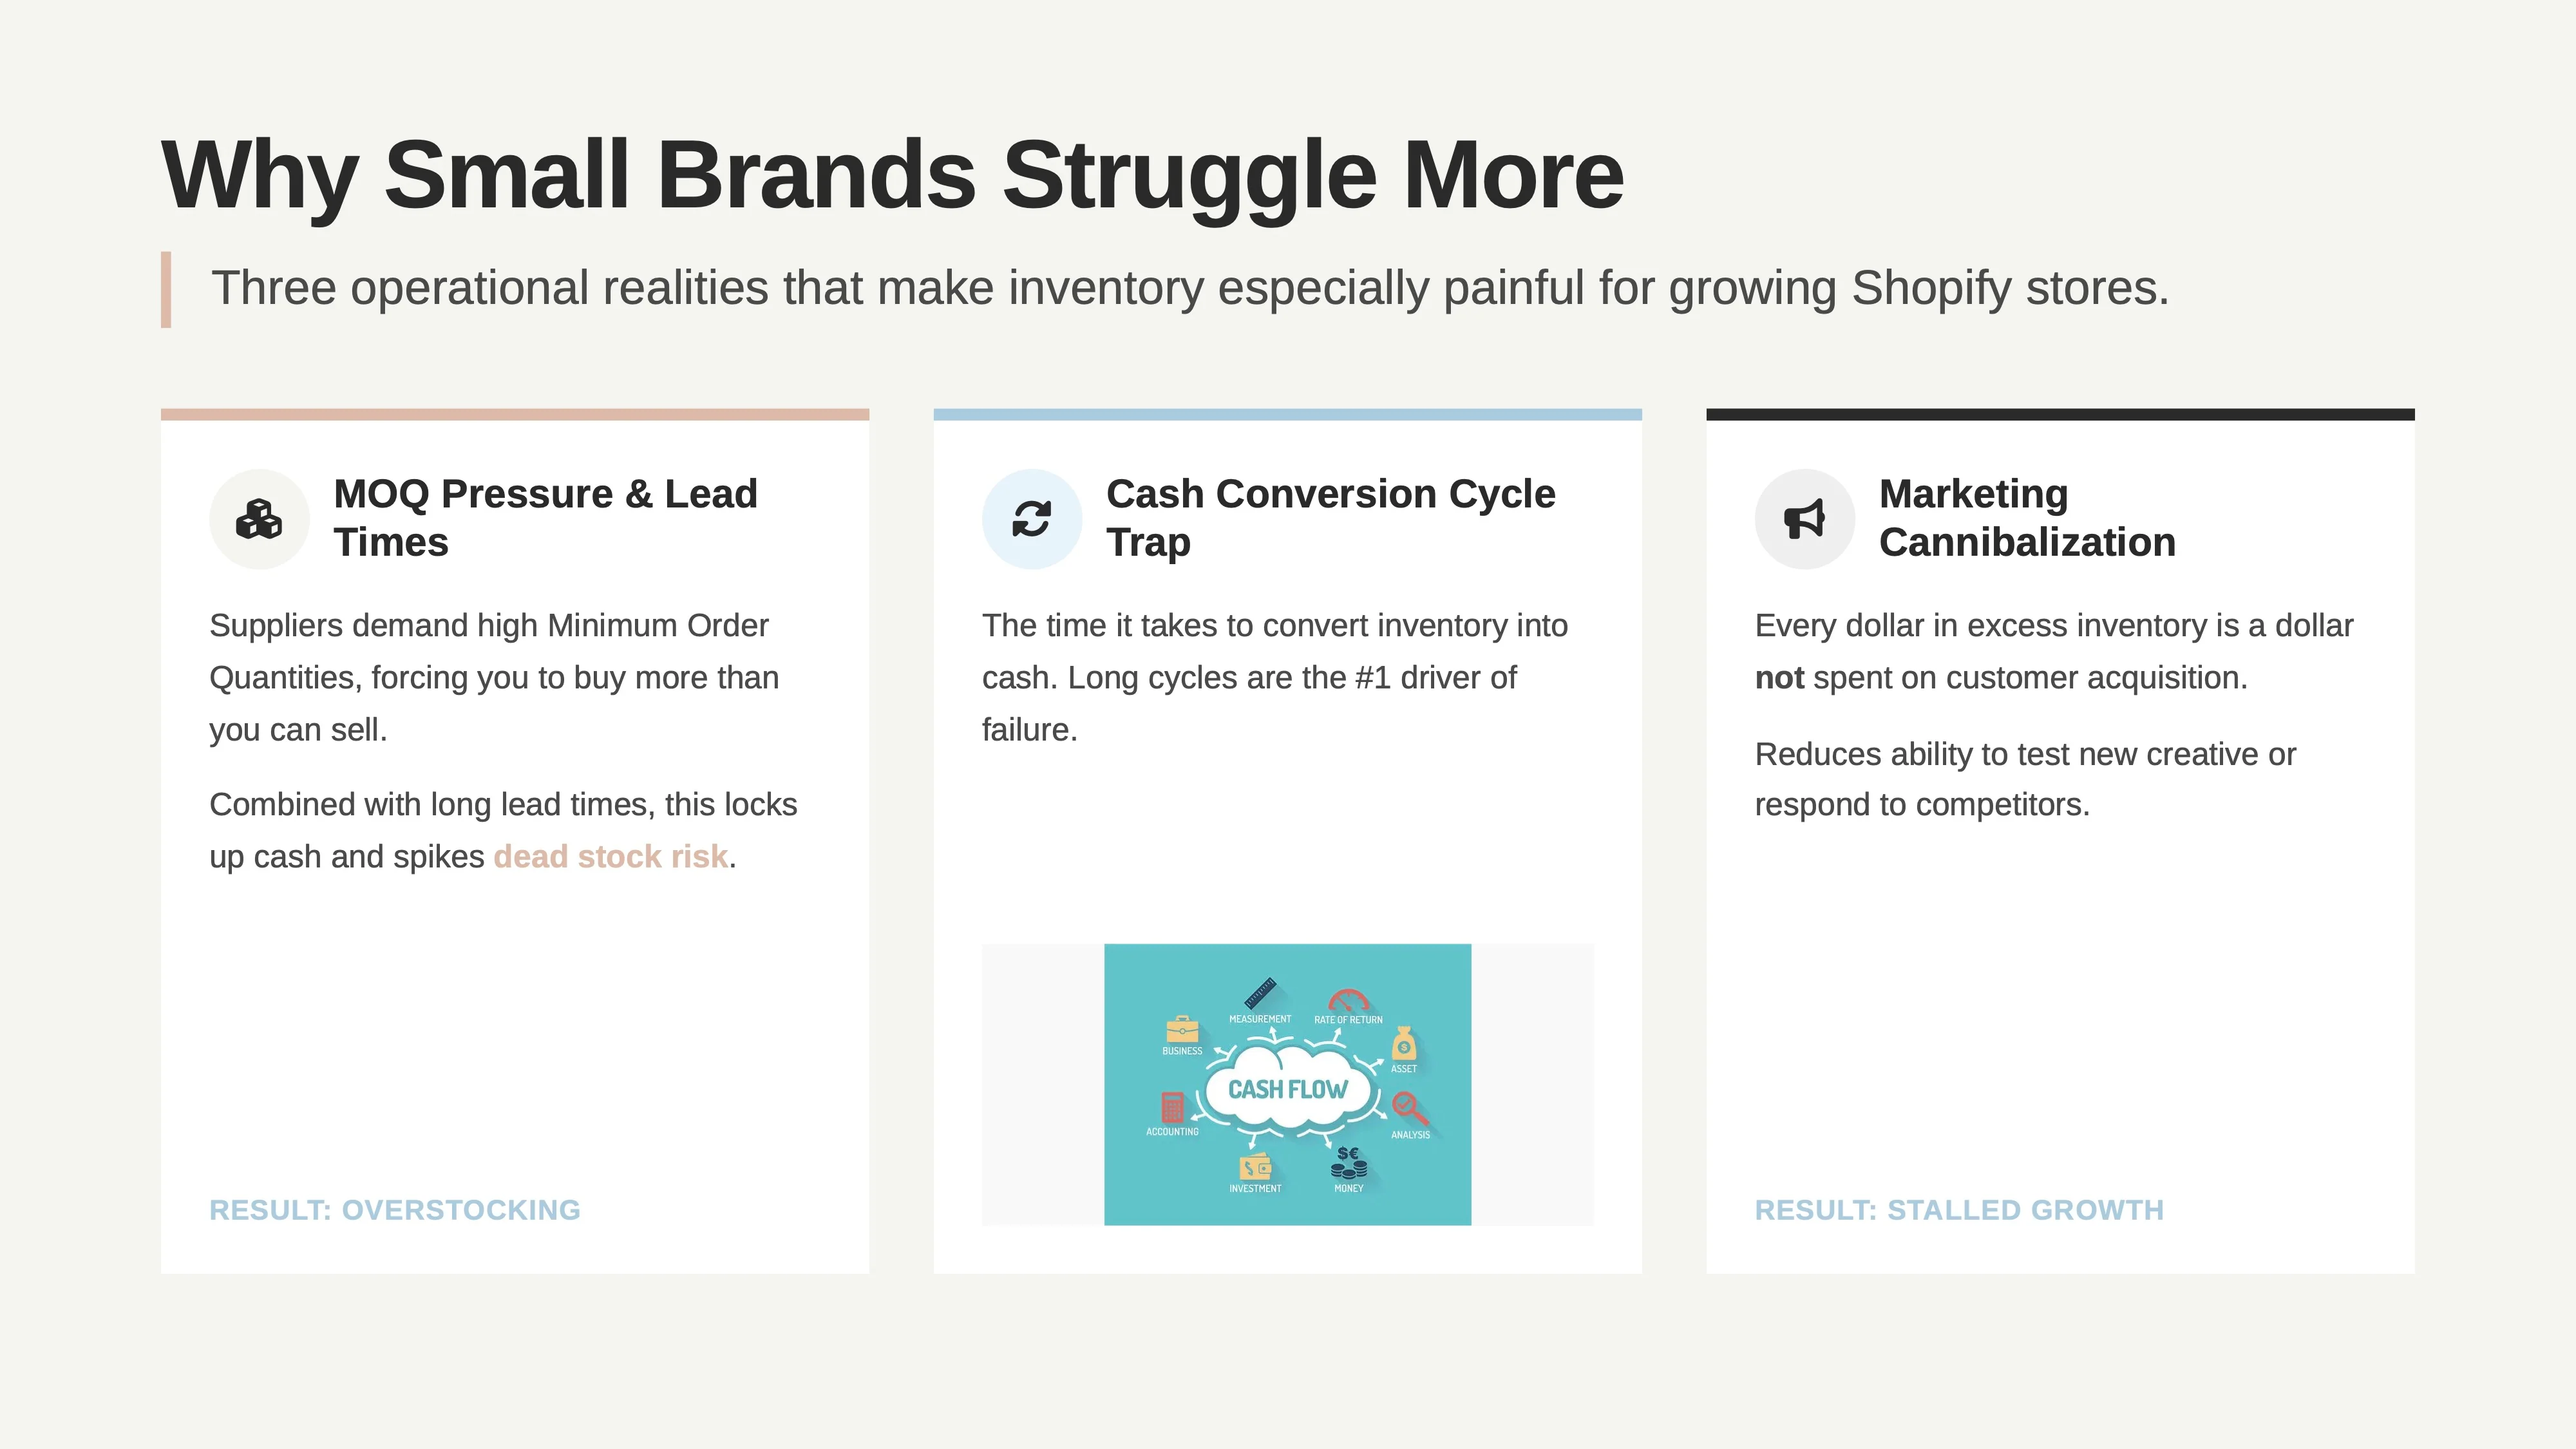
For new and scaling Shopify brands, the relationship with inventory is complex. On one hand, having products on hand is essential to fulfilling customer orders and driving growth. On the other, every dollar tied up in unsold stock is a dollar that cannot be invested in marketing, product development, or other critical business areas. This creates a dangerous illusion of “profit on paper” while cash reserves dwindle. As one Shopify expert notes, “Your business may turn a profit on paper, with plenty of sales and strong profit margins. But if you don’t have enough cash on hand to pay bills, you’re facing serious cash flow issues” [1].
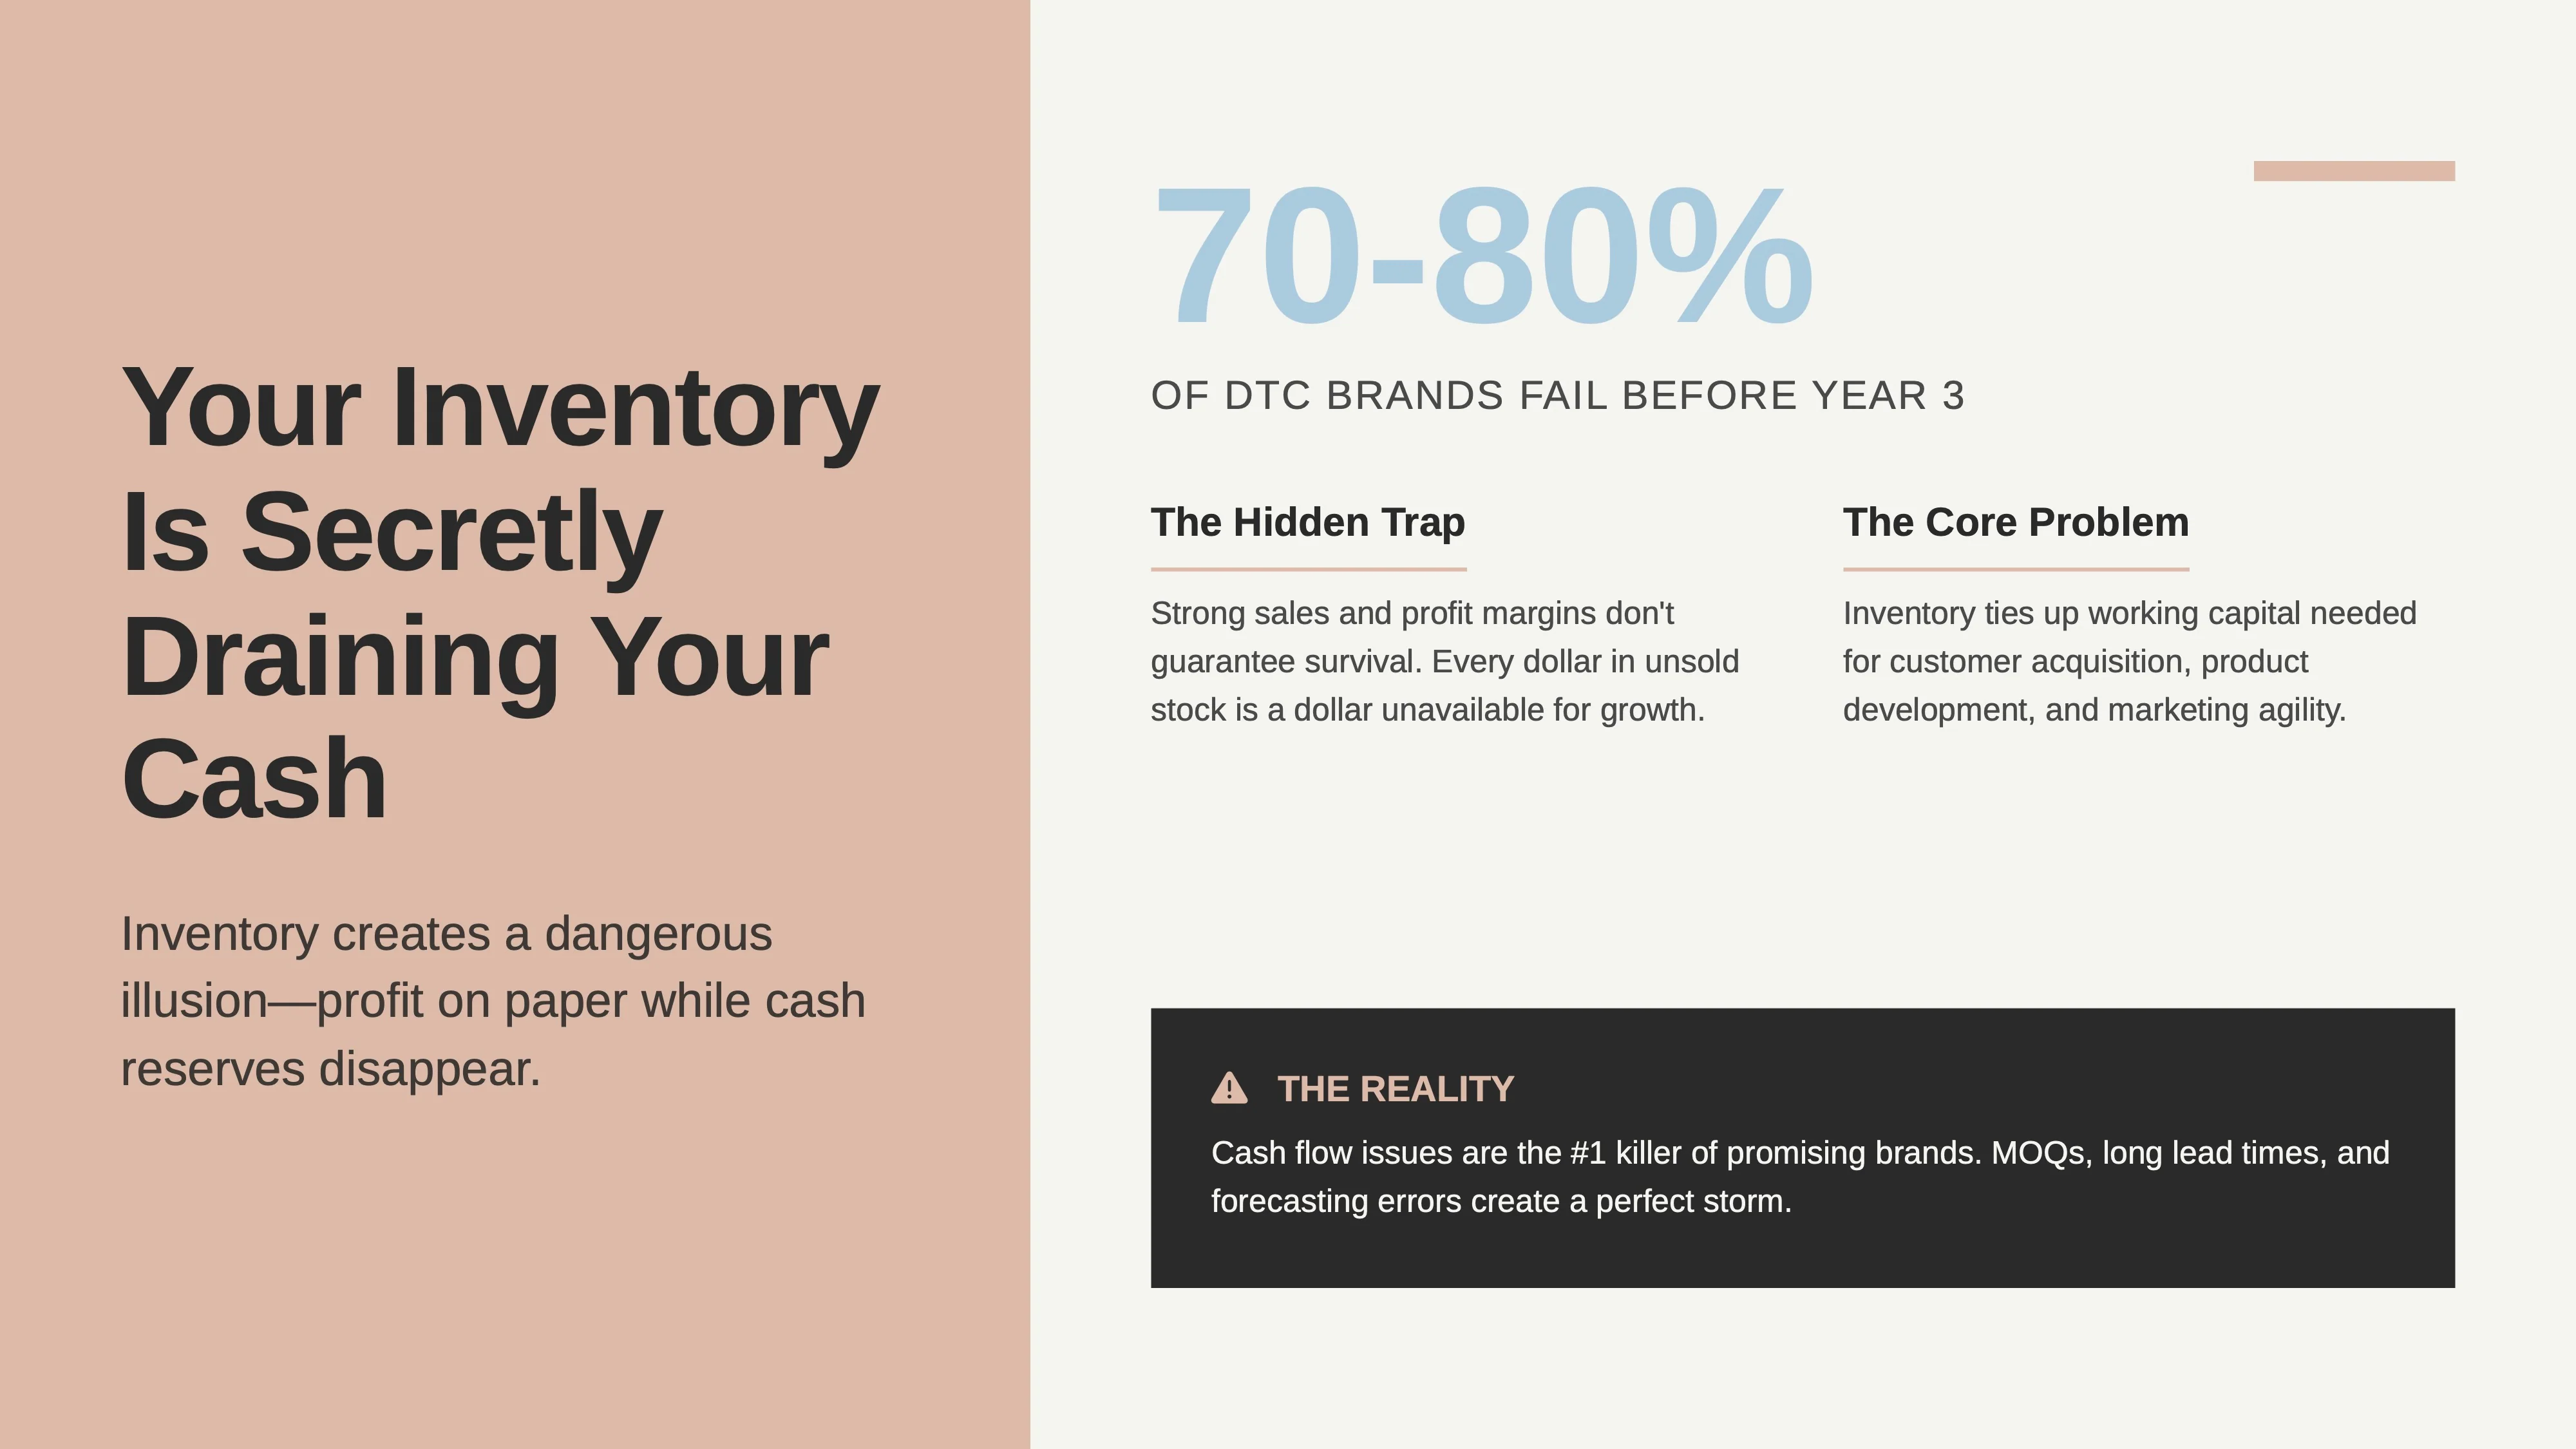
This is not a theoretical problem. A staggering 70-80% of direct-to-consumer (DTC) brands fail before their third year, often due to operational and cash-flow blind spots directly linked to inventory mismanagement [2]. The pressure to meet minimum order quantities (MOQs), coupled with long lead times and forecasting errors, creates a perfect storm that can cripple even the most promising brands. Understanding the full, all-in cost of holding that inventory is the first step toward navigating this challenge.
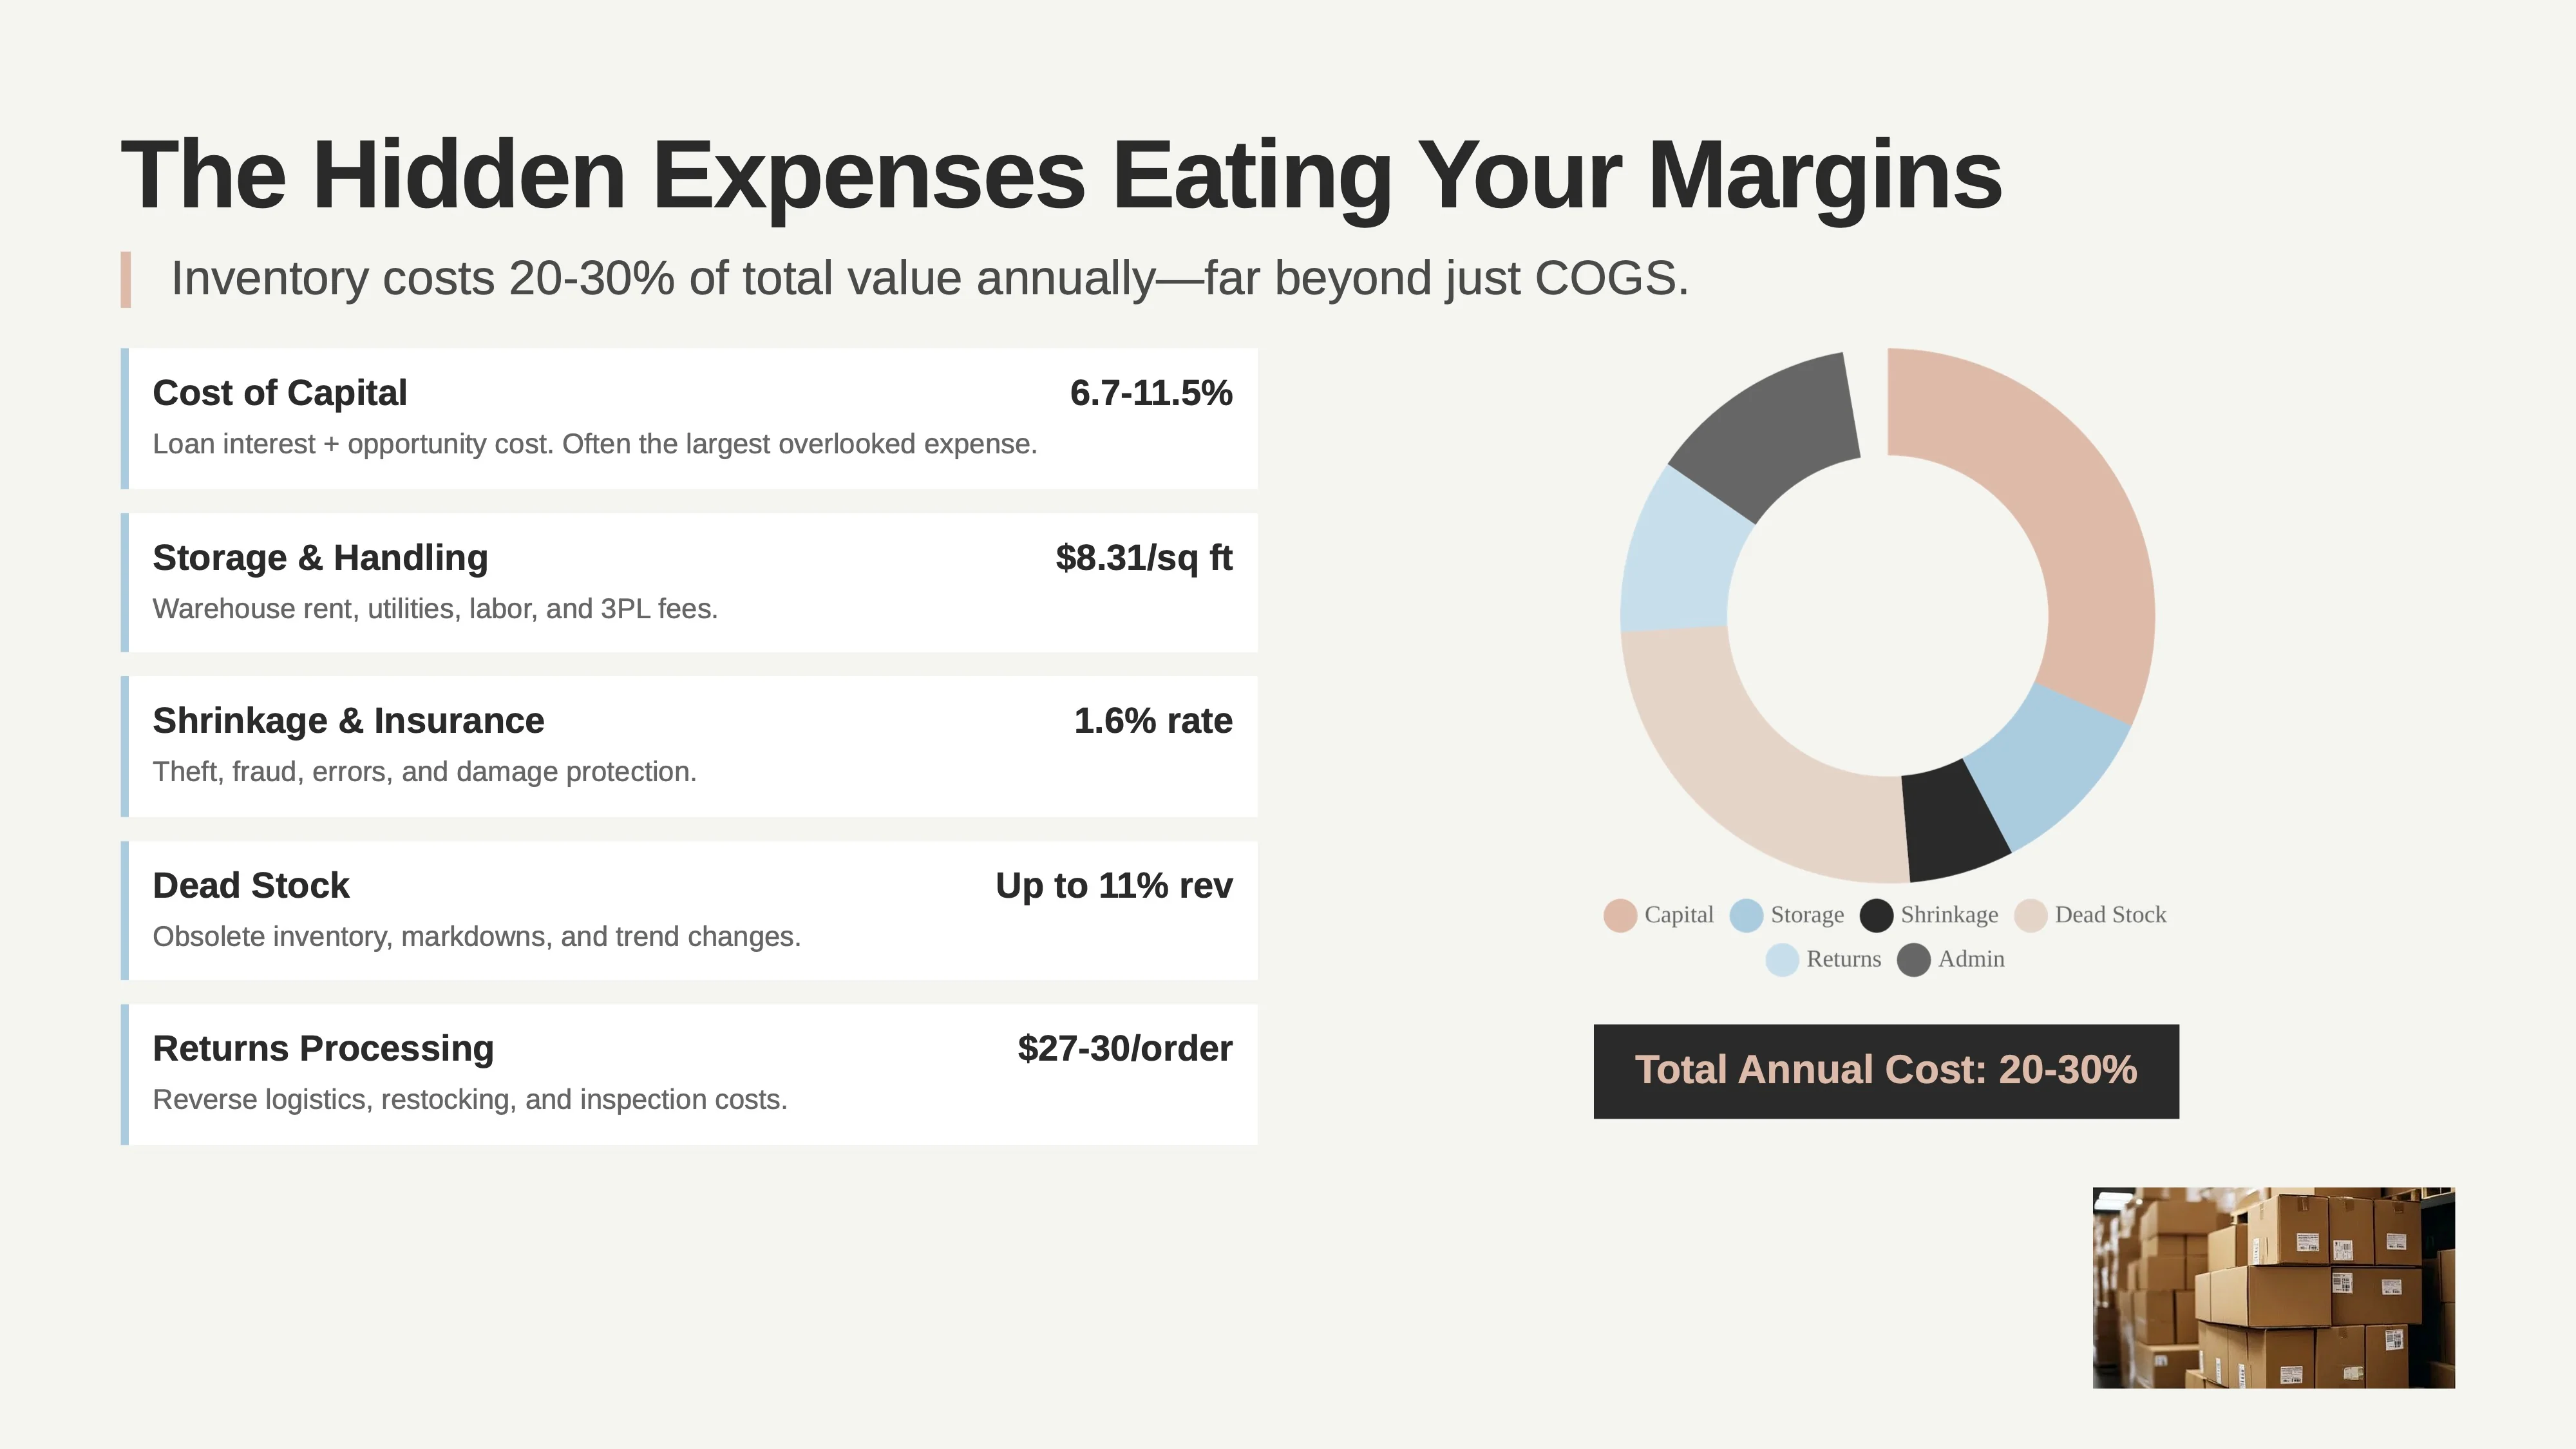
Beyond the initial cost of goods sold (COGS), inventory incurs a wide range of expenses, collectively known as inventory carrying costs or holding costs. These typically represent 20% to 30% of a company’s total inventory value annually [3]. Shopify breaks these costs down into several key components [4]:
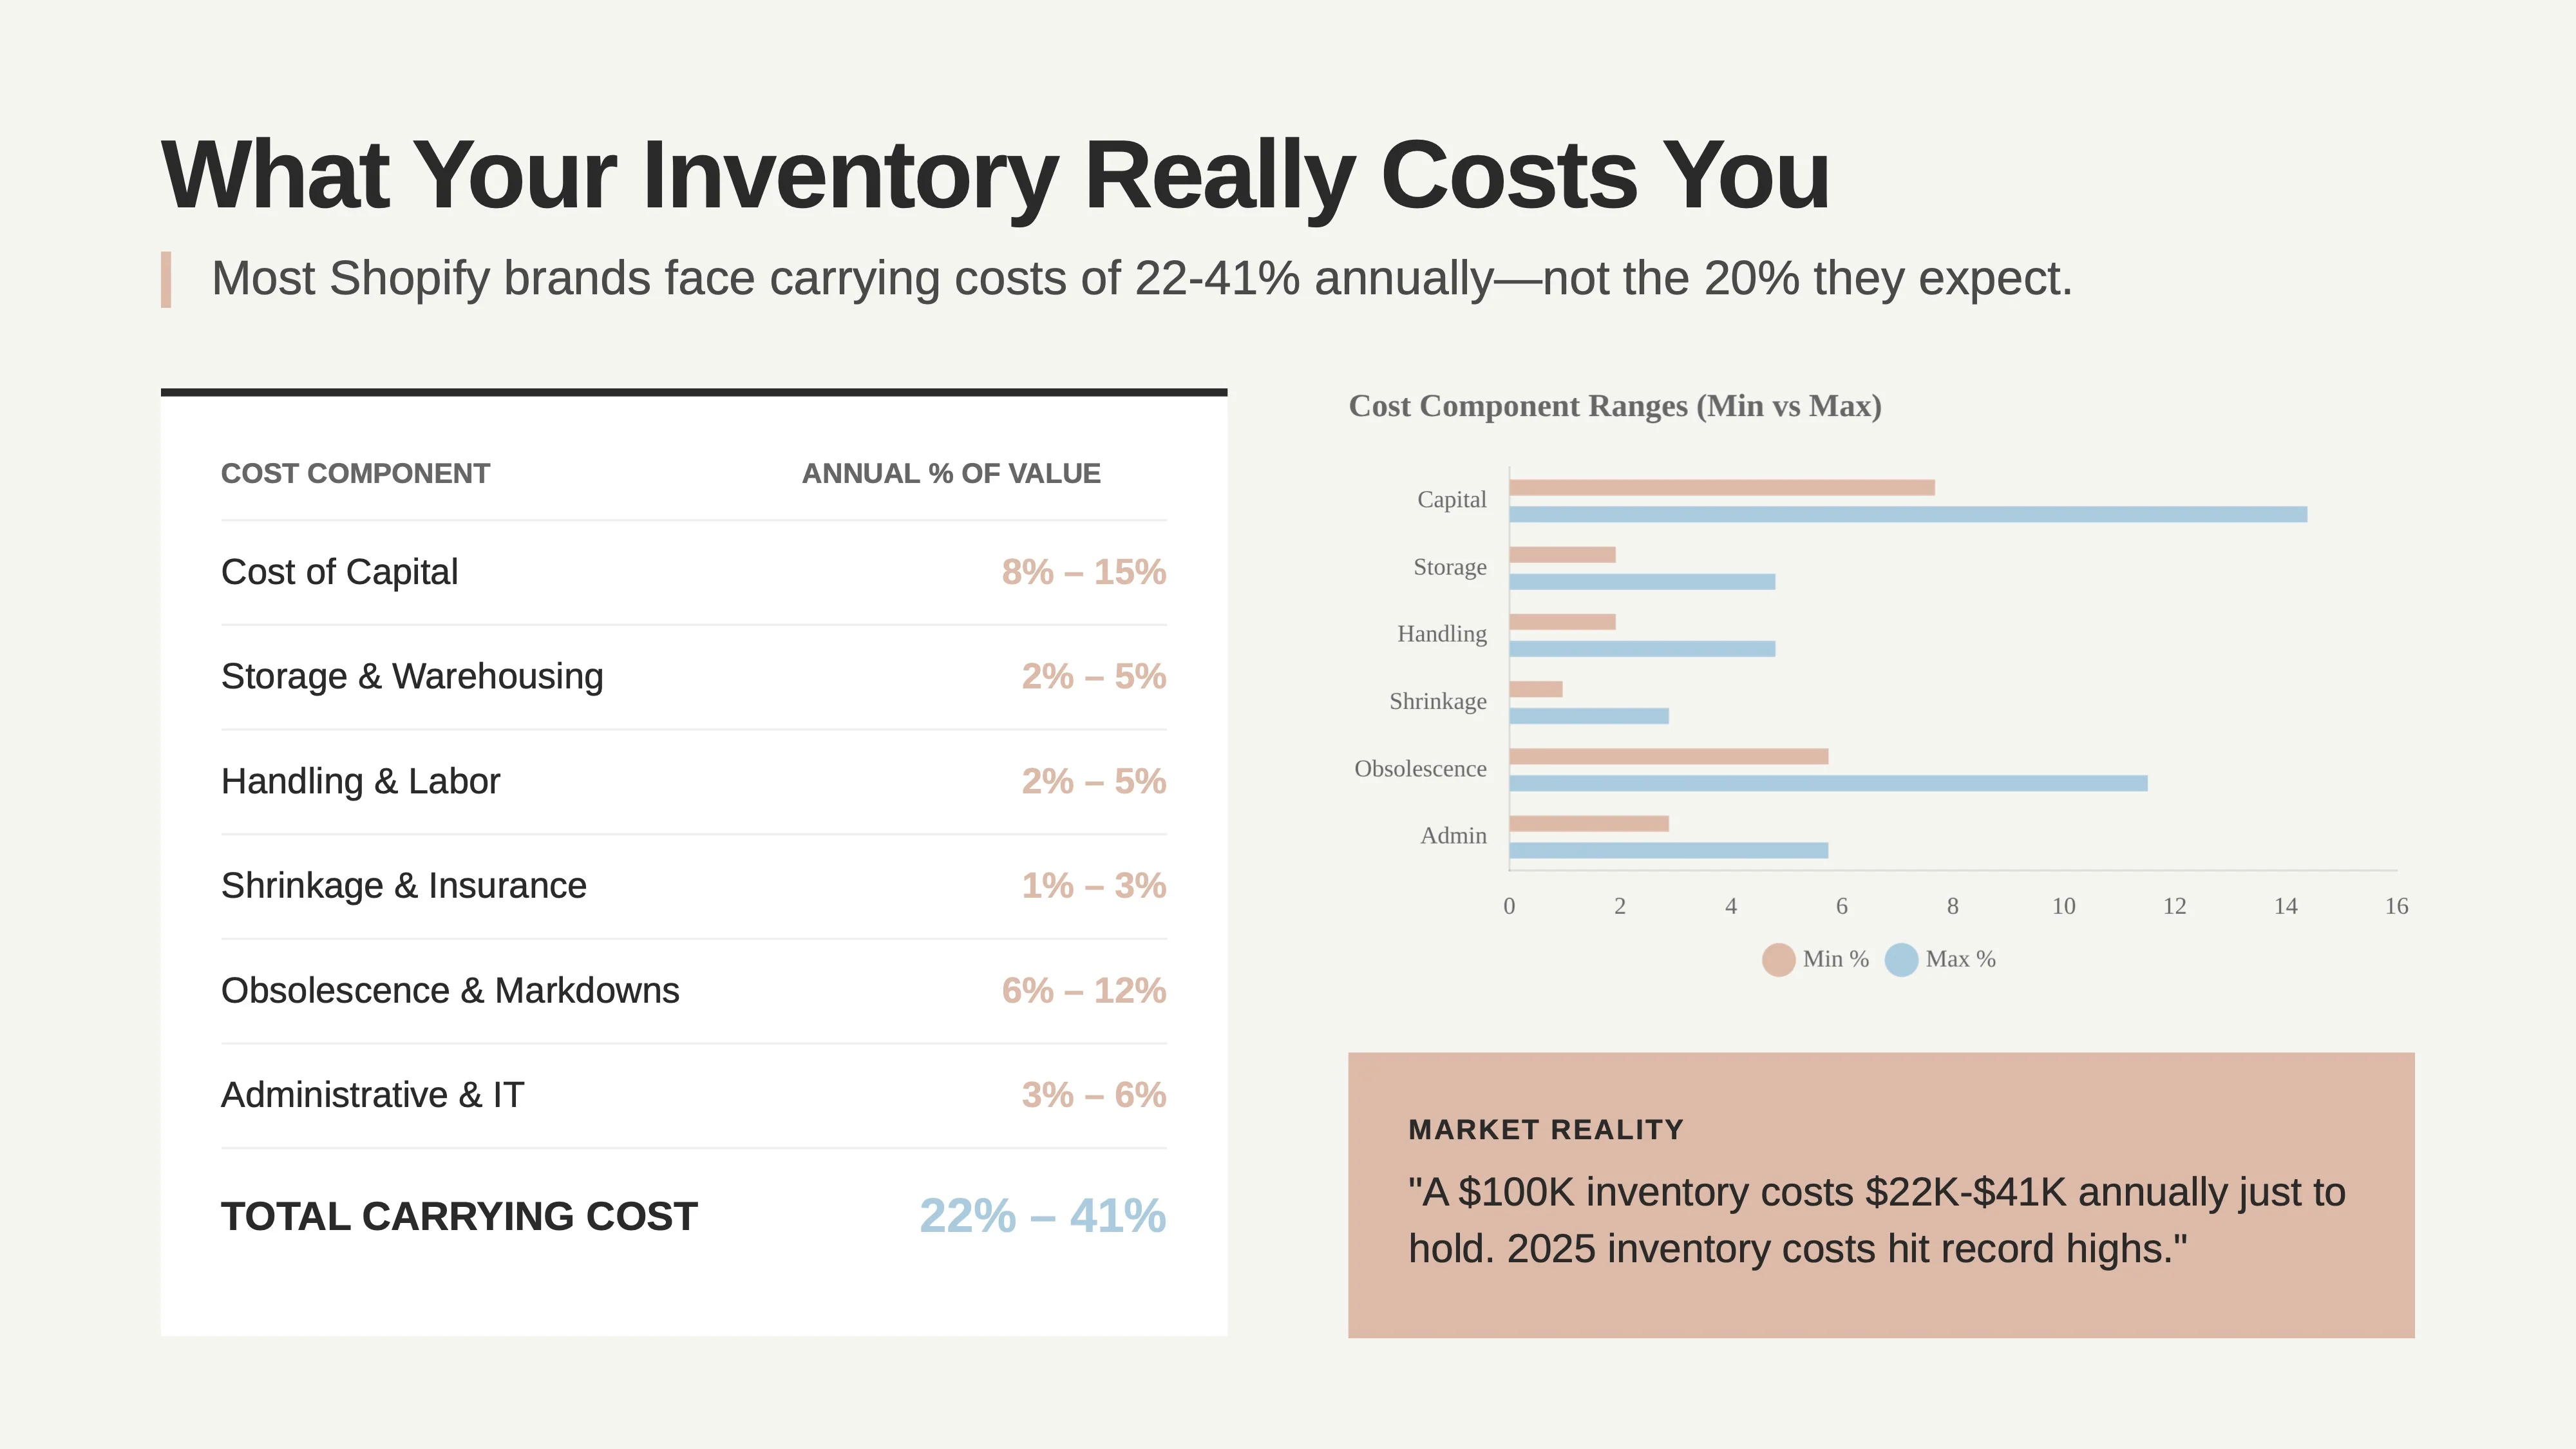
While the 20-30% range is a common benchmark, the true carrying cost for a DTC or Shopify brand is often higher due to several factors. Smaller order volumes, less negotiating power with suppliers, and higher marketing costs all contribute to a more challenging financial environment.
Here is a table summarizing recent benchmark data for the key components of inventory carrying costs:
Benchmark Range (% of Inventory Value)
Source(s)
Cost of Capital
8% – 15%
[5] [13]
Storage & Warehousing
2% – 5%
[14]
Handling & Labor
2% – 5%
[14]
Shrinkage & Insurance
1% – 3%
[7]
Obsolescence & Markdowns
6% – 12%
[14]
Administrative & IT
3% – 6%
[14]
Total Annual Carrying Cost
22% – 41%
(Sum of components)
The Logistics Manager’s Index (LMI) confirms this trend, with inventory costs reaching their highest recorded levels in 2025, signaling a “permanent reset in supply chain economics” [15].
For small but growing Shopify brands, the abstract concept of carrying cost translates into very real operational pain points:
To make this tangible, founders can use a simple formula to estimate their own carrying cost percentage:
Carrying Cost % = (Total Annual Holding Costs / Average Annual Inventory Value) x 100
Here is a step-by-step worksheet to calculate your total holding costs:
Your Annual Cost ($)
Notes & Assumptions
1. Capital Costs
(Your Loan Interest Rate or a 10% Opportunity Cost) x Avg. Inventory Value
2. Storage Costs
3PL Fees, Warehouse Rent, Utilities
3. Handling Costs
Labor for Receiving, Pick/Pack, etc.
4. Insurance & Taxes
Annual Premiums, Property Taxes
5. Shrinkage & Damage
(Avg. Shrink Rate of 1.6%) x Total Inventory Value [7]
6. Obsolescence/Markdowns
Cost of Dead Stock + Discounts Taken
7. Returns Processing
(Number of Returns x ~$28/return) [12]
Total Holding Costs
= SUM(1-7)
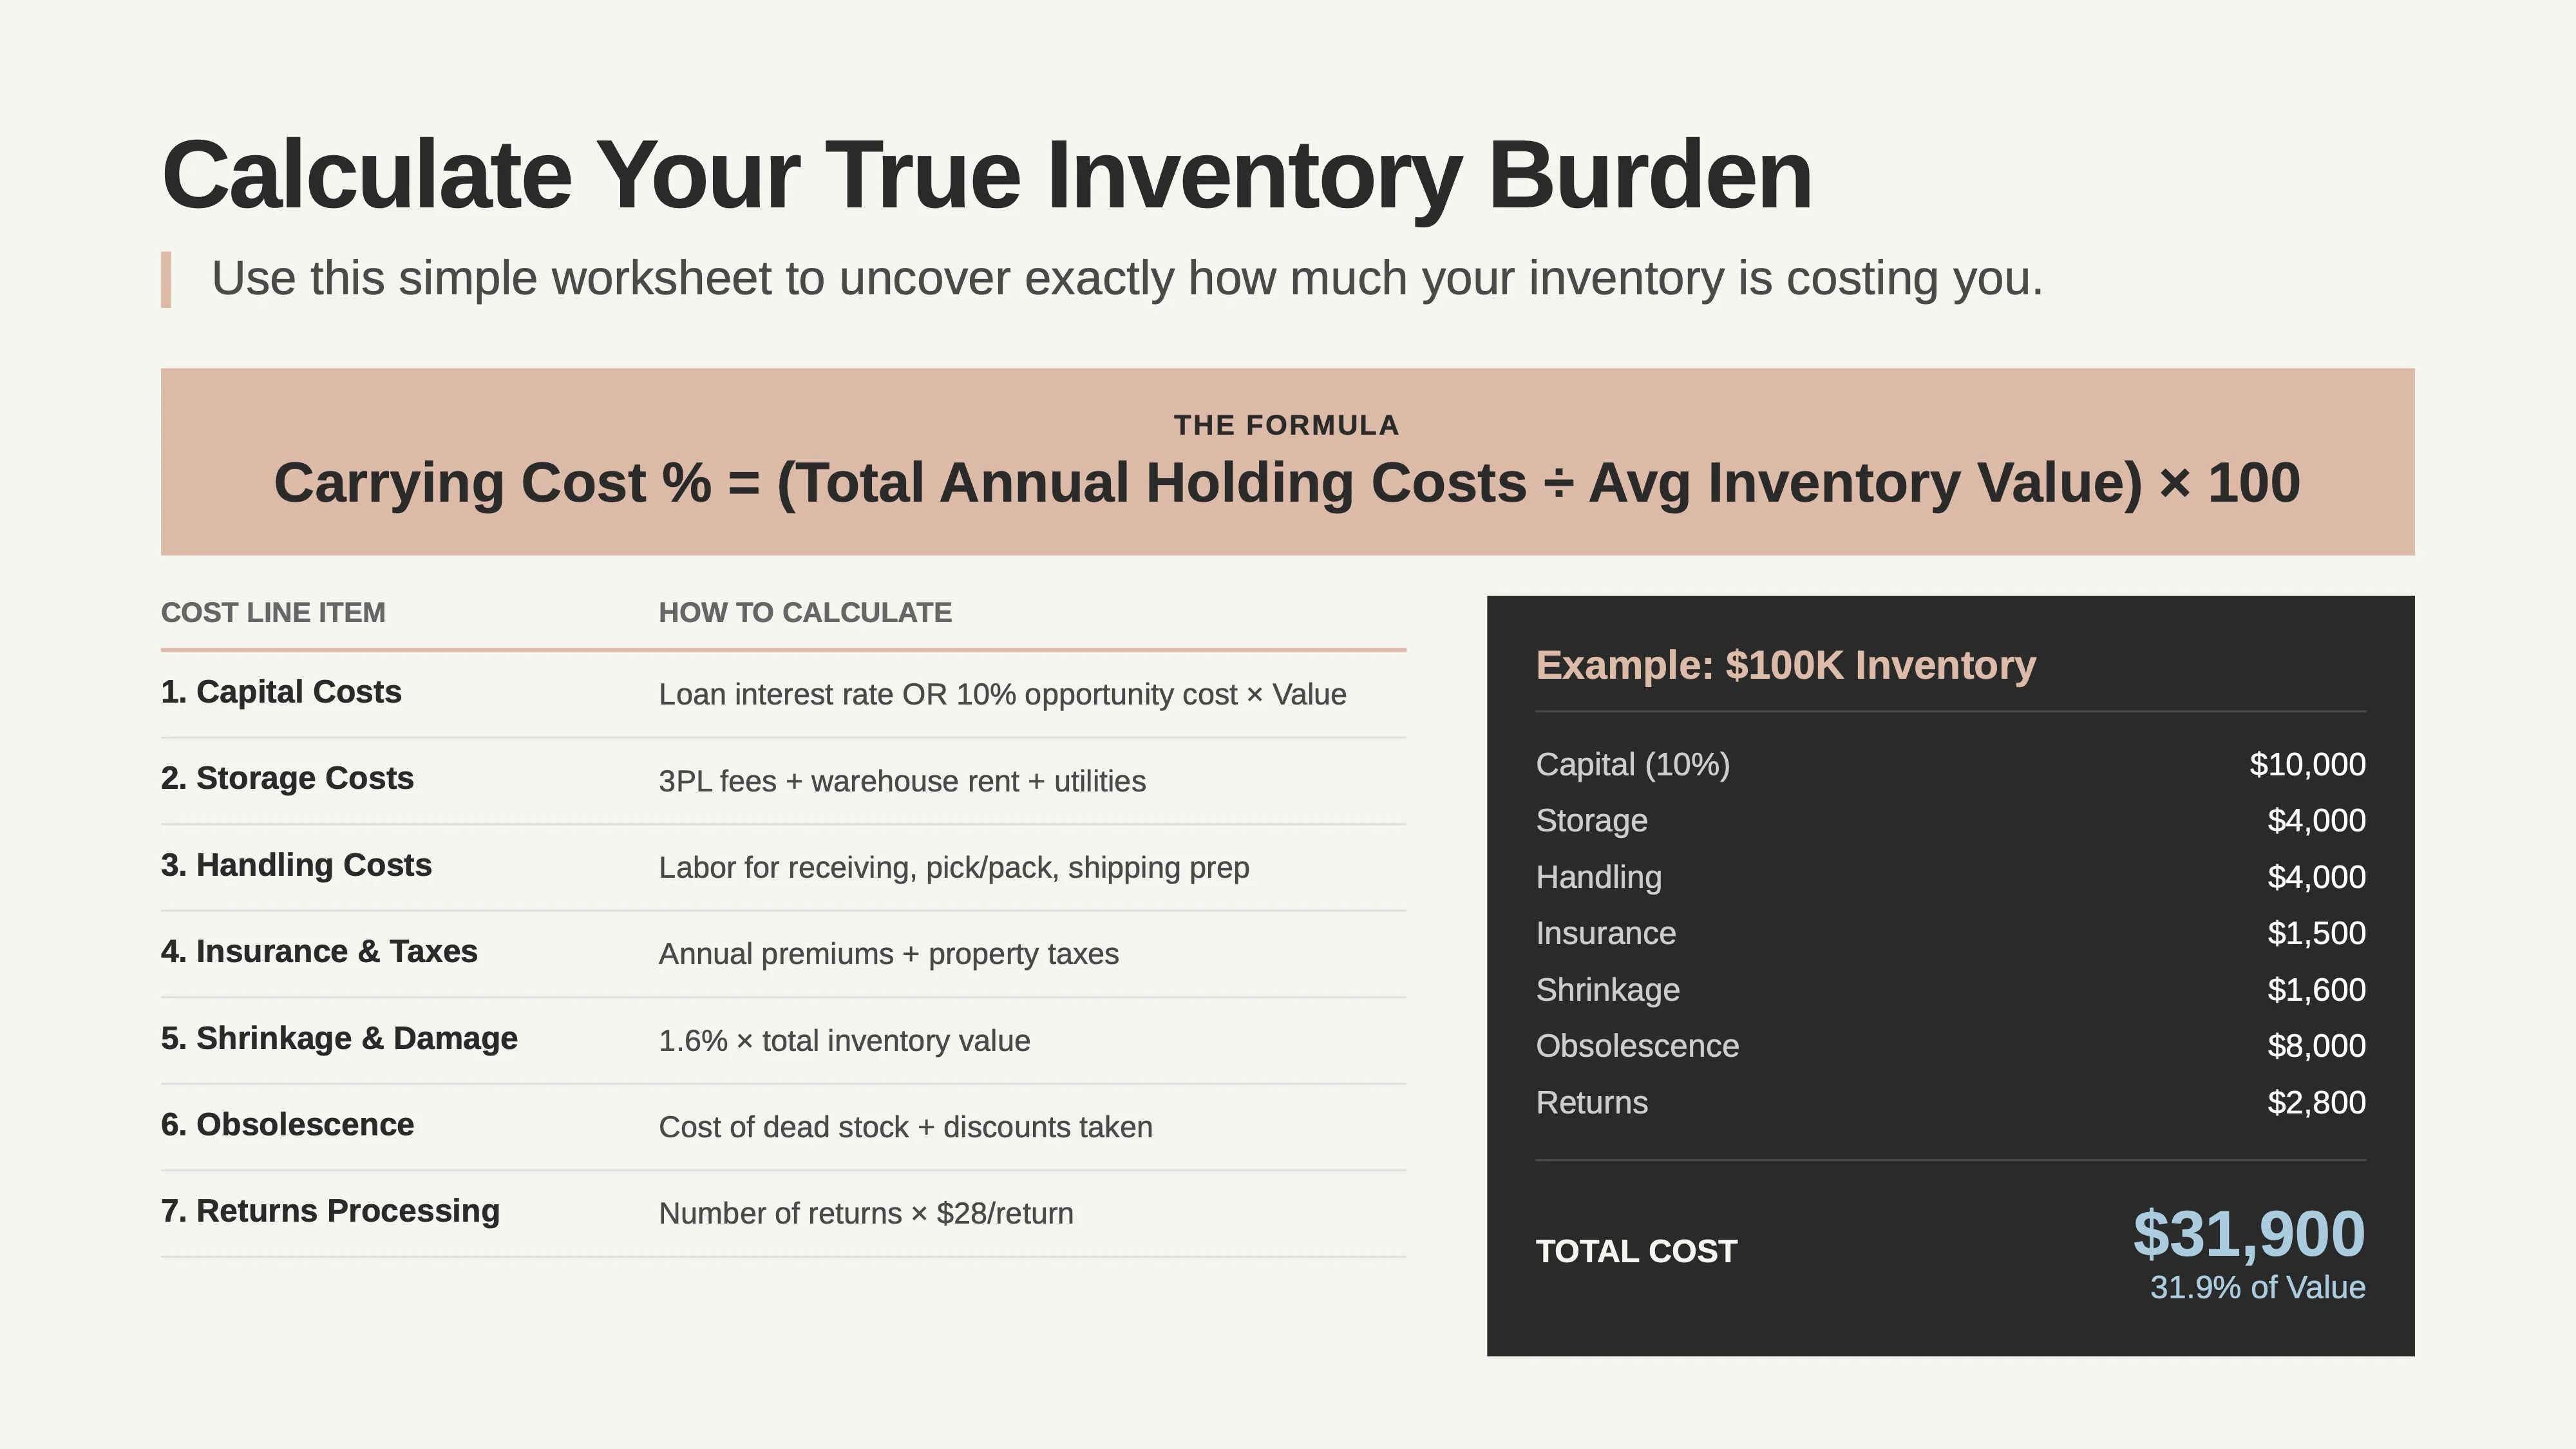
Worked Example: A Shopify store with an average inventory value of $100,000 might have the following costs:
In this scenario, the brand’s inventory carrying cost is 31.9% ($31,900 / $100,000), meaning it costs them nearly a third of their inventory’s value just to hold it for a year.
Reducing carrying costs is about making smarter, more disciplined inventory decisions. Here are 10 actionable tactics for Shopify merchants:
1. Demand Validation Before Buys:
2. Pre-Orders with Clear ETA Policies:
3. Start with Micro-Batches:
4. ABC Analysis & SKU Pruning:
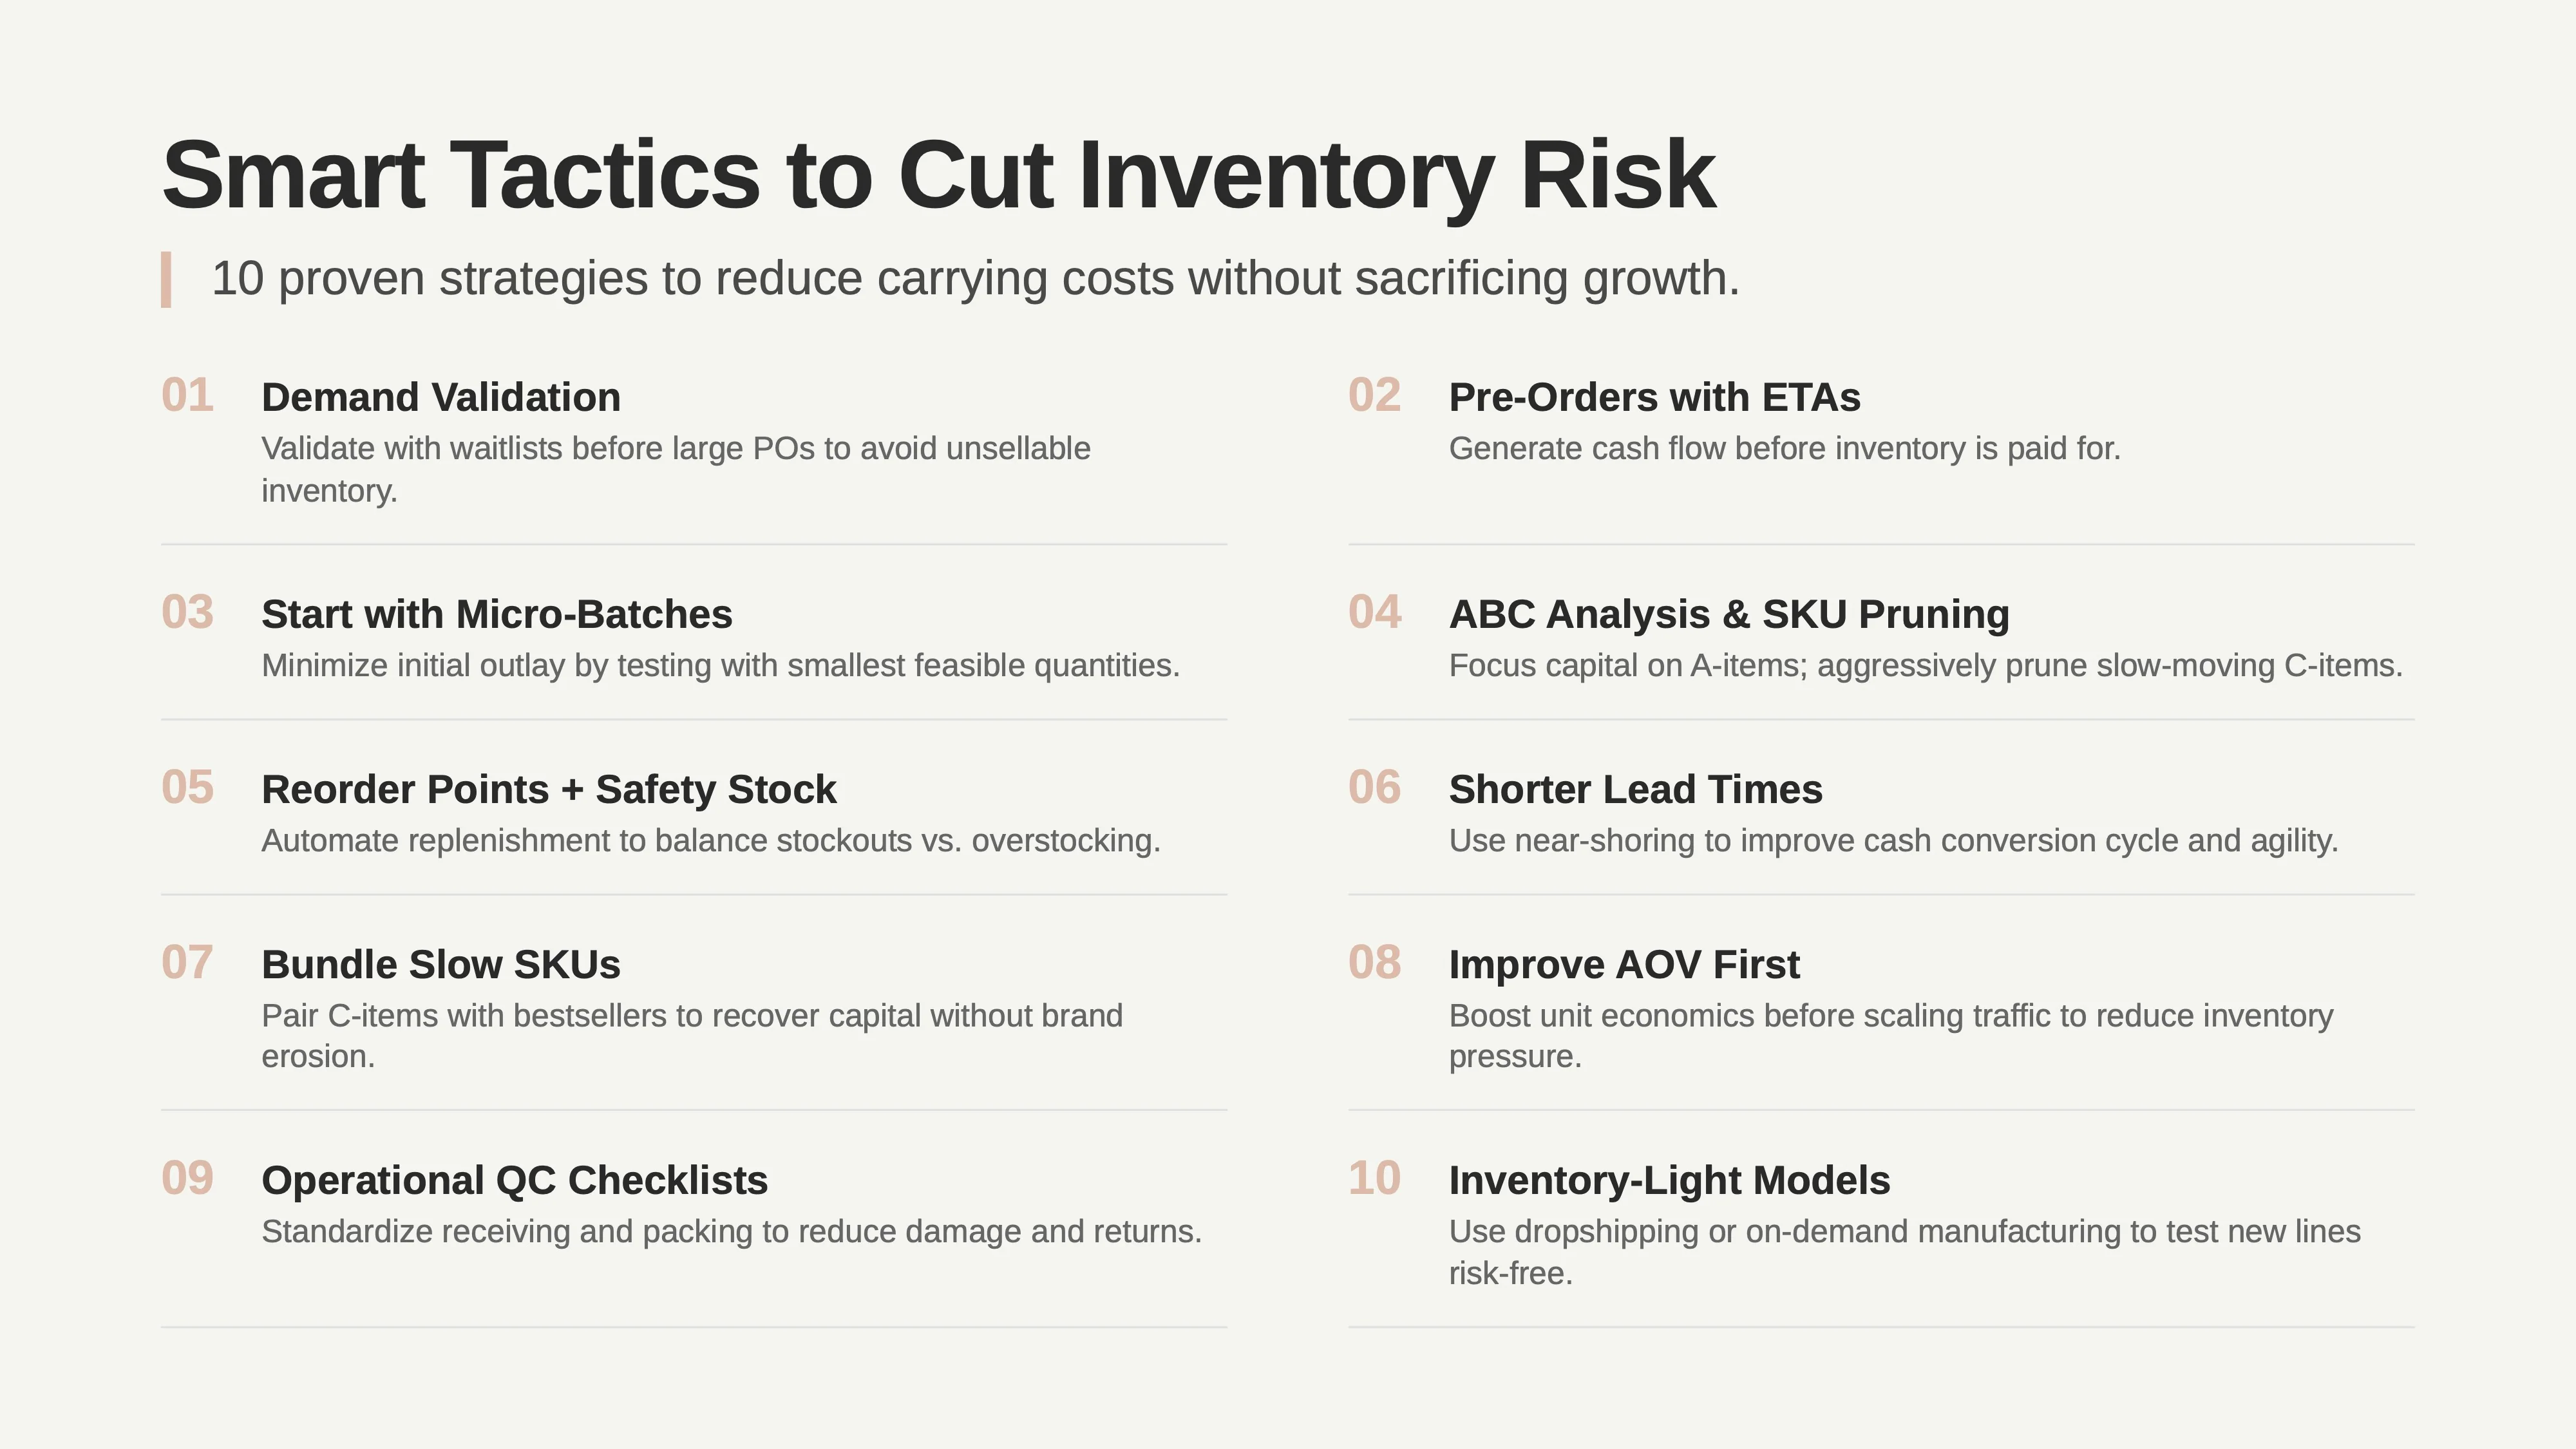
5. Reorder Points & Safety Stock Discipline:
6. Shorter Lead Times / Diversified Suppliers:
7. Bundle to Move Slow SKUs:
8. Improve AOV Before Scaling Traffic:
9. Operational QC Checklists:
10. Inventory-Light Fulfillment Models:
Despite the costs, holding inventory is often a strategic necessity. Use this framework to decide when it’s worth the risk:
Score (1-5)
Rationale
Margin & Contribution
5: High margin (>60%), covers all variable costs easily. 1: Low margin (<30%), barely profitable.
Demand Stability
5: Proven seller, stable demand, low forecast error. 1: New product, volatile demand, high forecast error.
Lead Time & MOQ
5: Short lead time (<30 days), low MOQ. 1: Long lead time (>90 days), high MOQ.
Quality/Brand Control
5: Requires custom packaging/QC that only you can provide. 1: Standardized product, no special handling needed.
Cash Runway
5: >12 months of cash runway. 1: <3 months of cash runway.
Total Score
= SUM
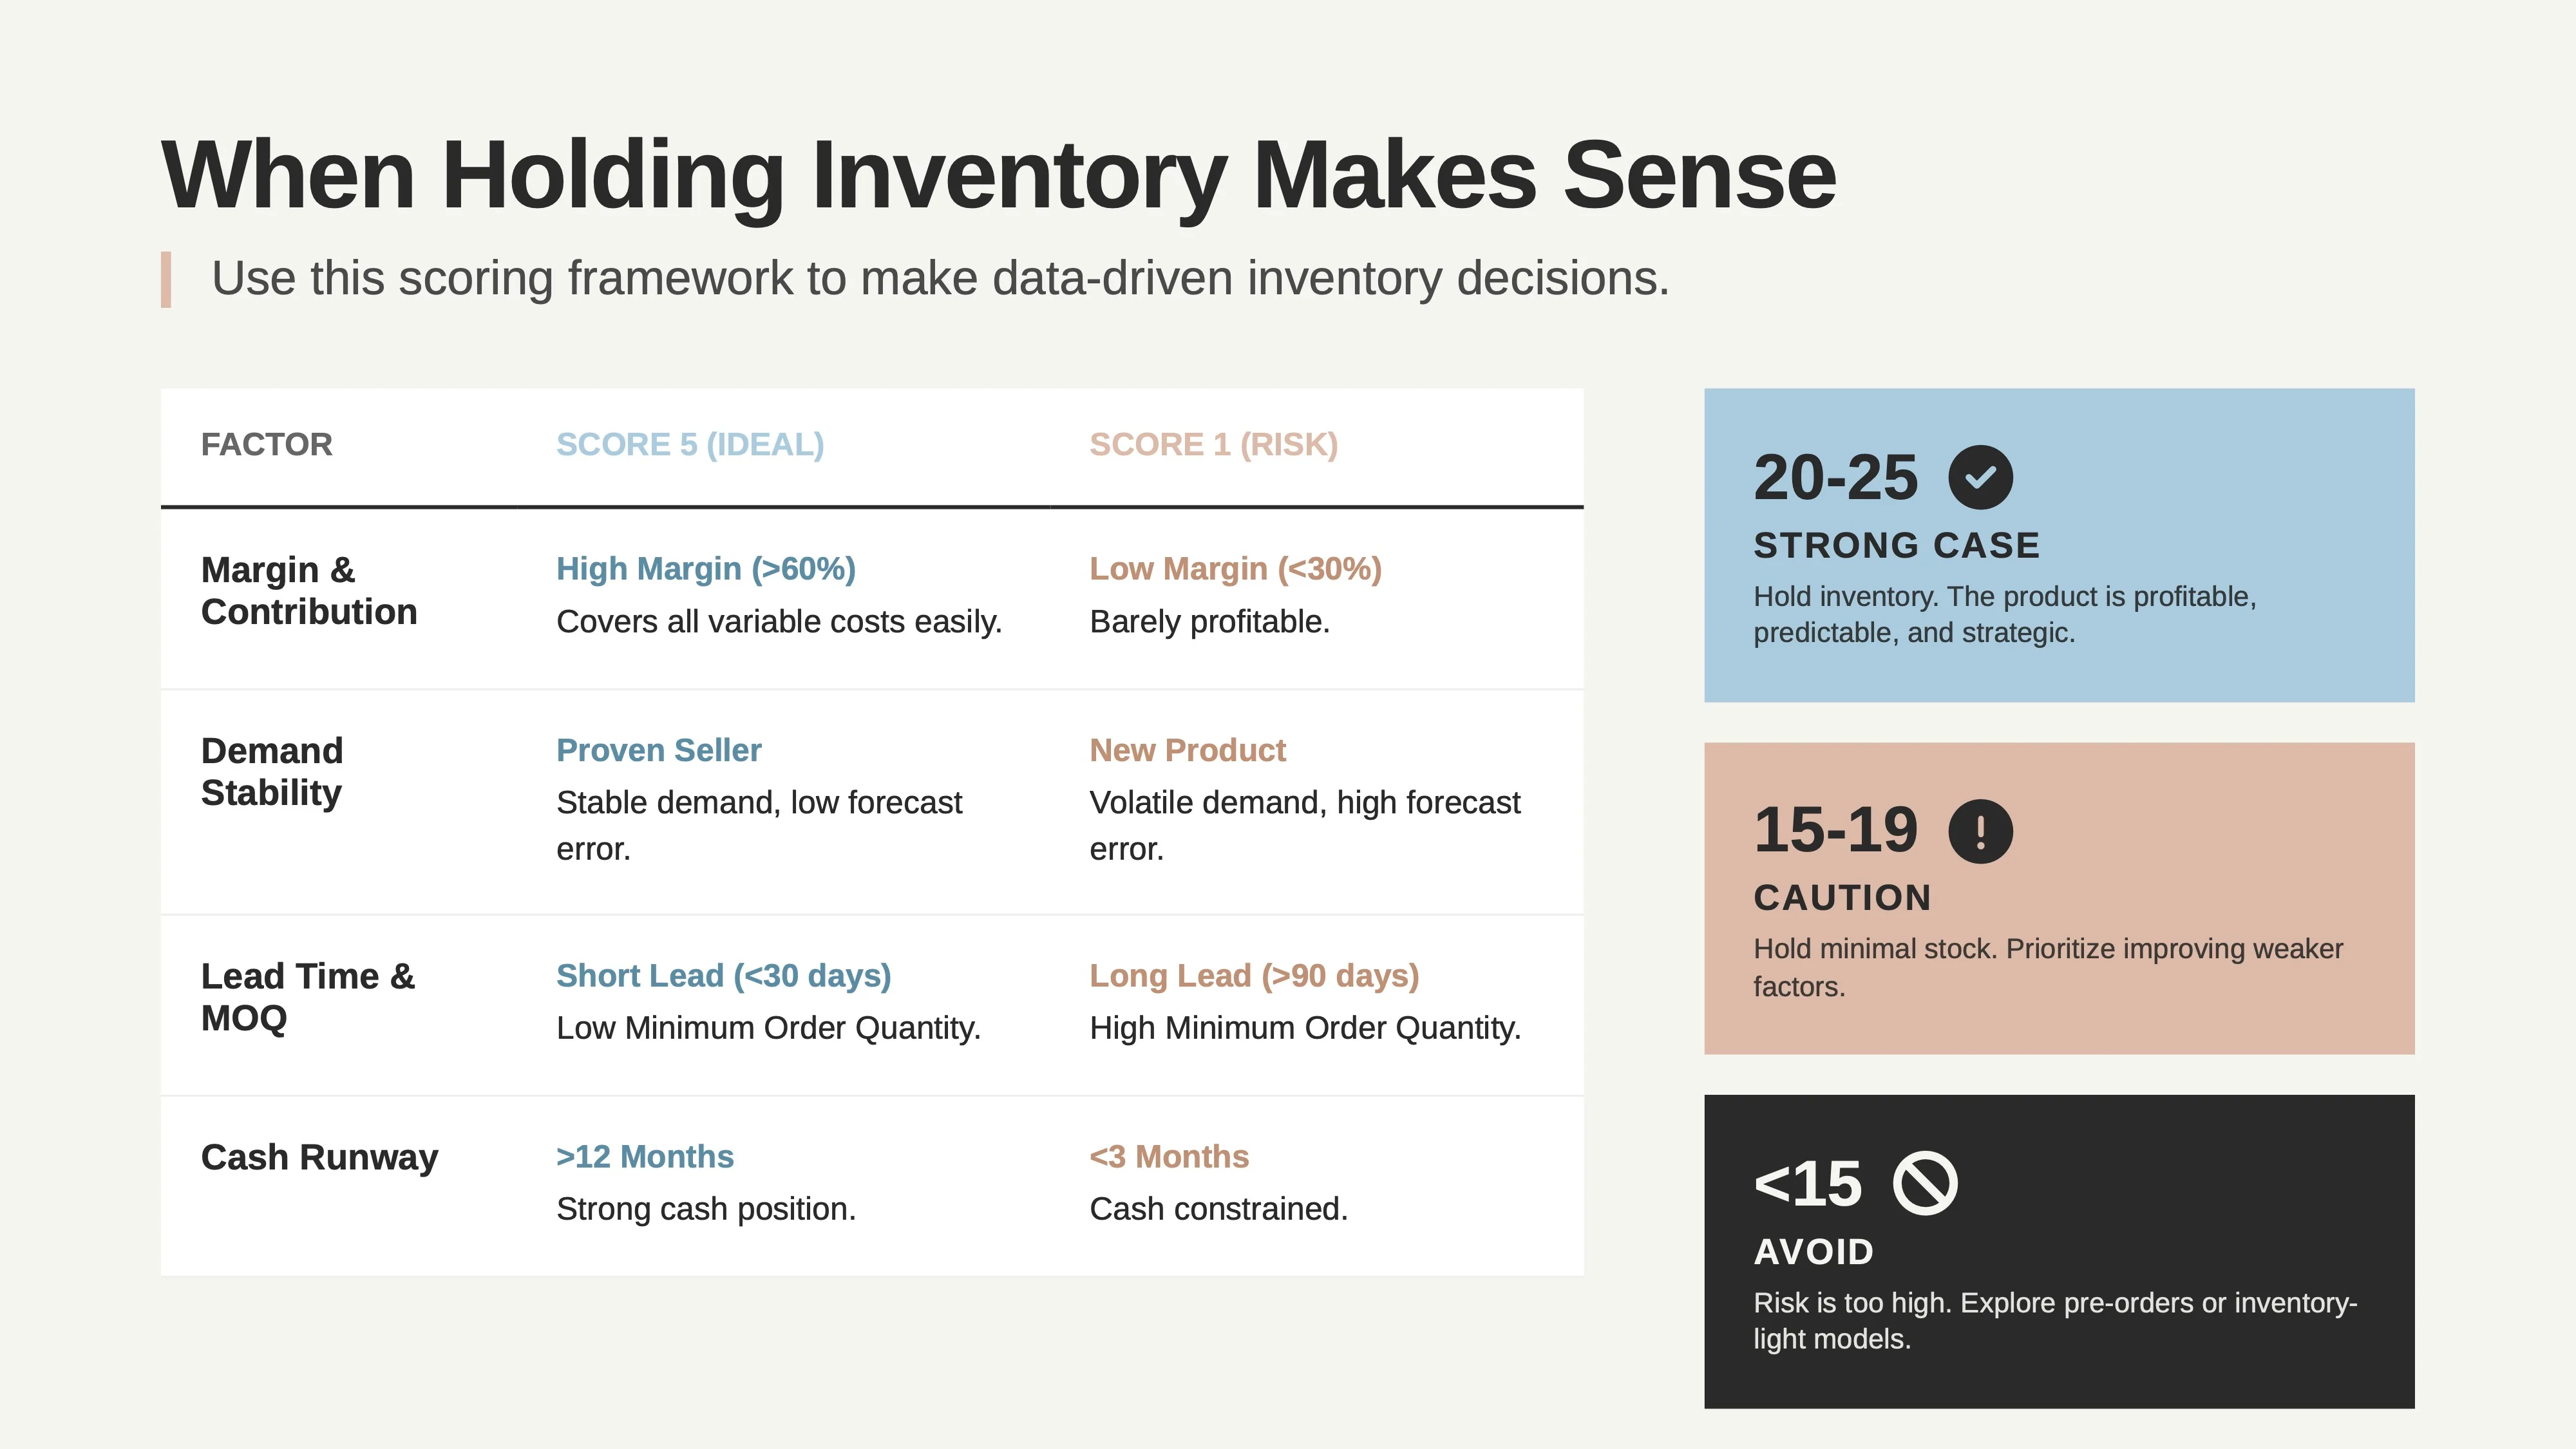
Scoring Guide:
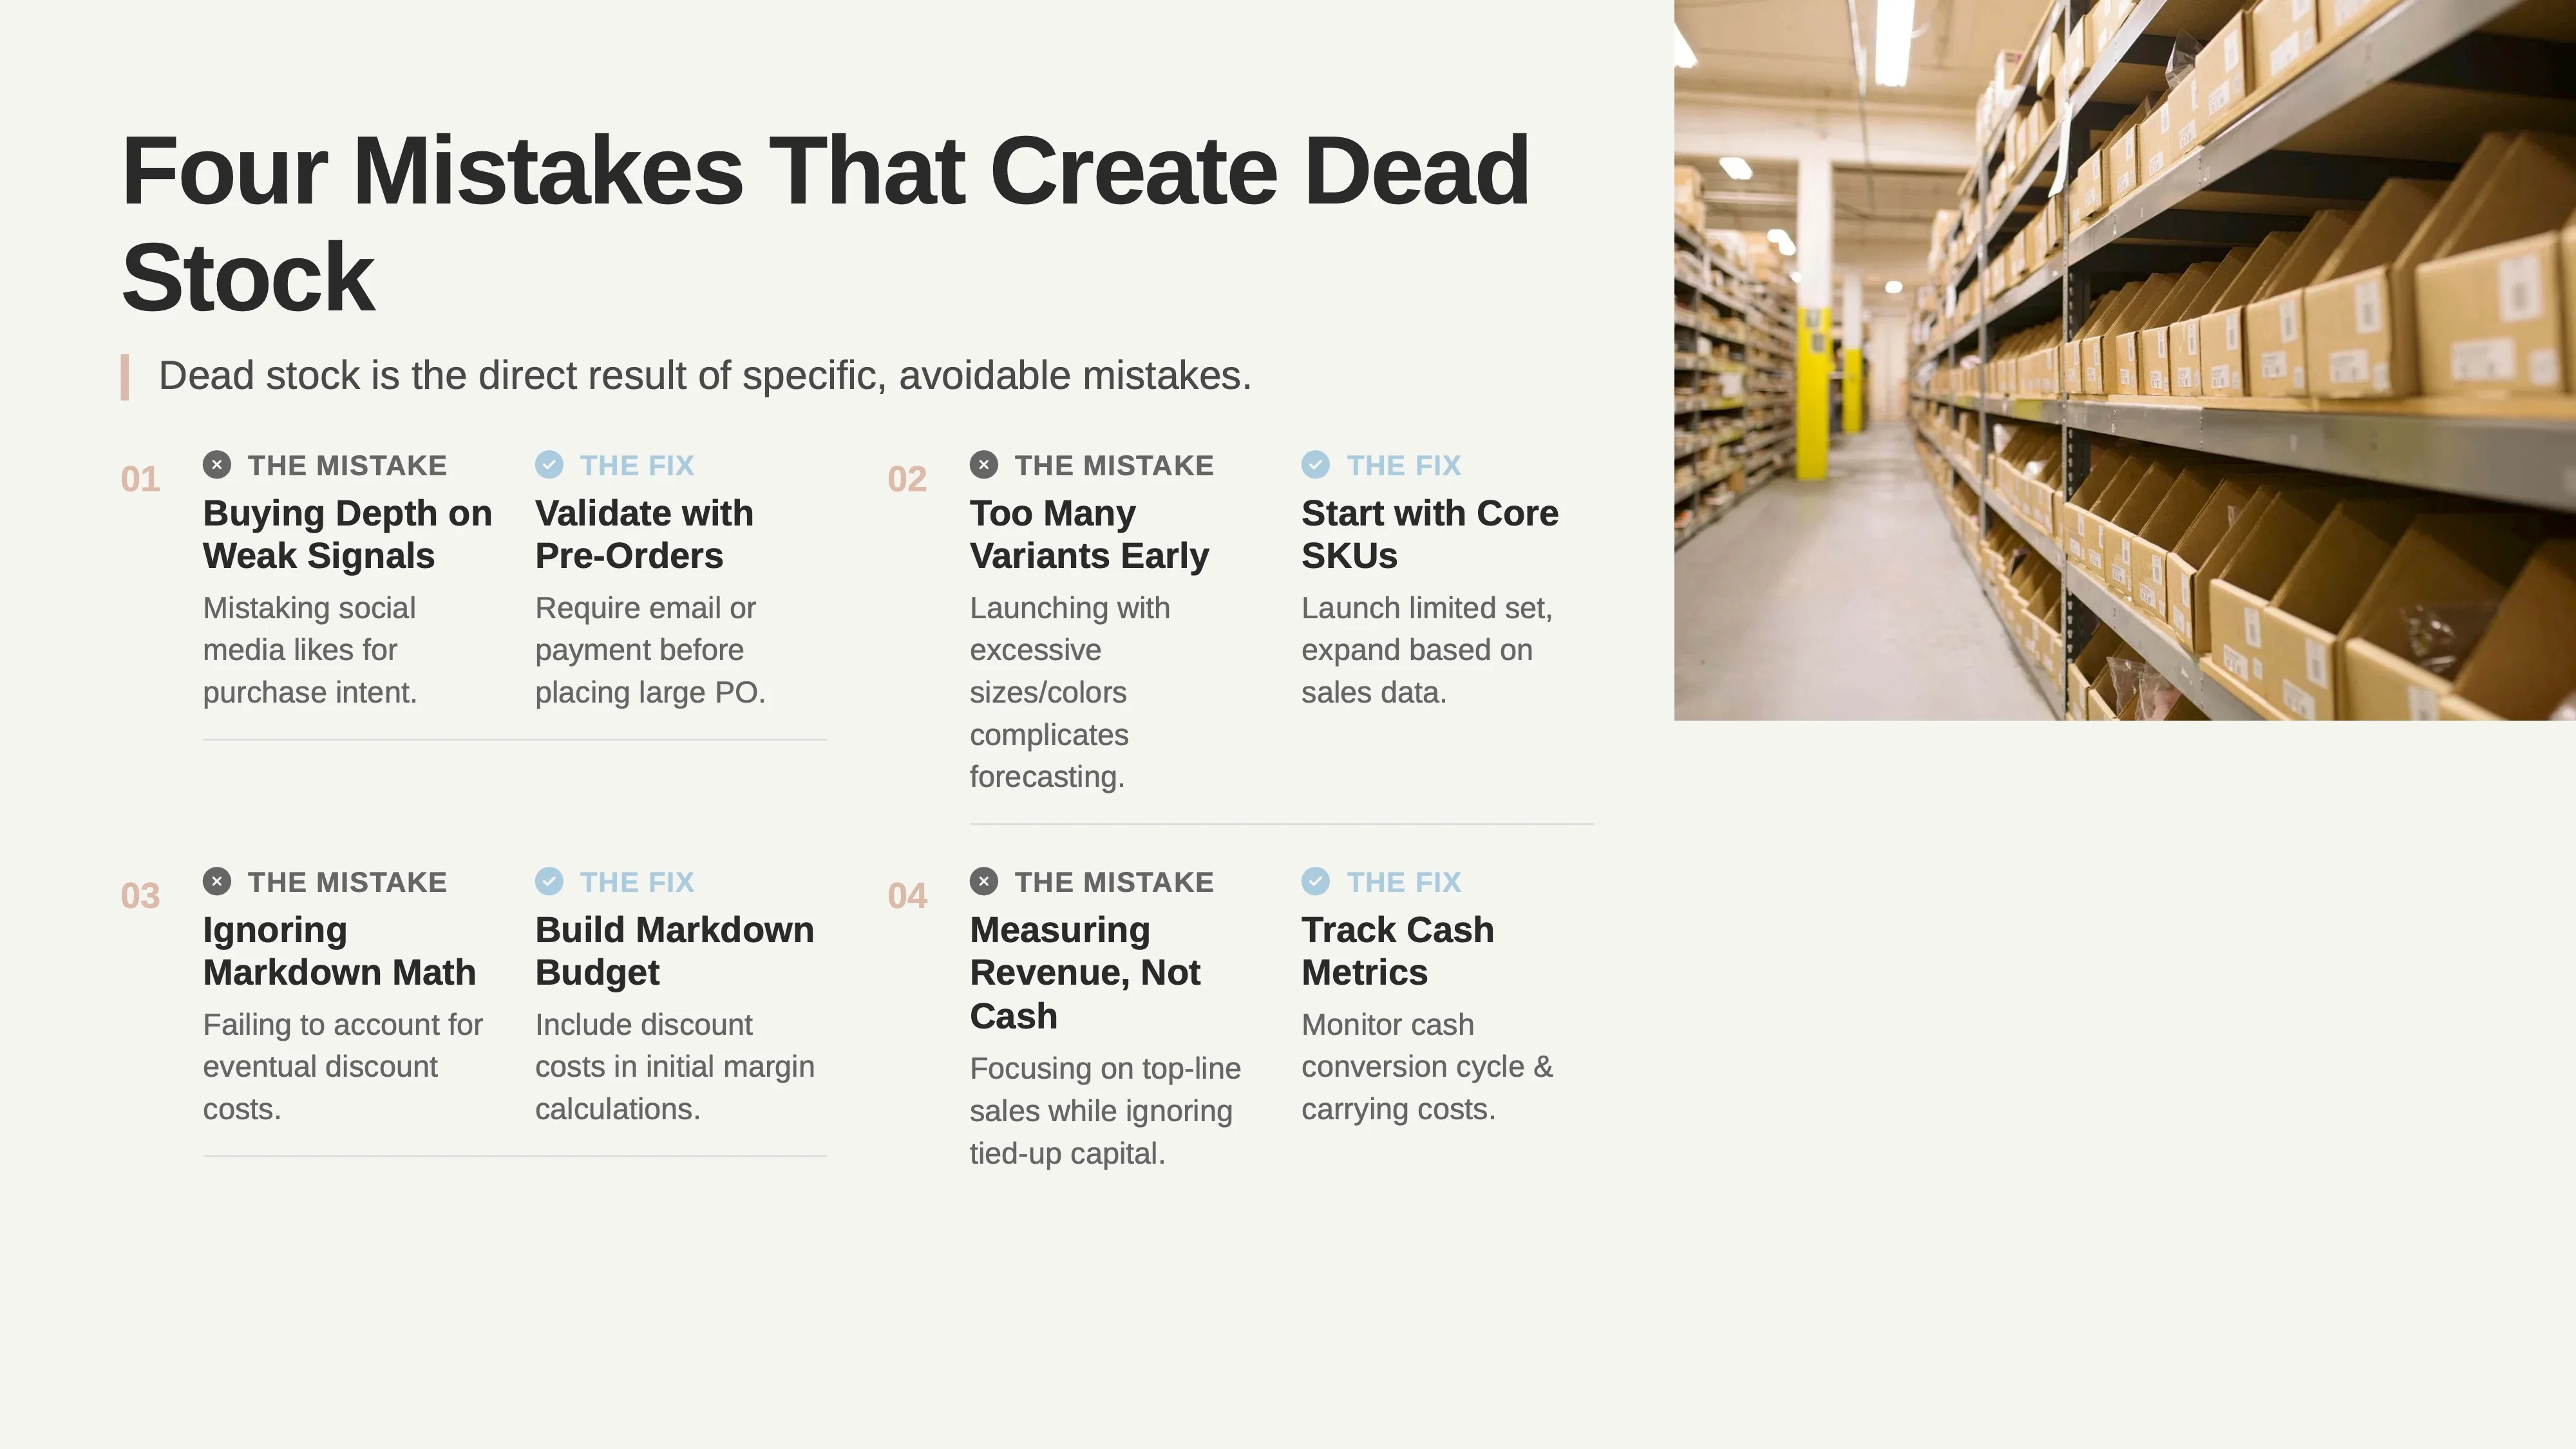
Dead stock is the direct result of specific, avoidable mistakes:
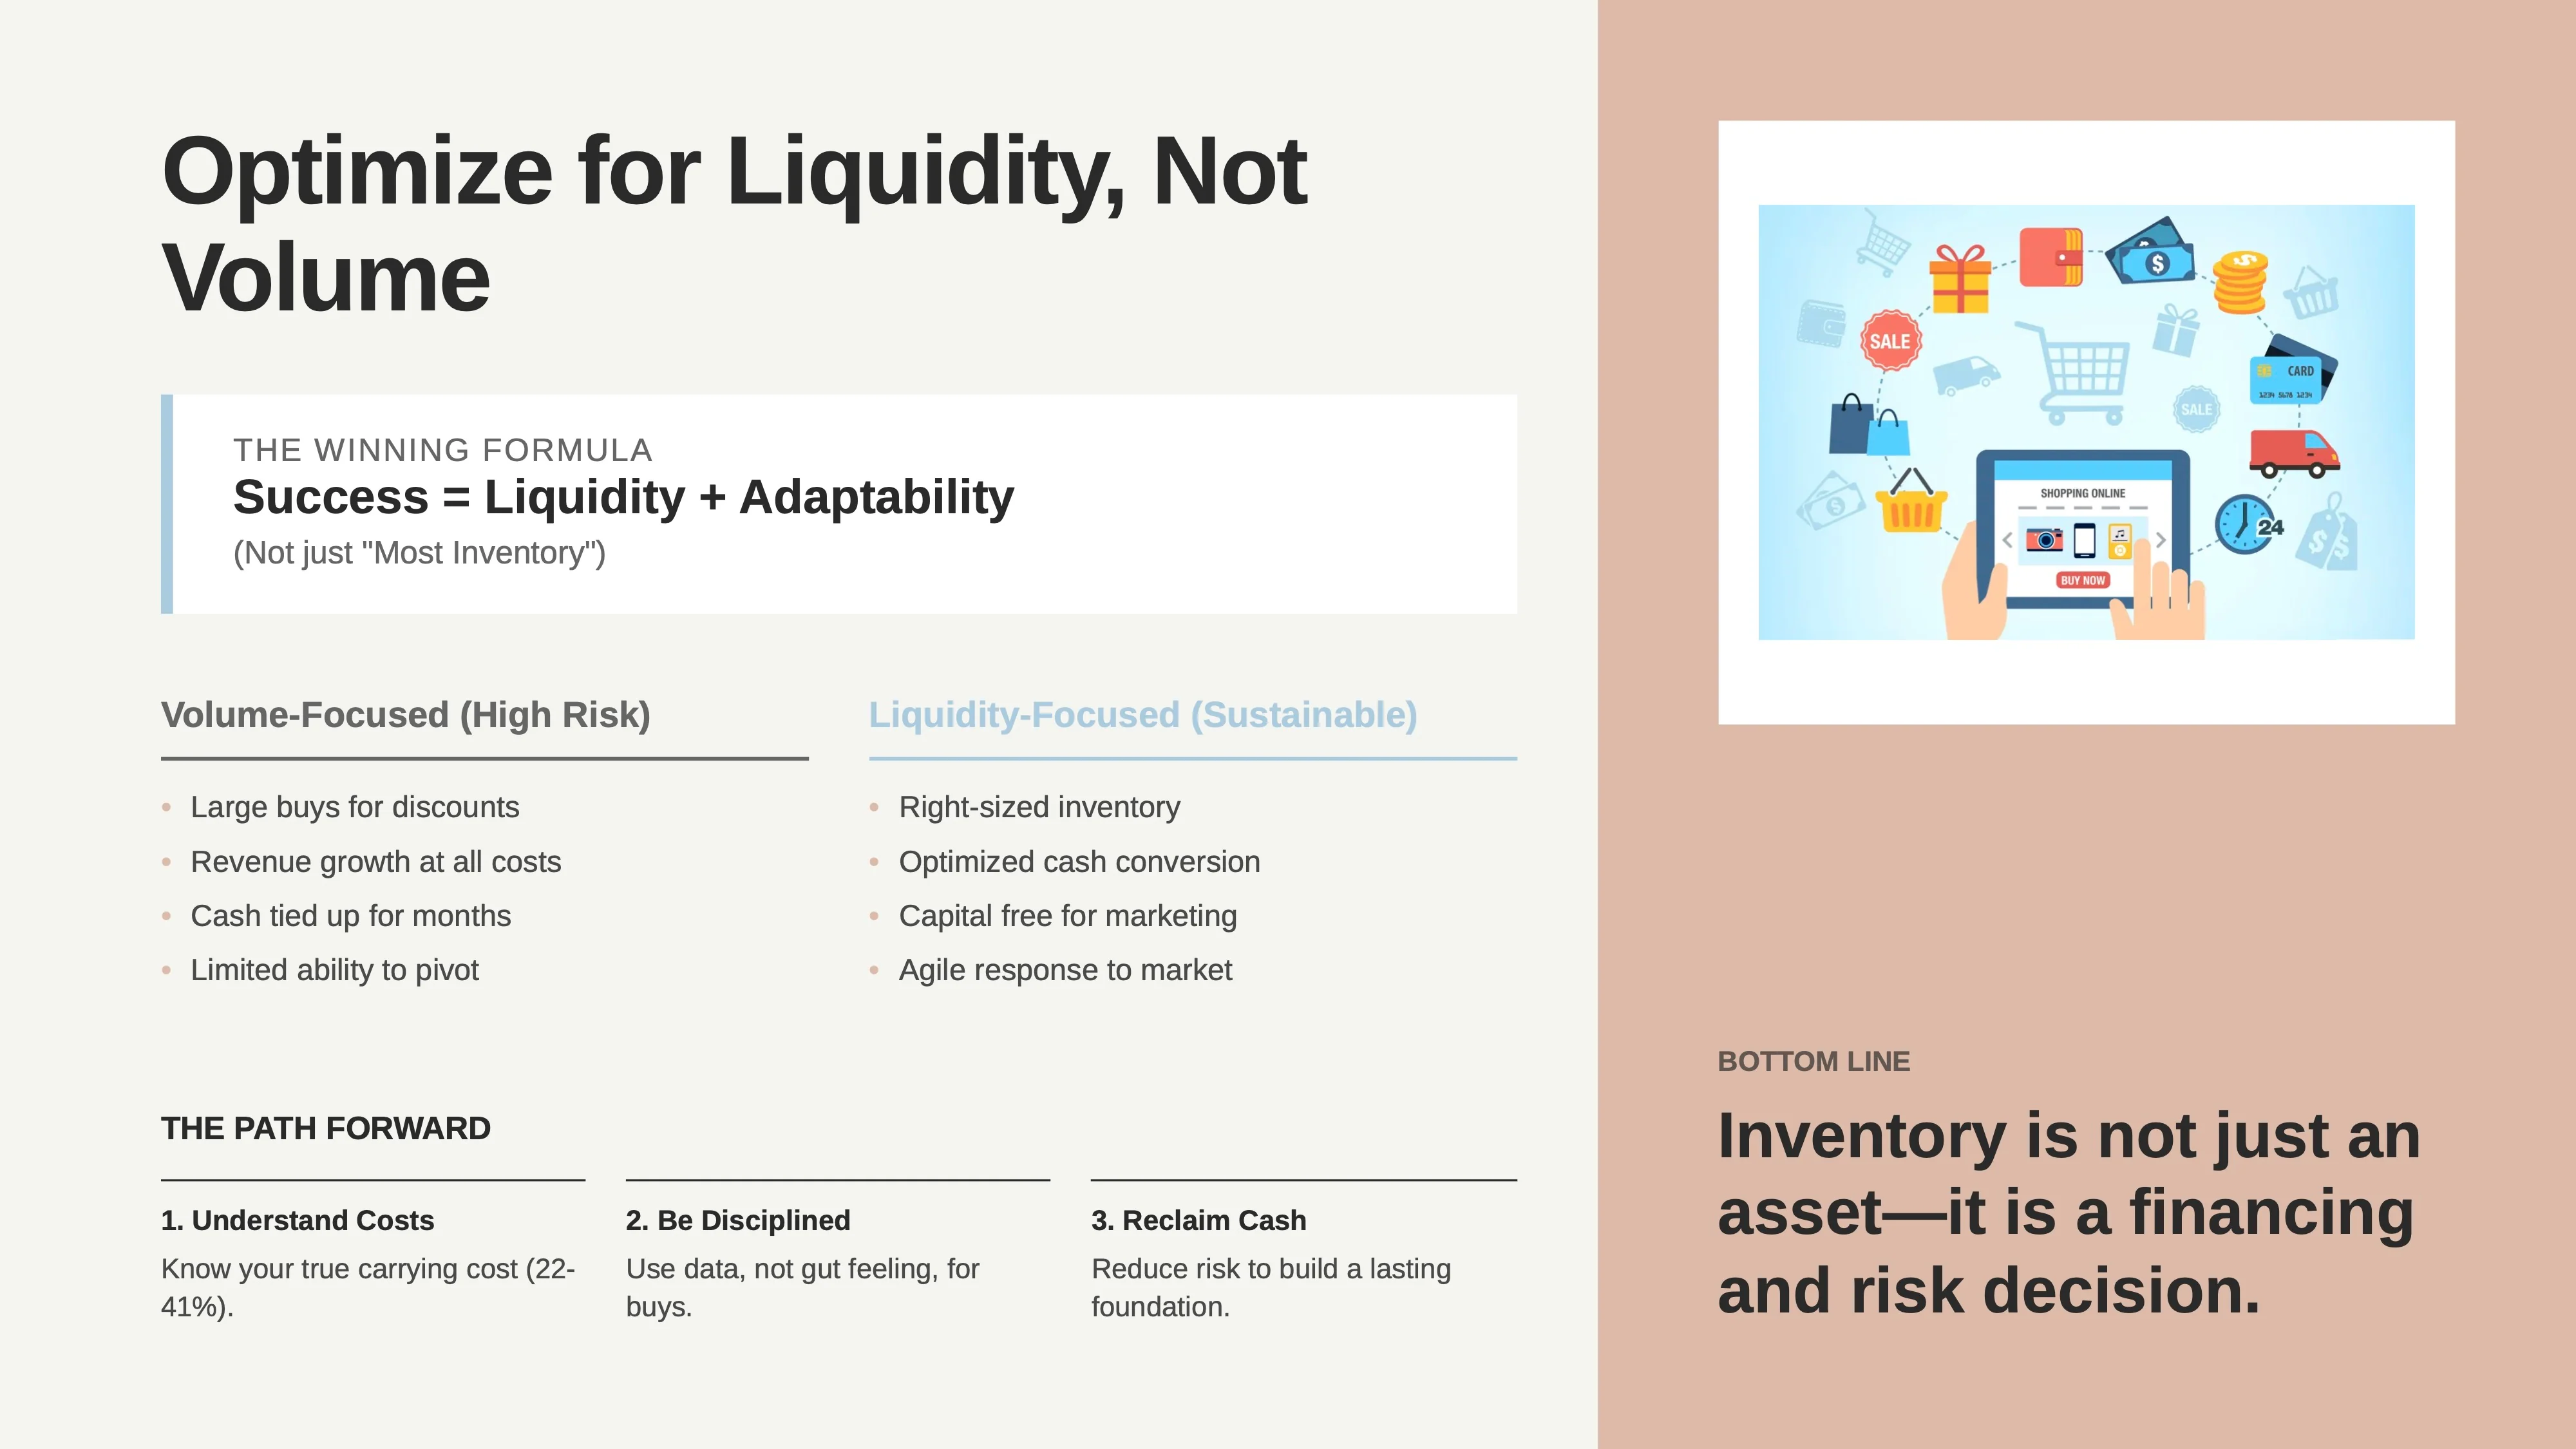
Inventory is not just a line item on a balance sheet; it is a direct reflection of a brand’s financing and risk decisions. The most successful Shopify brands are not necessarily those with the most inventory, but those that optimize for liquidity and adaptability. By understanding the true cost of holding inventory and implementing disciplined, data-driven strategies to manage it, founders can reclaim their cash flow, reduce operational risk, and build a more sustainable foundation for long-term growth.
1. What is the formula for calculating inventory carrying cost?
To calculate your specific carrying cost percentage, use this formula:
(Total Annual Holding Costs / Average Annual Inventory Value) x 100
Your total holding costs should include capital costs (loan interest or opportunity cost), storage fees, insurance, taxes, shrinkage (theft/damage), and obsolescence. While many businesses only look at the cost of the product itself, the carrying cost reveals the "hidden" expenses of keeping that product on the shelf.
2. What is a typical inventory carrying cost benchmark for ecommerce brands?
Historically, the standard benchmark for carrying costs is 20% to 30% of total inventory value per year. However, recent data for 2024–2026 suggests that for direct-to-consumer (DTC) and Shopify brands, the real cost is often higher, ranging from 22% to 41%. This increase is driven by rising interest rates (cost of capital), higher warehousing fees, and increased marketing costs that make capital efficiency more critical.
3. How does excess inventory negatively impact cash flow?
Excess inventory creates a "cash trap" by lengthening your Cash Conversion Cycle (CCC). Every dollar tied up in slow-moving stock is a dollar that cannot be used for customer acquisition, R&D, or emergency expenses. Even if a business appears profitable on paper, it can fail if it lacks the liquid cash required to pay operational bills because its capital is locked in unsold goods.
4. What are the best strategies to reduce inventory holding costs?
The most effective way to lower holding costs is to improve inventory turnover and reduce risk before buying. Key strategies include:
5. What is dead stock and how much does it cost a business?
Dead stock refers to inventory that has become unsellable due to obsolescence, seasonality, or lack of demand. It is one of the most expensive forms of inventory, potentially costing businesses up to 11% of their revenue. Beyond the lost sales revenue, the carrying cost just to hold onto dead stock can reach 15–30% of its value annually due to storage fees and depreciation.
[1] Shopify. (2025, October 16). Cash Flow Problems: Common Issues & How To Avoid Them. https://www.shopify.com/blog/cash-flow-problems
[2] 1-800-D2C. (2025, July 22). Why DTC Brands Fail by Year 3 And How To Beat The Odds. https://www.1800d2c.com/resources/brand-failure-year-three-wall-dtc-brand-survival
[3] Opensend. (2025, April 27). 7 Inventory Carrying Cost Statistics For eCommerce Stores. https://opensend.com/post/inventory-carrying-cost-statistics-ecommerce
[4] Shopify. (2025, February 8). Inventory Carrying Costs Explained: Definition & How to Calculate. https://www.shopify.com/retail/inventory-carrying-costs
[5] NerdWallet. (2026, January). Average Business Loan Interest Rates. https://www.nerdwallet.com/business/loans/learn/rates-fees
[6] Hight Logistics. (2025, July 17). The Impact of Warehouse Leasing Trends on Supply Chain Costs. https://www.hightlogistics.com/the-impact-of-warehouse-leasing-trends-on-supply-chain-costs/
[7] National Retail Federation. (2023, September 26). National Retail Security Survey 2023. https://nrf.com/research/national-retail-security-survey-2023
[8] Sellercloud. (2023, November 9). What Is Dead Stock? What to Do With Obsolete Inventory?. https://sellercloud.com/blog/what-is-dead-stock-what-to-do-with-obsolete-inventory/
[9] Cadre. (2025, December 11). How Deadstock Hurts Your Business — And What to Do. https://www.cadretech.com/deadstock-meaning/
[10] ChannelWill. (2025, November 13). Ecommerce Return Rates 2025: Statistics, Benchmarks & Trends. https://www.channelwill.com/blogs/ecommerce-return-rates/
[11] Synctrack. (2025, July 14). Ecommerce Return Rates 2025 Data: Guide by Category & Solutions. https://synctrack.io/blog/ecommerce-return-rates/
[12] Radial. (2024). Returns Management in 2024: Balancing Cost and CX. https://www.radial.com/insights/returns-management-2024
[13] Shopify. (2025, December 9). Business Loan Interest Rates: Average Rates for 3 Loan Types. https://www.shopify.com/blog/business-loan-interest-rates
[14] BlueCart. (n.d.). Inventory Carrying Cost Benchmarks. https://www.bluecart.com/blog/inventory-carrying-cost
[15] The LMI. (2025, June 3). May 2025 Logistics Manager's Index Report. https://www.the-lmi.com/may-2025-logistics-managers-index.html