This report separates fit returns from sizing returns in apparel ecommerce, revealing that fit communication failures—not sizing errors—drive 35% of returns and require different interventions.
Published:
October 8, 2026
Author:
Yi Cui
Sizing and fit are not the same thing. That distinction sounds minor. It is not. It is the reason most apparel brands are spending money on the wrong interventions and watching their return rates stay exactly where they are.
When a retailer sees a 25% return rate, the instinct is to add a more detailed size chart. But a size chart only solves for garment measurements. It does nothing for the customer who ordered the right label size and still hated how it looked on her body. That is a fit return, not a sizing return. And the solution to a fit return is not better data. It is better communication.
The stakes are real. Overall apparel ecommerce return rates sit at 24.4% to 25% [1] [2], making fashion the most returned category in online retail by a wide margin. Size and fit issues are consistently cited as the primary driver, accounting for roughly 50% to 70% of those returns [3] [4]. Yet most brands collapse "wrong size" and "poor fit" into a single return code, then invest in sizing technology that addresses only half the problem. The result is a return rate that does not budge, a tech stack that grows more expensive, and a margin that quietly erodes.
This report separates the two. It breaks down what is actually driving apparel returns, how the mix shifts by price tier, and which interventions are actually worth deploying. If you are an apparel brand operator with a return problem, this is where to start.
Most return reason surveys lump fit and size together. That is a data collection shortcut that costs brands real money. To solve the problem, you need to understand the difference.
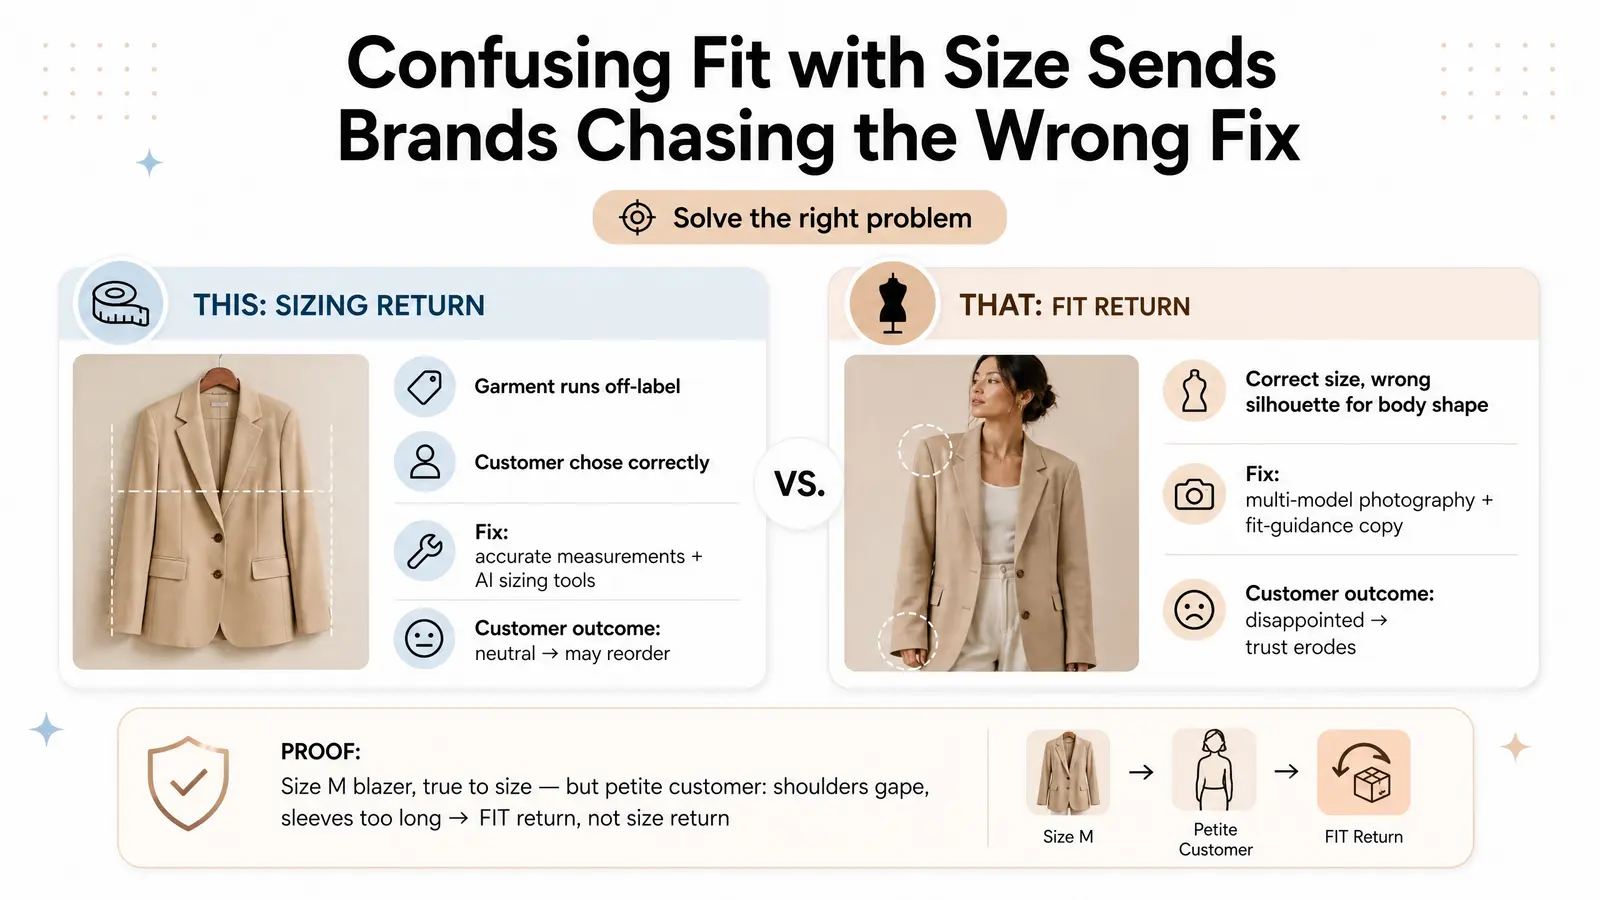
Sizing refers to the labeled dimensions of a garment. A sizing return happens when a customer orders their usual size, but the garment runs unusually small or large relative to standard expectations or the brand's own size chart. The customer made the right decision. The garment was mislabeled or inconsistently graded. This is a data problem, and it has data solutions: accurate garment measurements, dynamic size charts, AI-powered recommendation tools that cross-reference sizing across brands.
Fit refers to how the garment's cut and proportions interact with a specific body shape. A fit return happens when the garment is technically the correct size, but the silhouette, drape, or structure does not flatter the wearer. The label was accurate. The garment was what it claimed to be. But the customer's body did not match the body the garment was designed for. This is a visualization and communication problem, and it has visualization and communication solutions.
Consider a worked example. A customer orders a size M blazer. The blazer is a true M. But she is petite with narrow shoulders. The shoulders gape. The sleeves are too long. She returns it. That is a fit return, not a size return. The solution is not better size labeling. It is better body-type imagery, fit-guidance copy, and a PDP that shows the blazer on a petite model, not just a standard-height sample size.
When brands try to solve fit problems with sizing tools, they end up with frustrated customers who ordered the "right" size and still hate how it looks. The return rate does not move. The tech investment does not pay off. And the root cause remains untouched.
This distinction also has different customer psychology behind it. A sizing return tends to produce a neutral customer. They know the product was not the problem. They may exchange or reorder. A fit return tends to produce a disappointed customer who feels the brand did not help them understand what they were buying. That erodes trust and reduces the likelihood of repeat purchase.
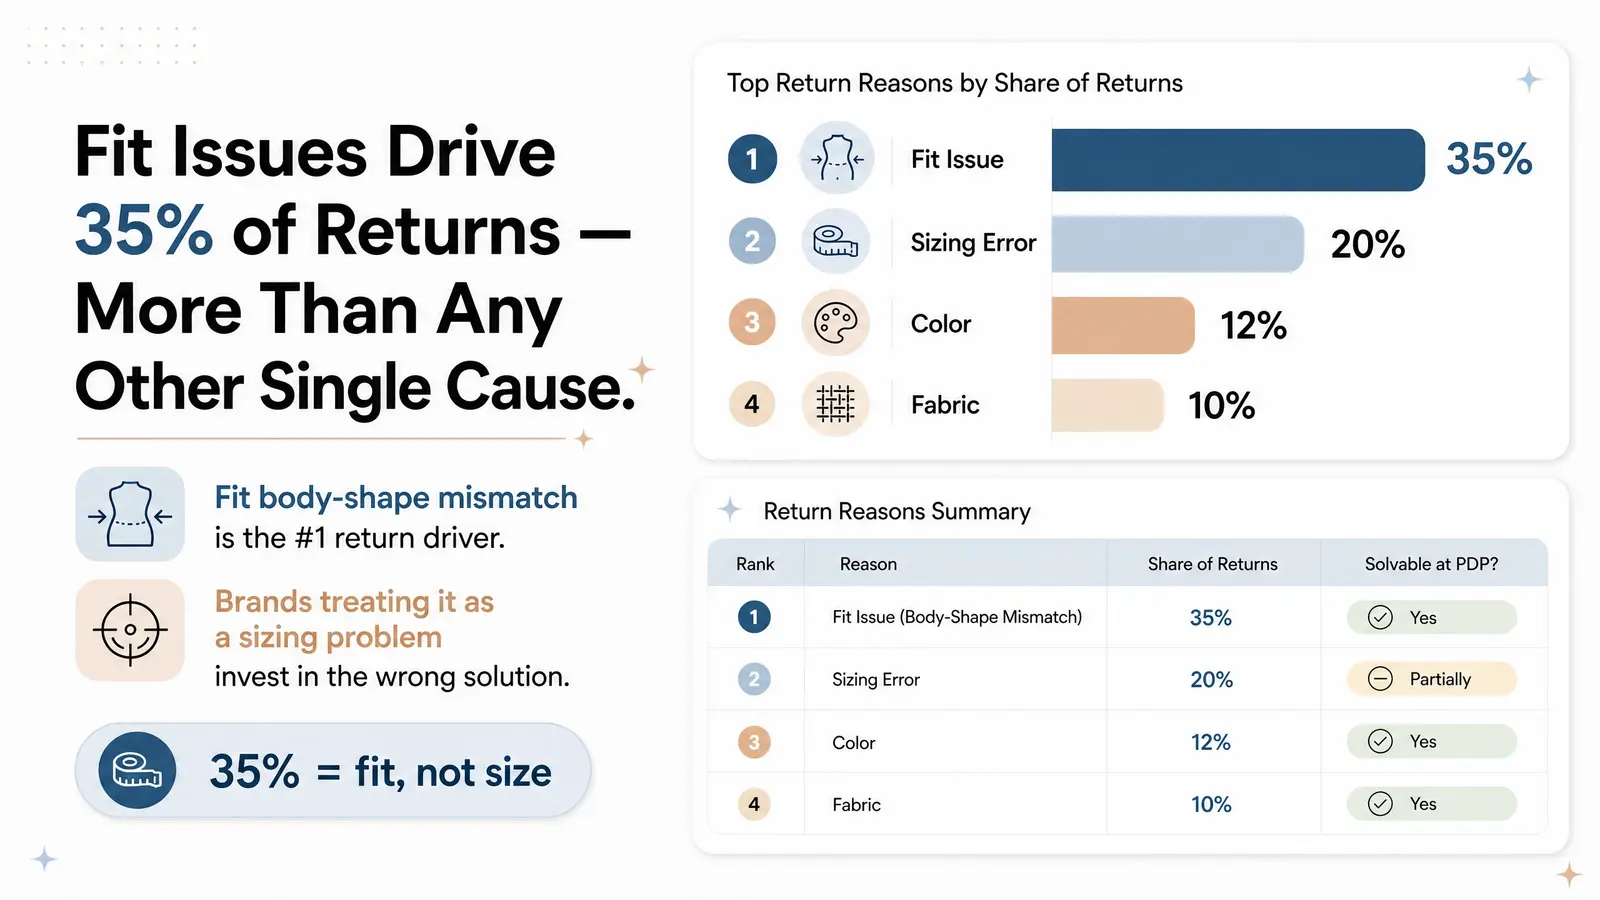
When we disaggregate the data, the true drivers of apparel returns become clear. While size and fit dominate, color mismatch, fabric disappointment, and style mismatch each represent meaningful shares of total return volume.
TABLE 1: Apparel Ecommerce Return Reasons — Estimated Share of Returns
| Return Reason | Est. % of Returns | Primary Cause | Solvable at PDP? |
|---|---|---|---|
| Fit issue (body shape mismatch) | 35% | Poor drape or cut for body type, lack of diverse model imagery | Yes: on-model photography, fit notes, body-type guidance |
| Sizing error (garment runs off-label) | 20% | Inconsistent grading, generic or outdated size charts | Yes: garment measurements, AI sizing tools |
| Color or appearance mismatch | 12% | Poor lighting in photos, inaccurate color rendering, no video | Yes: color-accurate photography, video, multiple lighting conditions |
| Fabric feel or texture disappointment | 10% | Vague material descriptions, no close-up texture photography | Yes: macro fabric shots, detailed material copy |
| Style mismatch ("didn't look as expected") | 8% | No lifestyle context, no movement imagery | Yes: styled lifestyle photos, video |
| Changed mind or buyer's remorse | 8% | Impulse purchasing, bracketing behavior | Partially: clear product copy, friction-reducing policies |
| Damaged or defective | 5% | Quality control failure, shipping damage | No |
| Other | 2% | Late delivery, wrong item shipped | No |
Sources: Editorial synthesis based on data from Coresight Research [1], Narvar [3], and industry benchmarks [4]. Note: Fit and sizing are often combined in broad surveys at roughly 50-55% combined. The separation here is based on qualitative analysis of return behaviors and the distinction between garment-measurement problems and body-shape communication problems. Rows flagged as editorial synthesis: Fit issue (35%), Sizing error (20%), Style mismatch (8%), Changed mind (8%).
The most important number in that table is the 35% attributed to fit issues. That is the largest single return driver, and it is the one most commonly misdiagnosed as a sizing problem. Brands that invest in AI sizing tools without first addressing fit communication are spending on the second-largest problem while ignoring the first.
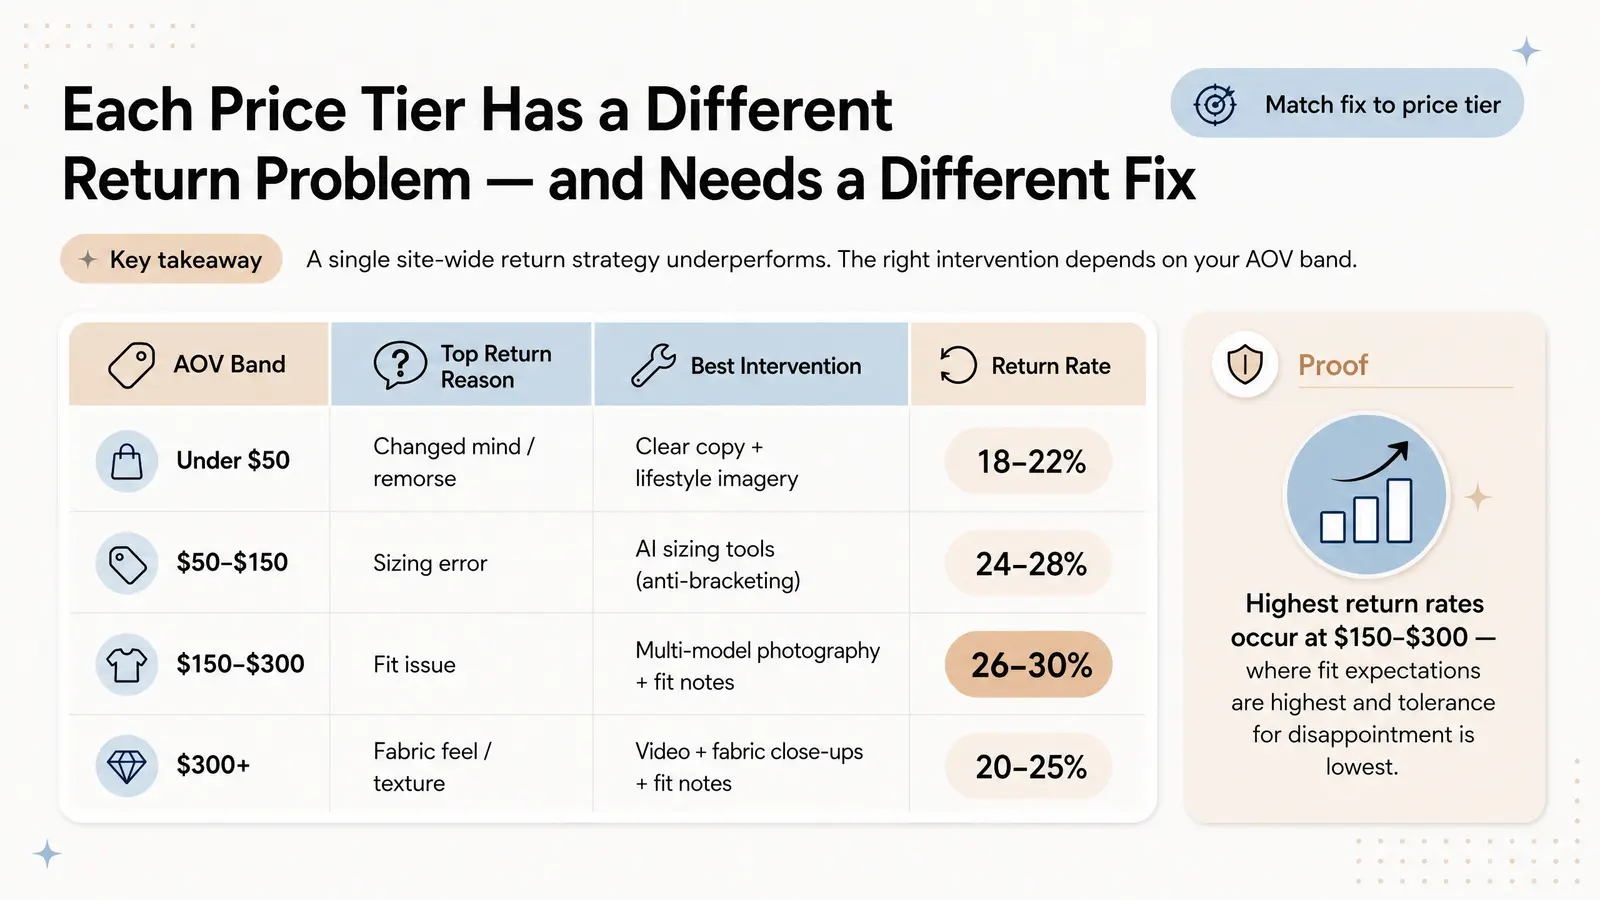
Return reasons are not uniform across price tiers. The mix shifts significantly as AOV increases, and the interventions that work at $40 are not the same ones that work at $250.
TABLE 2: Return Reason Mix by AOV Band (Editorial Synthesis)
| AOV Band | Top Return Reason | Secondary Reason | Return Rate Est. | Notes |
|---|---|---|---|---|
| Under $50 | Changed mind or buyer's remorse | Style mismatch | 18-22% | High impulse buying inflates remorse. Very low-cost items are sometimes not returned at all, which suppresses the measured rate slightly. |
| $50-$150 | Sizing error | Fit issue | 24-28% | The core ecommerce battleground. Bracketing is most common here. Customers are willing to buy two sizes and return one. |
| $150-$300 | Fit issue | Fabric feel or texture | 26-30% | Customers expect precision at this price point. A garment must flatter the body and feel premium to justify the cost. Expectations are high and tolerance for disappointment is low. |
| $300+ | Fabric feel or texture | Fit issue | 20-25% | High-end buyers expect tailored quality. They are more likely to report honestly and specifically. Return rates may be slightly lower because the purchase decision is more deliberate. |
Editorial Synthesis: This table represents a synthesized analysis of return behavior across price tiers, combining general industry return rate ranges with behavioral ecommerce psychology. Hard data segmented by AOV band is not widely published. These estimates are grounded in available benchmarks [1] [2] and logical inference from purchase behavior research.
The practical implication is straightforward. At lower price points, the priority is reducing impulse-driven remorse through clearer product copy and realistic lifestyle imagery. At mid-range price points, anti-bracketing sizing tech becomes the highest-ROI investment. At premium price points, sensory-rich content (video, fabric close-ups, detailed fit notes) is what justifies the purchase and prevents disappointment-driven returns.
Ecommerce operators managing multiple price tiers need different intervention stacks for each. A single site-wide approach to returns reduction will underperform because it is optimized for the average, not for the actual distribution.
Before investing in any return-reduction technology or content upgrade, a brand needs to diagnose its specific failure mode. Buying a virtual try-on tool when your primary problem is color mismatch is like prescribing the wrong medication. The symptom might look similar, but the cause is different.
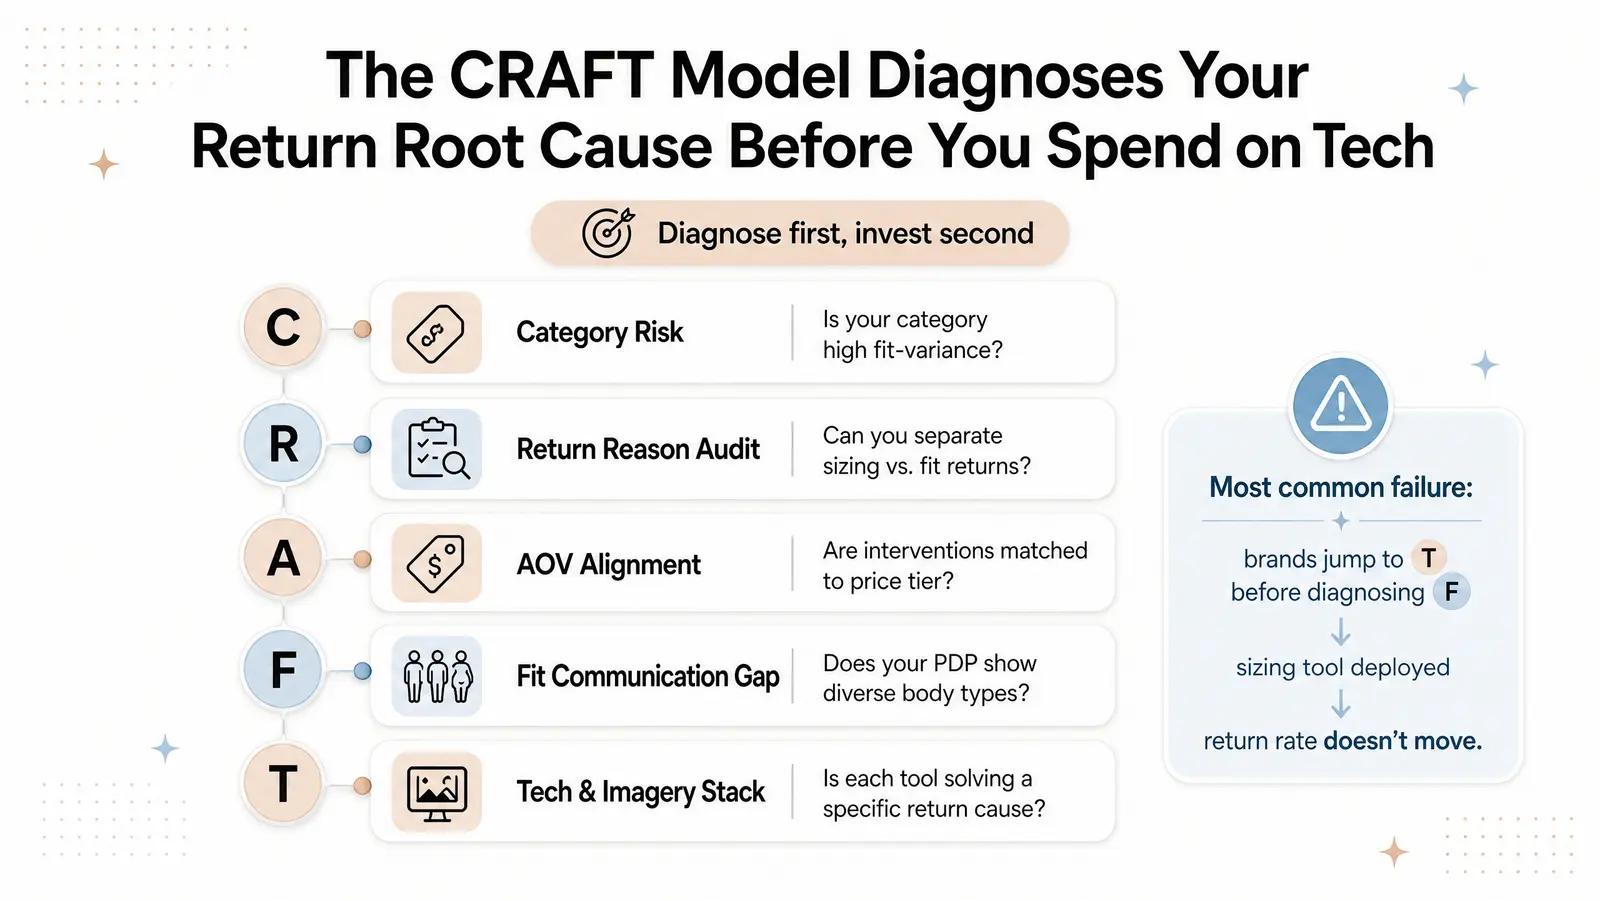
To help product founders diagnose their return-reason mix and prioritize interventions, we use a proprietary diagnostic framework called the CRAFT Model.
C: Category risk. Is your product category inherently high-fit-variance? Tailored blazers, fitted dresses, and structured pants carry far more fit risk than oversized knitwear or elastic-waist bottoms. Before anything else, understand where your category sits on the fit-variance spectrum. High-variance categories demand more investment in fit communication. Low-variance categories may be over-investing in sizing tools when the real problem is color accuracy or fabric description.
R: Return reason audit. Do you actually know why customers are returning your products? Not the broad "size or fit" bucket, but the specific breakdown. Are they returning because the garment runs small, or because it does not suit their body shape? If your return reason codes are not granular enough to answer that question, you are flying blind. The first investment should be in data collection, not technology.
A: AOV alignment. Are your interventions matched to your price tier? A $30 fast-fashion top and a $280 structured coat have different customers, different expectations, and different intervention needs. Deploying expensive AI sizing tools on low-AOV items rarely pays off. Deploying only static size charts on premium items is leaving return reduction on the table.
F: Fit communication gap. What is your PDP failing to show or say about how the garment drapes on real bodies? This is the most commonly skipped diagnostic step. Most brands audit their size charts before they audit their imagery. But for fit returns, the PDP is the primary failure point. If your product page does not show the garment on a body that resembles your customer's body, you have a fit communication gap.
T: Tech and imagery stack. What tools are you using, and are they matched to your actual problem? AI sizing tools solve sizing errors. Multi-model photography solves fit communication gaps. Video solves sensory expectation gaps. The technology should follow the diagnosis, not precede it.
In our experience working with product founders at Branvas, the most common failure is jumping straight to T before diagnosing F. A brand invests in a size recommendation widget, the return rate barely moves, and the conclusion is that "sizing tech doesn't work." The real conclusion is that the primary problem was fit communication, not sizing accuracy, and the wrong tool was deployed.
Self-Audit Prompt for Each Letter:
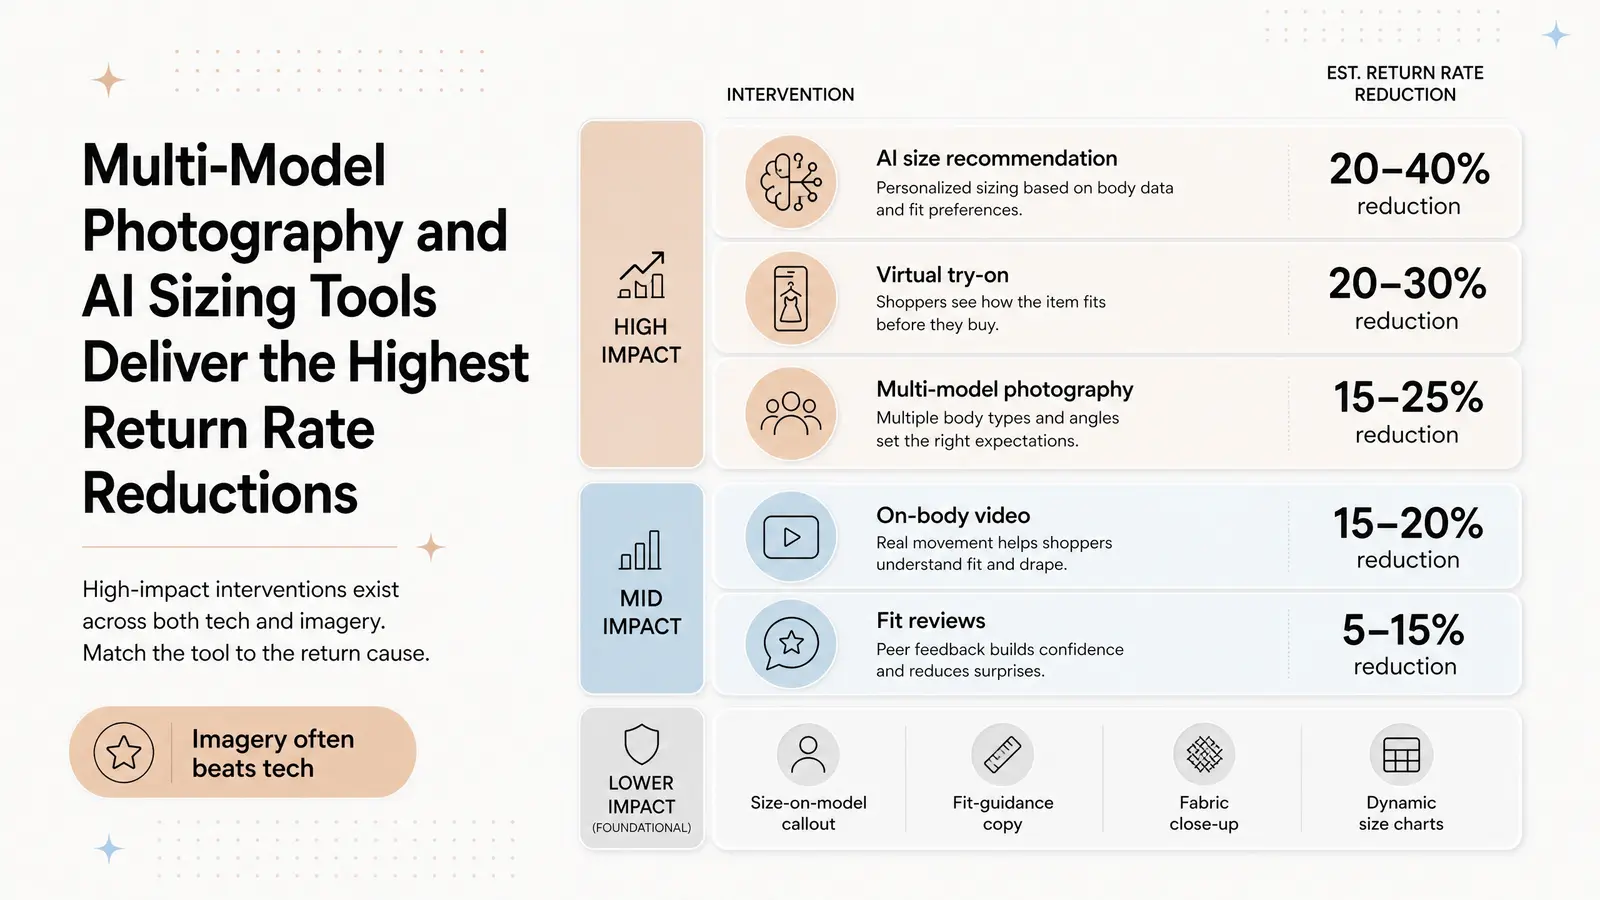
Once you have diagnosed the root cause of your returns, you can deploy the right interventions. The following rankings are based on available data and editorial synthesis where hard data is limited.
1. AI-powered size recommendation (True Fit, Fit Finder, Sizebay). High impact. Tools that analyze past purchases and cross-brand sizing data to recommend the best fit can improve size accuracy for 81% of users and reduce return rates by up to 40% [5]. The key variable is data quality. Tools with larger cross-brand datasets produce better recommendations. These tools are most effective at the $50-$150 AOV band where bracketing is most common.
2. Virtual fit and body-measurement tools (Fytted, Zyler, body-scan integrations). High impact. Virtual try-on technology reduces apparel returns by 20-30% when implemented correctly [6]. The reduction comes from eliminating size uncertainty before purchase, not from post-purchase intervention. Implementation complexity is high, and the ROI is strongest for brands with AOV above $100.
3. Fit reviews and community-sourced fit notes. Medium impact. Allowing customers to tag reviews by body type (Tall, Petite, Curvy) or add structured fit feedback provides relatable context. The limitation is subjectivity. A 2022 True Fit analysis found that only 56% of aggregated review rollups accurately indicated whether an item was true to size, even when 70% of buyers purchased their usual size [5]. Reviews are useful as a supplement, not a primary sizing tool.
4. Customer-reported body data collection at checkout. Medium impact. Collecting height, weight, and body-shape preferences at checkout enables better backend analysis of which products are generating fit friction for which customer segments. This is more useful for product development and grading decisions than for immediate return reduction.
5. Size chart optimization (static to dynamic). Low to medium impact. Updating size charts to include actual garment measurements (not just body measurements) and making them product-specific rather than category-wide improves accuracy. But static size charts alone rarely move return rates significantly because many customers do not know their own measurements and cannot translate garment dimensions into fit expectations.
1. Multi-model photography. High impact. Showing the same garment on multiple body types, including size S, size L, and size XXL models, sets accurate expectations for fit and drape across the customer base. Brands that have rebuilt PDPs with multi-model photography have reported return rate reductions of 15-25% [7]. This is the highest-ROI imagery investment for fit returns specifically.
2. On-body video and short-form try-on content. High impact. Video shows movement, fabric weight, and stretch in a way static images cannot. A 15-second clip of a model walking in a dress communicates more about drape and fit than six static photos. Return rates drop 15-20% when on-model images and video are used as primary content [7].
3. Size-on-model callout. Medium impact. Adding "Model is 5'7", 145 lbs, wearing size M" directly to each product image provides immediate scale context. This is a low-cost, high-clarity intervention that costs nothing to implement and reduces the guesswork customers use to assess fit.
4. Fit-guidance copy. Medium impact. Structured fit notes like "Fits true to size / Size up if between sizes / Recommended for straight or athletic builds" clarify designer intent and reduce the gap between what the garment is designed to do and what the customer expects. This is especially effective for items with non-standard silhouettes.
5. Fabric close-up and texture photography. Medium impact. Macro shots of fabric texture reduce returns driven by material disappointment, which is the dominant return driver at the $150+ price tier. Customers paying premium prices expect to understand exactly what they are buying.
6. 360-degree product views. Low to medium impact for apparel. More useful for accessories and shoes than for clothing, where the primary information need is how the garment looks on a body, not how it looks from behind.
TABLE 3: Intervention Impact Rankings
| Intervention | Type | Est. Return Rate Reduction | Implementation Complexity | Best For (AOV Band) |
|---|---|---|---|---|
| AI size recommendation | Tech | 20-40% | High | $50+ |
| Virtual try-on | Tech | 20-30% | High | $100+ |
| Multi-model photography | Imagery | 15-25% | Medium | All |
| On-body video | Imagery | 15-20% | Medium | $50+ |
| Fit reviews (tagged by body type) | Content | 5-15% | Low | All |
| Size-on-model callout | Content | 5-10% | Low | All |
| Fit-guidance copy | Content | 5-10% | Low | All |
| Fabric close-up photography | Imagery | 5-10% | Low | $100+ |
| Dynamic size charts | Tech | 3-8% | Medium | All |
| 360-degree views | Imagery | 2-5% | Medium | Accessories |
Sources: Return rate reduction estimates are drawn from True Fit [5], Photta cohort data [6], and MetaModels.ai merchant data [7]. Estimates flagged as editorial synthesis where hard data is not available.
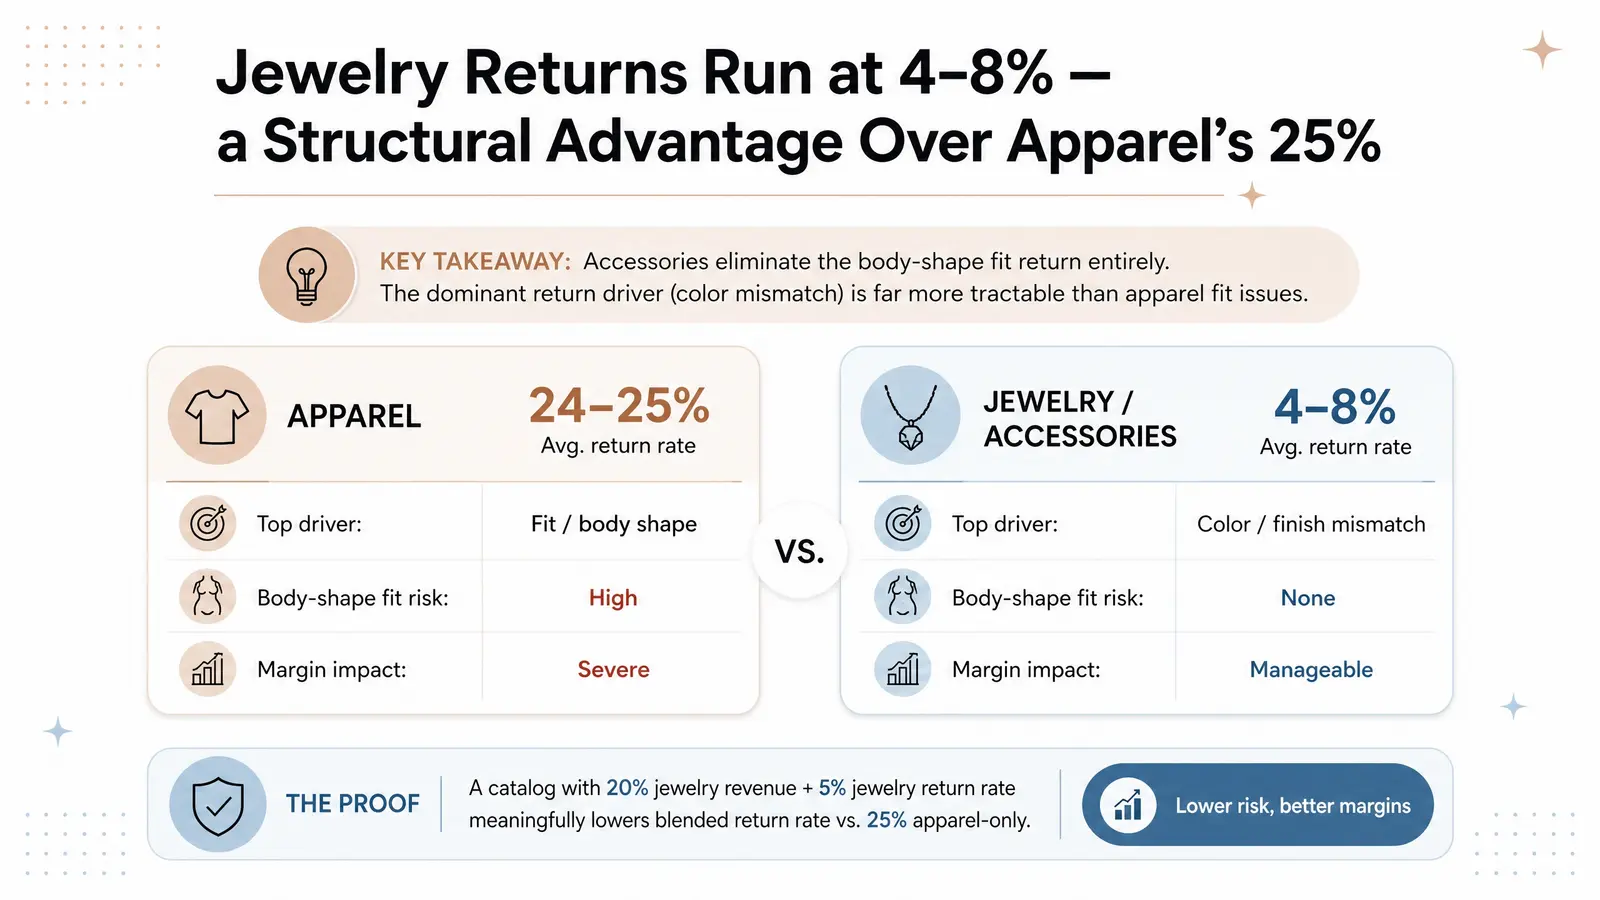
While apparel brands are managing 25% return rates, the accessories and jewelry categories operate in a different reality. Jewelry returns typically fall in the 4-8% range, and general accessories sit around 7-13% [8]. Fine jewelry runs even lower, at 10-14% for fashion jewelry and 10-14% for fine pieces [6].
This gap is not a coincidence. It is structural.
Accessories have a fundamentally different return-reason profile than apparel. Fit variance is minimal. Sizing expectations are binary: a ring fits or it does not, a necklace is the right length or it is not, a bracelet clasp works or it does not. The entire category of body-shape fit returns that drives 35% of apparel returns simply does not exist in jewelry. A customer cannot return a necklace because it does not flatter her shoulder width.
The dominant return driver in jewelry and accessories is color and finish mismatch, which is a PDP photography problem, not a fit problem. And it is far more tractable. Accurate macro photography, video showing the piece in multiple lighting conditions, and precise material descriptions address the primary return cause directly. The intervention is simpler, cheaper, and more reliable than the multi-model photography and AI sizing tools required for apparel.
This is one reason many apparel-fatigued sellers are expanding into or pivoting to private-label accessories. The return economics are structurally more favorable. At Branvas, we support founders in launching branded jewelry and accessories lines that sidestep many of the fit-return challenges inherent in apparel. Ecommerce operators who are struggling with apparel margins can explore our product catalog to see what a low-return-risk category looks like in practice.
For ecommerce operators and boutique store owners specifically, adding a jewelry or accessories line to an apparel-heavy catalog creates a blended margin buffer. A store running 25% apparel returns and 5% jewelry returns, with jewelry representing 20% of revenue, sees a meaningfully lower blended return rate. The math compounds quickly.
Explore how Branvas works: branvas.com/how-it-works
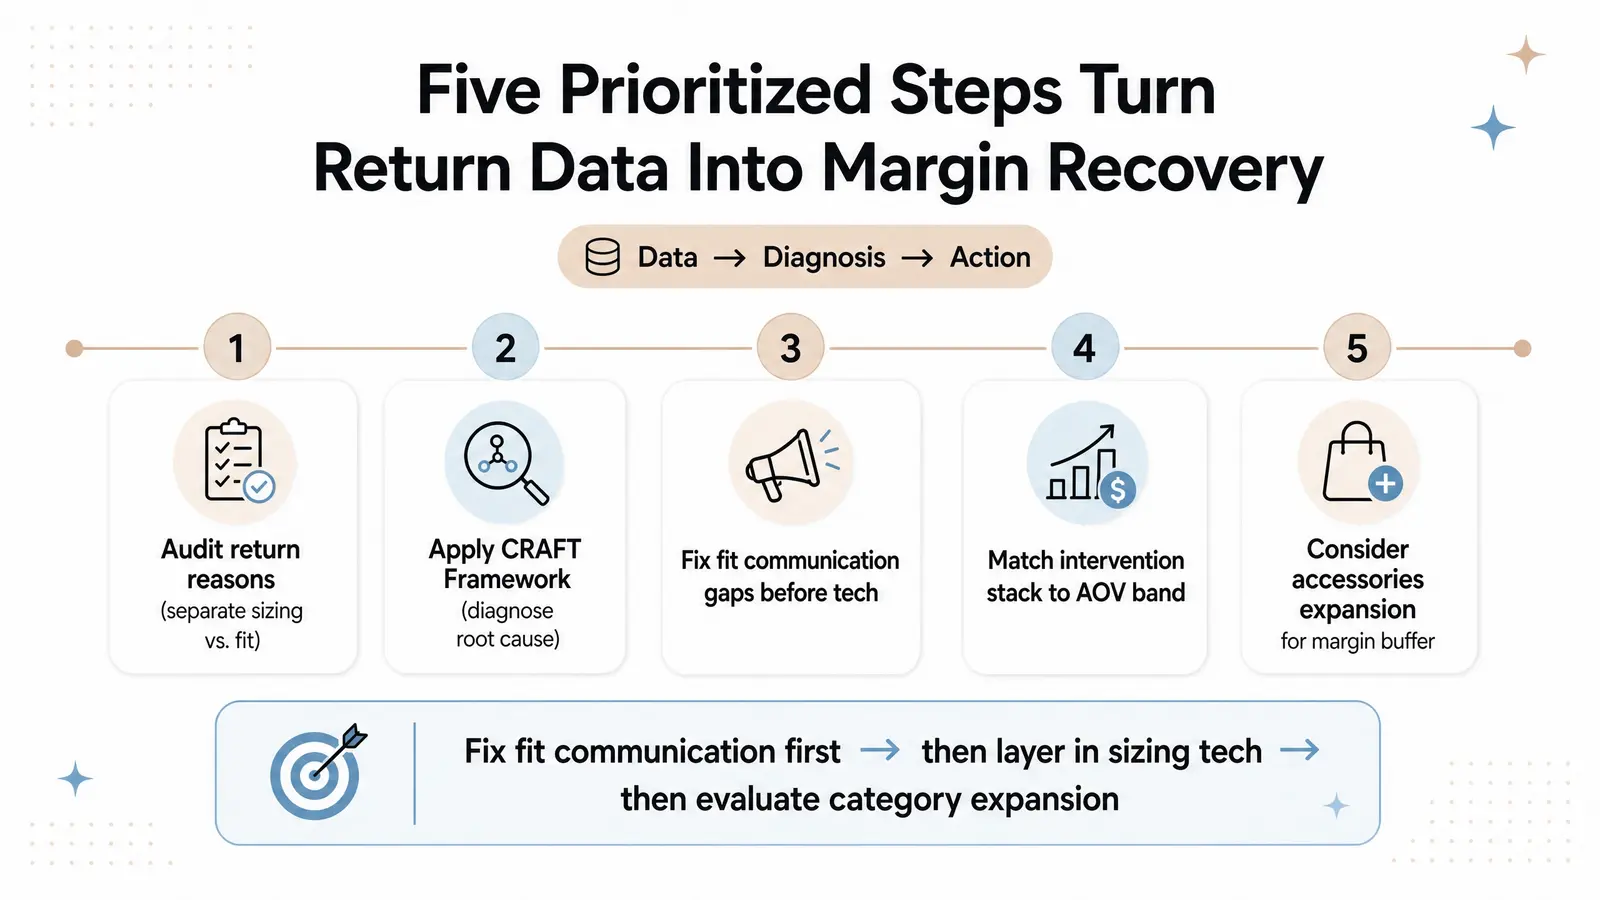
Here is the prioritized action sequence for an apparel brand operator who wants to move the number.
Step 1: Audit your actual return reasons. Not the broad categories. The specific ones. Implement return reason codes that separate "garment ran small" from "didn't flatter my body shape." If you cannot distinguish between sizing errors and fit communication failures in your data, you cannot prioritize correctly. This is the prerequisite for everything else.
Step 2: Apply the CRAFT Framework. Work through each letter. Identify your category's fit-variance profile, confirm your return reason data is granular enough to diagnose, check that your interventions match your AOV band, audit your PDP for fit communication gaps, and evaluate whether your tech stack is solving the right problem.
Step 3: Prioritize fit communication gaps before investing in tech. Before purchasing an AI sizing tool, ensure your PDP has multi-model photography, on-body video, and clear fit-guidance copy. These are lower-cost, higher-impact interventions for fit returns specifically. Tech is the right investment for sizing errors. Imagery and copy are the right investment for fit communication failures.
Step 4: Match your intervention stack to your AOV band. High AOV items require sensory-rich interventions: video, fabric close-ups, detailed fit notes. Mid-tier items benefit most from anti-bracketing sizing tech. Low AOV items need clearer product copy and realistic lifestyle imagery to reduce impulse-driven remorse.
Step 5: Consider category expansion into lower-fit-variance products. If apparel return economics are structurally unsustainable for your business model, expanding into jewelry or accessories is not a workaround. It is a margin strategy. Use the Branvas profit calculator to model what a blended catalog with lower-return accessories would do to your effective margin.
If you are a product founder who is tired of apparel return economics eating your margins, or you are considering expanding into lower-return-risk categories like private-label jewelry and accessories, Branvas makes it fast and capital-efficient. No inventory risk, no minimum orders, and blind fulfillment under your brand. Start building your brand at branvas.com
The average return rate for online apparel typically ranges from 24% to 28%, making it one of the most returned categories in ecommerce [1] [2]. Coresight Research puts the figure at 24.4% for the 12 months ending March 2023. More recent benchmarks from 2026 place the average at 25%, with significant variation by subcategory: women's fashion runs closer to 28%, men's fashion closer to 19%, and swimwear as high as 38-44%. These rates are roughly two to three times higher than the return rate for brick-and-mortar clothing purchases, which typically sits at 8-10%.
Size and fit issues are overwhelmingly the most common reasons, accounting for roughly 50% to 70% of all apparel returns [3] [4]. Narvar's State of Returns data shows that size and fit were cited in 45% of all returns in 2022, up from 42% in 2021 and 38% in 2020, indicating the problem is getting worse, not better. Customers frequently engage in bracketing, buying multiple sizes with the intent to return the ones that do not fit, which inflates return volume beyond what would occur if fit confidence were higher.
A sizing return occurs when the garment's measurements run smaller or larger than the label indicates. The customer made the correct size decision based on their own measurements, but the garment was inconsistently graded or mislabeled. A fit return happens when the garment is technically the correct size, but the cut, proportion, or silhouette does not suit the customer's specific body shape. These are distinct problems with distinct solutions: sizing errors are addressed with accurate garment measurements and AI recommendation tools; fit communication failures are addressed with multi-model photography, body-type guidance, and fit-specific copy.
The most effective interventions for fit returns are PDP-level improvements, not sizing technology. Multi-model photography showing the same garment on diverse body types reduces fit returns by 15-25% [7]. On-body video showing movement and drape reduces returns by 15-20%. Structured fit-guidance copy that specifies which body types the garment is designed for, and whether it runs relaxed or fitted, closes the expectation gap before purchase. AI sizing tools are effective for sizing errors but do not address the body-shape communication problem that drives fit returns.
Yes, but with important caveats. AI-powered size recommendation tools and virtual try-on technology can reduce apparel return rates by 20% to 40% when deployed correctly [5] [6]. They are most effective for sizing errors, specifically for reducing bracketing behavior where customers order multiple sizes out of uncertainty. True Fit's data from Moosejaw shows a 24% decline in size bracketing rates over one year after implementing AI-powered size recommendations at the moment of cart addition. However, these tools have limited impact on fit returns caused by body-shape mismatch. A customer who receives an accurate size recommendation but whose body proportions do not match the garment's cut will still return the item.