Pinterest shopping statistics for 2026 reveal 640 million users, 80+ billion monthly searches, and strong jewelry purchase intent with named brand case studies and ad benchmarks.
Published:
September 23, 2026
Author:
Yi Cui
The conventional view treats Pinterest as upper-funnel awareness. That misses the user behavior: forming a preference, refining a query, saving an idea, and moving to a merchant site.
Pinterest reported more than 80 billion monthly searches in its February 2026 earnings release. It also reported that 96% of its top searches are unbranded, while 45% of clicks occur in the top 10 search results. Those are search-engine behaviors, not passive-feed behaviors. 2 10
For jewelry, a search for a ring stack, bridal styling, or men’s brooch aesthetic signals preference formation, even when checkout is not immediate.
The practical paradigm shift: Pinterest should be measured as a visual search and consideration surface with a long decision window. It is not simply a social post that either converts on the day or fails.
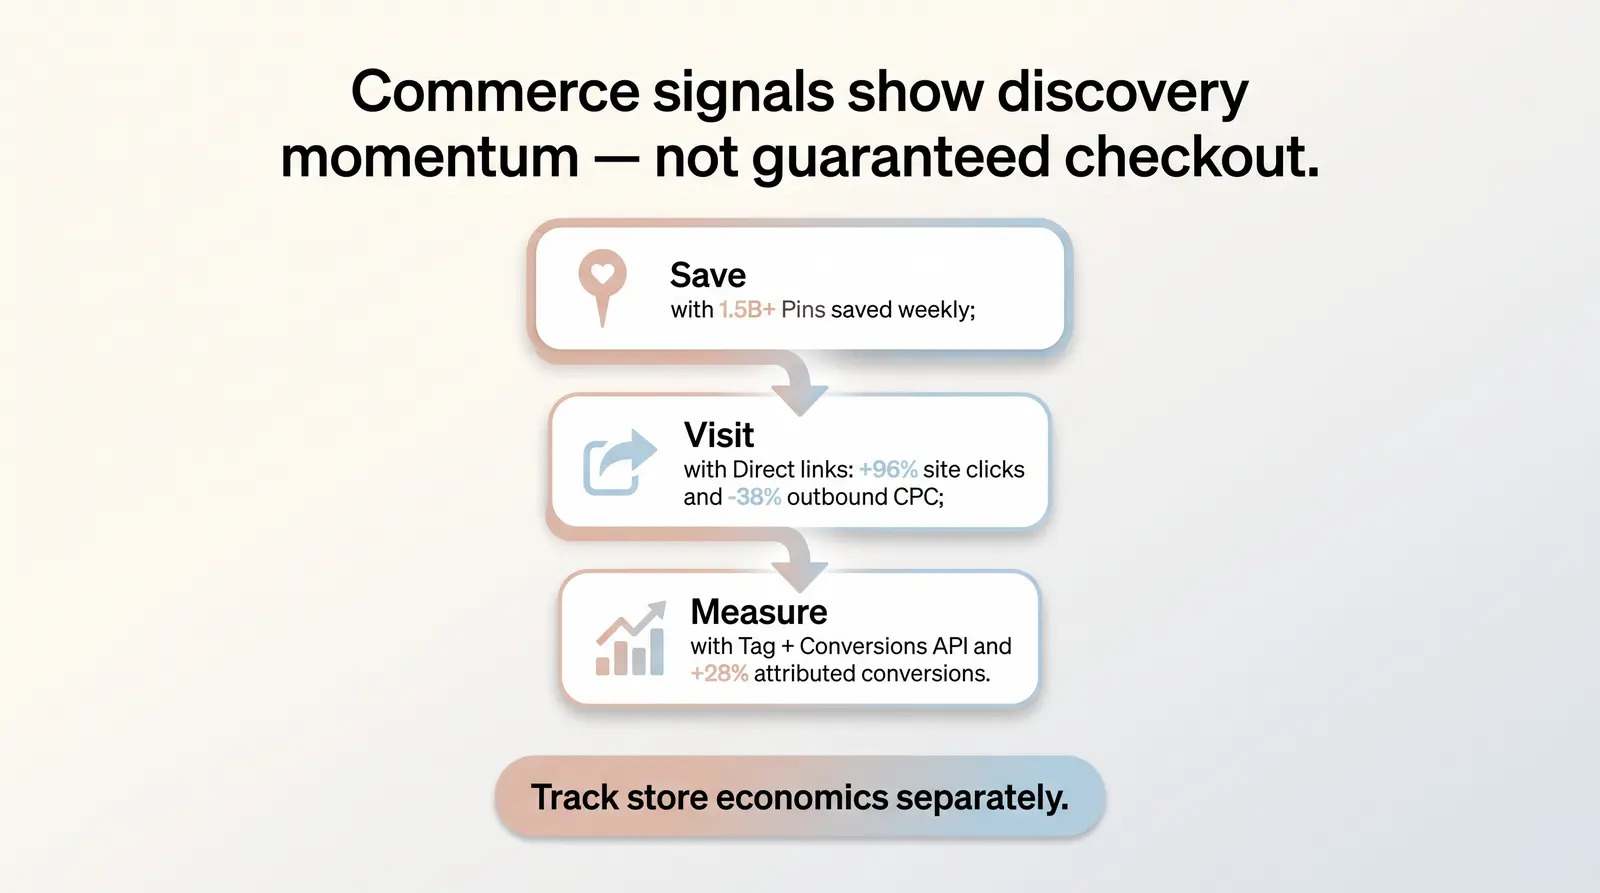
Pinterest’s product flow supports that interpretation. Direct links can send a click from a supported ad straight to the advertiser’s site, reducing the documented off-platform journey from two clicks to one. Pinterest reported that brands using direct links in consideration campaigns saw 96% more clicks to site and 38% lower cost per outbound click than their prior Pinterest campaigns. These are Pinterest-reported advertiser comparisons, not universal guarantees. 7
In our experience working with jewelry sellers at Branvas, the biggest mistake is a seven-day, last-click comparison with a fast-scroll channel. A saved Pin can return as branded search, direct traffic, or a later site visit, so the attribution plan must reflect that path.
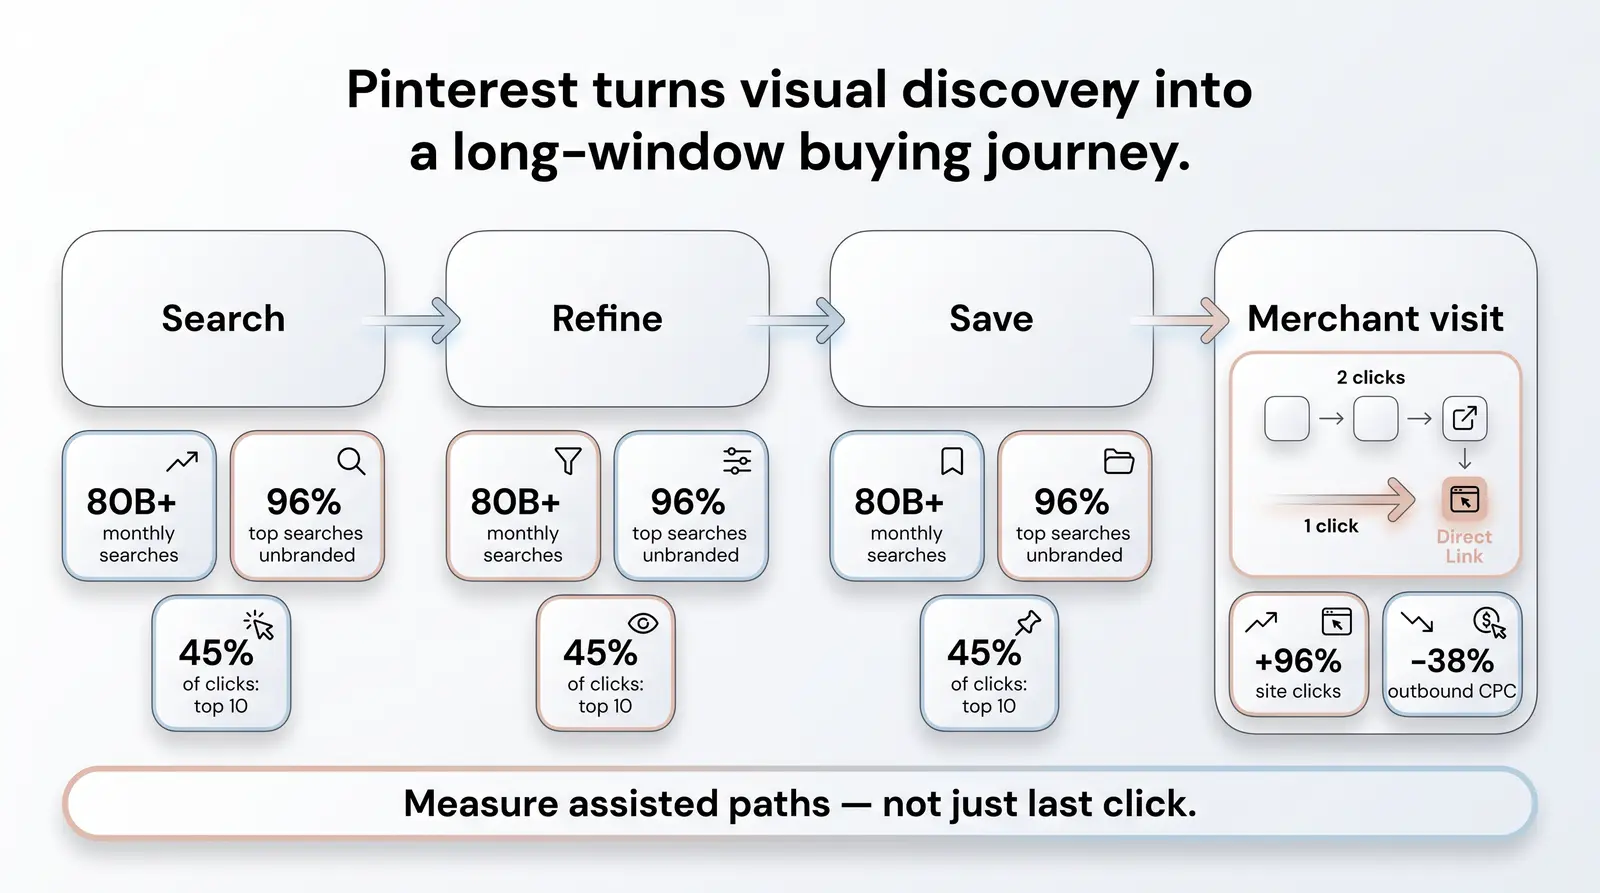
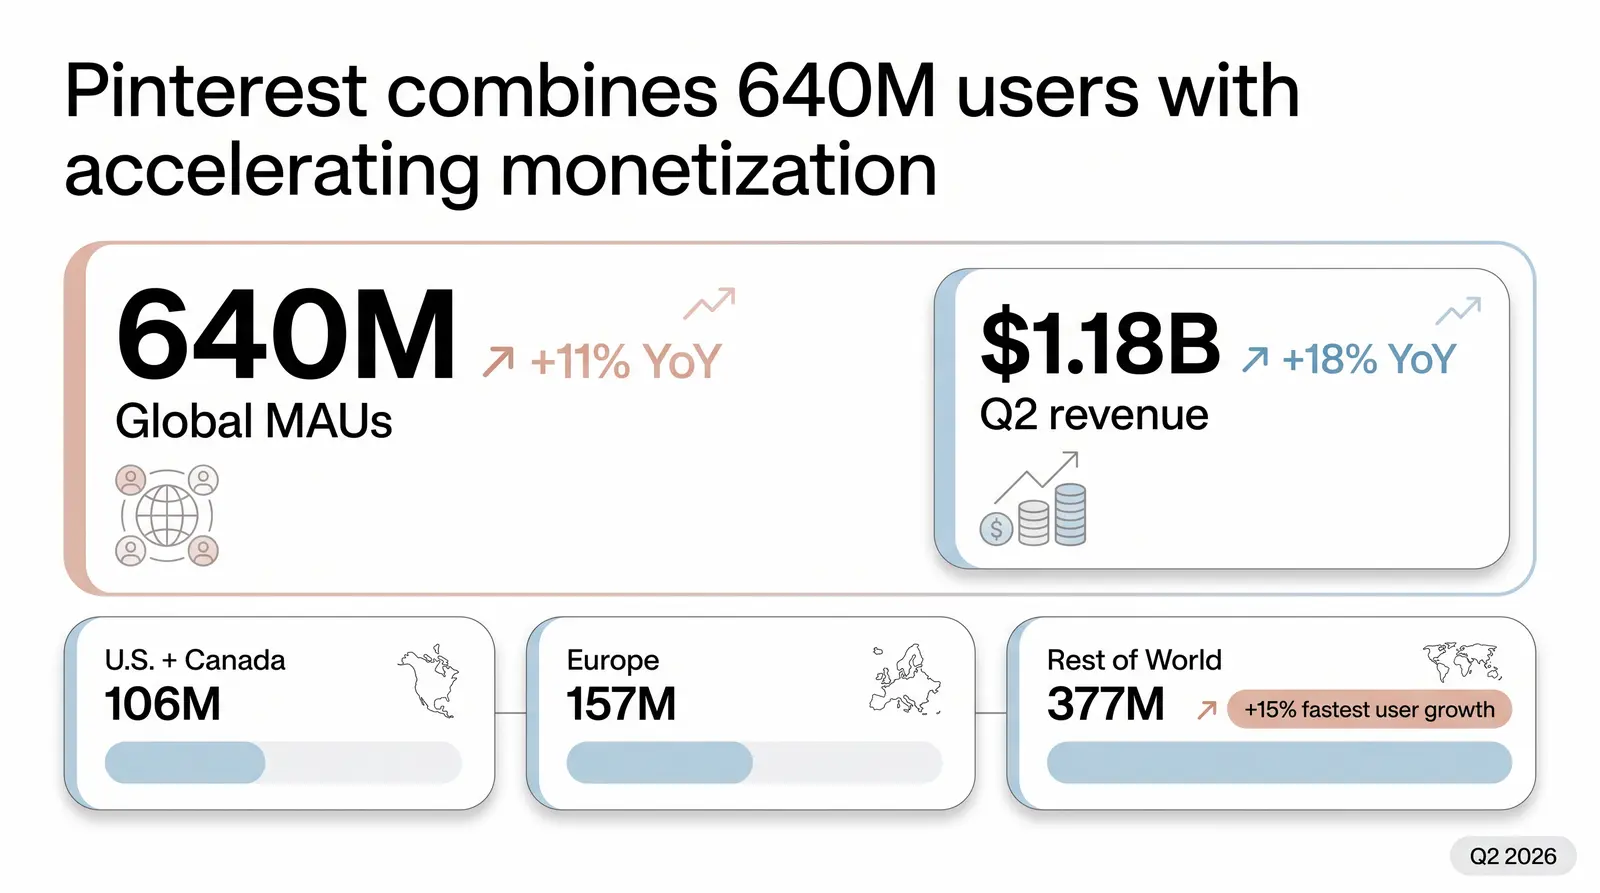
The latest reported quarter available as of September 2026 is Q2 2026. Pinterest reported 640 million global MAUs, up from 578 million in Q2 2025. Revenue reached $1.180 billion, compared with $998 million a year earlier. 1 22
| Metric | Latest reported figure | Comparable prior figure | What it tells an ecommerce operator |
|---|---|---|---|
| Global MAUs | 640 million, Q2 2026 | 578 million, Q2 2025 | Audience scale grew 11% year over year. |
| U.S. and Canada MAUs | 106 million, Q2 2026 | +4% year over year | Mature but still growing high-monetization market. |
| Europe MAUs | 157 million, Q2 2026 | +8% year over year | A meaningful cross-border opportunity. |
| Rest-of-world MAUs | 377 million, Q2 2026 | +15% year over year | Fastest user growth among reported regions. |
| Q2 revenue | $1.180 billion | $998 million in Q2 2025 | Revenue rose 18% year over year. |
| U.S. and Canada Q2 revenue | $880 million | +18% year over year | This region generated 74.6% of Q2 reported revenue. |
| Europe Q2 revenue | $213 million | +12% year over year | Europe represented 18.1% of Q2 reported revenue. |
| Rest-of-world Q2 revenue | $87 million | +38% year over year | Monetization is growing from a smaller base. |
| Full-year revenue | $4.222 billion, 2025 | $3.646 billion, 2024 | Full-year revenue grew 16% in 2025. |
| Full-year global ARPU | $7.21, 2025 | $6.94 in 2024 | Annual ARPU rose 4% in 2025. |
| Monthly searches | 80+ billion, 2025 results | Not separately audited as a MAU metric | An executive usage statement, useful as search context. |
Source: Pinterest Q2 2026 and full-year 2025 earnings disclosures. Regional shares calculated from disclosed Q2 figures. 1 2
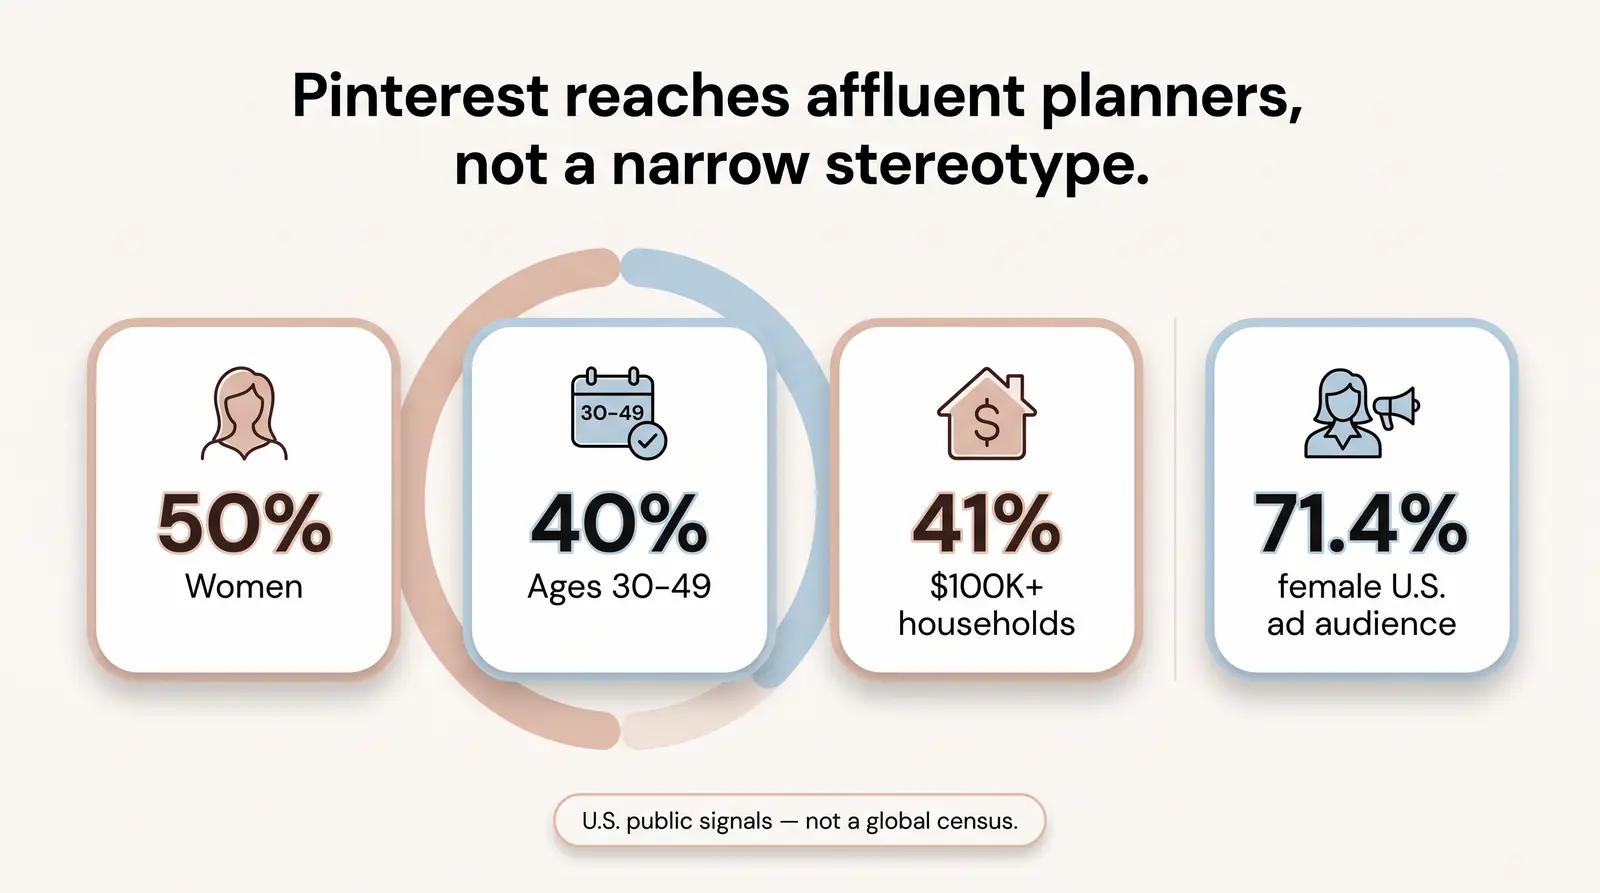
Pinterest does not publish an audited global demographic census. This table uses Pew’s U.S.-adult survey, fielded May to September 2023, and DataReportal’s late-2025 U.S. advertising-audience estimate. Neither is a global user profile. 4 5
| Audience lens | Publicly reported figure | Data period | Planning implication for jewelry |
|---|---|---|---|
| U.S. adults using Pinterest | 35% | 2023 fieldwork | Broad enough to test beyond a niche interest audience. |
| Women using Pinterest | 50% | 2023 fieldwork | Strong relevance for women-led jewelry demand. |
| Men using Pinterest | 19% | 2023 fieldwork | Not a women-only platform, especially for gifting and men’s accessories. |
| Ages 18-29 | 45% use Pinterest | 2023 fieldwork | Reach for trend-led and entry-price collections. |
| Ages 30-49 | 40% use Pinterest | 2023 fieldwork | Core planning and life-stage audience for bridal and gifting. |
| Ages 50-64 | 33% use Pinterest | 2023 fieldwork | Do not exclude mature, higher-consideration shoppers. |
| Ages 65+ | 21% use Pinterest | 2023 fieldwork | Smaller but material audience. |
| Household income under $30,000 | 27% use Pinterest | 2023 fieldwork | Price positioning still matters. |
| Household income $30,000-$69,999 | 34% use Pinterest | 2023 fieldwork | Broad middle-income reach. |
| Household income $70,000-$99,999 | 35% use Pinterest | 2023 fieldwork | Relevant for attainable fine jewelry. |
| Household income $100,000+ | 41% use Pinterest | 2023 fieldwork | Supports a premium-assortment test. |
| High school or less | 26% use Pinterest | 2023 fieldwork | Lower usage than post-secondary groups in this survey. |
| Some college | 42% use Pinterest | 2023 fieldwork | Highest education segment in the survey. |
| College graduate | 38% use Pinterest | 2023 fieldwork | Strong professional audience reach. |
| U.S. potential ad reach | 96.9 million | Late 2025 data, in 2026 report | Advertising reach is not the same measure as MAUs. |
| Female share of U.S. ad audience | 71.4% | Late 2025 data | Useful for media planning, not a census of users. |
| Male share of U.S. ad audience | 19.2% | Late 2025 data | Leaves room for gift, men’s, and gender-neutral collections. |
| Access route | Mobile app, web, and browser/site extensions | FY 2025 definition | Pinterest does not disclose an audited app-versus-web usage split. |
Sources: Pew Research Center and DataReportal. Pinterest’s annual report defines MAU access, but does not publish a device-share split. 3 4 5
What surprises most sellers we work with at Branvas is that the opportunity is not a demographic stereotype. It is the overlap of a visual product, a planning occasion, and an open-minded shopper.
Pinterest has added commerce infrastructure, but platform claims are not merchant outcomes. These figures describe discovery, catalogs, links, and measurement, not a store’s checkout rate or acquisition cost.
| Commerce signal | Reported result | Year | Correct interpretation |
|---|---|---|---|
| People who think of Pinterest as a place to shop | More than half | 2023 | Pinterest-published audience finding; no respondent base on the accessible release. |
| Retailers setting up shop through catalogs | +66% year over year | 2023 | Catalog adoption, not merchant sales. |
| Active shopping feeds | +70% year over year | 2023 | Supply-side shopping infrastructure growth. |
| Product saves in some catalog-connected categories | Up to +90% | 2023 | “Up to” result, not a platform average. |
| Attributed checkouts in some catalog-connected categories | +30% | 2023 | Category-specific attributed result, not a conversion rate. |
| Top searches that were unbranded | 97% | 2023 | Discovery opportunity for smaller labels. |
| Pins saved each week | 1.5+ billion | 2023 | Intent and consideration signal, not purchases. |
| Buyable items saved to boards | +50% year over year | 2023 | Growth in shoppable saving behavior. |
| Clicks to site with direct links, consideration campaigns | +96% | 2023 | Pinterest-reported comparison with prior campaigns. |
| Cost per outbound click with direct links | -38% | 2023 | Same comparison, not a universal CPC benchmark. |
| Catalog-sales clicks with direct links | +68% | 2023 | Pinterest-reported comparison with prior campaigns. |
| Catalog-sales click-based conversions with direct links | +26% | 2023 | Click-based attribution outcome. |
| Conversions attributed after adding Conversions API | +28% | 2024 | Better measurement can increase reported attribution. |
| CPA using Tag plus Conversions API | Up to -14% | 2024 | “Up to” result, versus Tag alone. |
| Attributed conversion volume using Tag plus API | +28% | 2024 | Attribution signal, not necessarily incremental revenue. |
| Performance+ campaigns that beat traditional campaigns | 80% of A/B tests | 2025 | Test count and outcome mix were not disclosed. |
| Auto-collage save rate versus standard Product Pins | 2x | 2025 | Engagement outcome, not checkout outcome. |
| Performance+ ROAS bidding median result | +10% ROAS | 2025 beta test | Median beta-test outcome, not a forecast. |
Sources: Pinterest newsroom, investor-day, direct-link, measurement, and shopping materials. 6 7 8 9 11 24
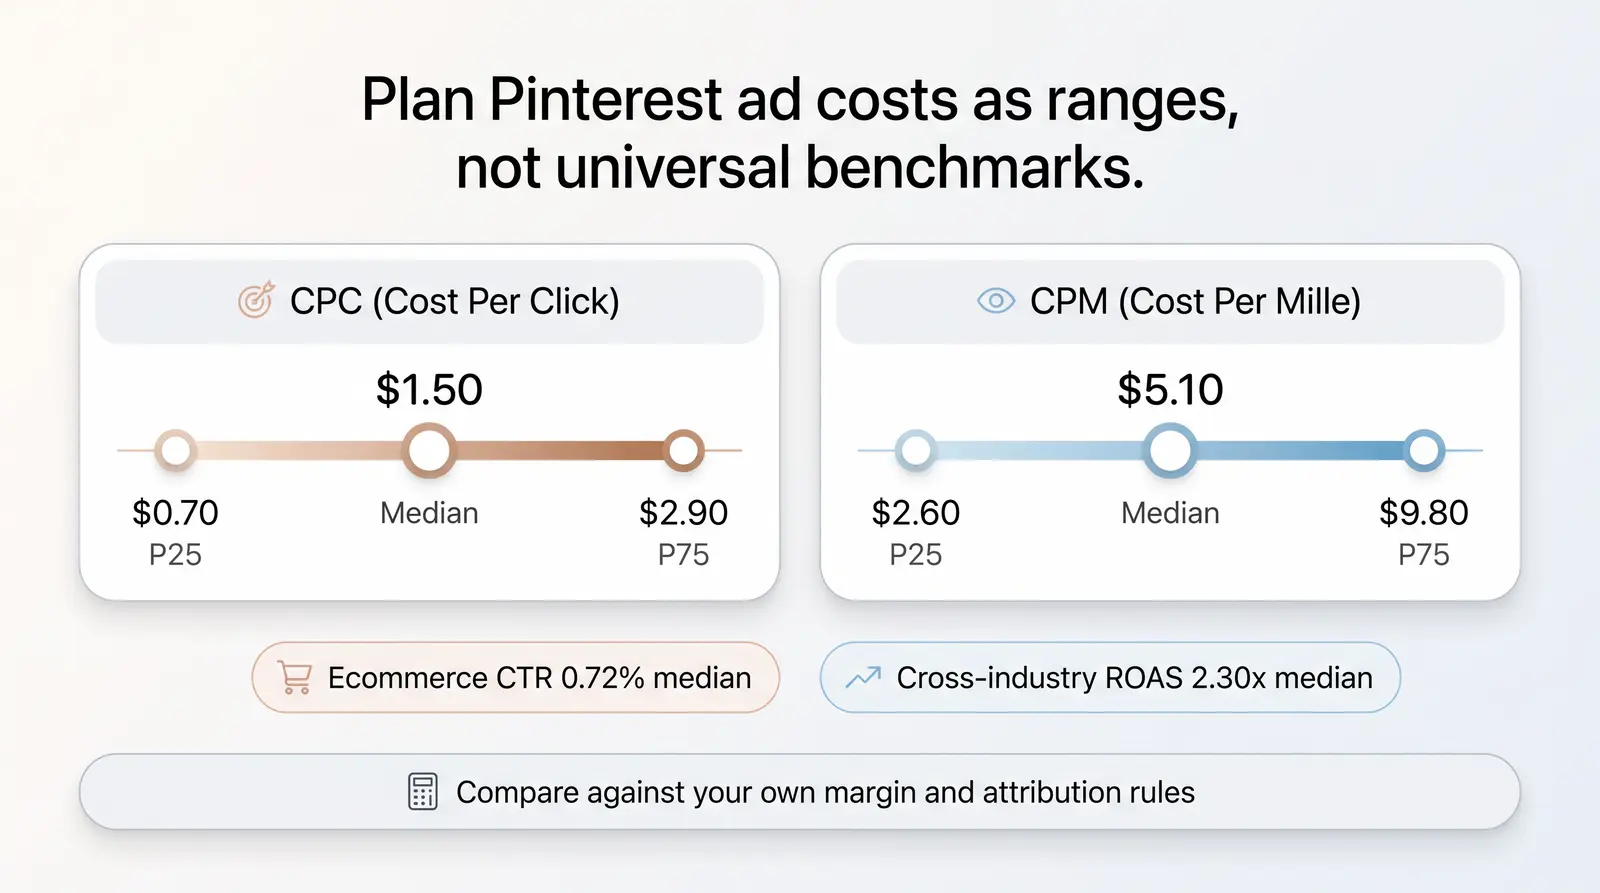
Pinterest does not publish a universal dollar CPC, CPM, CPA, or industry ROAS benchmark. Costs vary by objective, country, season, creative, audience, and optimization event. The evidence type below distinguishes external reference points from first-party tests.
| Benchmark or format | Reported CPC / CPM / outcome | Scope and year | How to use it |
|---|---|---|---|
| Cross-industry Pinterest ads | Median CPC $1.50; P25 $0.70; P75 $2.90 | Benchmarketing 2026 dataset | Directional U.S. benchmark, not a Pinterest-published rate. |
| Cross-industry Pinterest ads | Median CPM $5.10; P25 $2.60; P75 $9.80 | Benchmarketing 2026 dataset | Use a range, not a single planning assumption. |
| Cross-industry Pinterest ads | CTR 0.50%; CVR 0.80%; ROAS 2.30x median | Benchmarketing 2026 dataset | Dataset benchmark, not a promise of profitability. |
| Ecommerce Pinterest ads | CTR 0.72% median; P25 0.36%; P75 1.27% | Benchmarketing 2026 dataset | Closest published vertical line, still not jewelry-specific. |
| EU-oriented agency guide | CPC €0.45-€1.30; CPM €3-€8 | TrackBee guide, 2026 | Indicative range only; no public audit of the underlying accounts. |
| Q2 2025 same-client advertisers | Spend +66%; impressions +49%; average CPM +11% | Tinuiti managed-program sample | Useful direction on auction pressure, not an absolute CPM. |
| Q3 2025 same-client advertisers | Spend +63%; impressions +52%; CPM +7% | Tinuiti managed-program sample | Confirms continued demand for Pinterest inventory. |
| Top of Search ads | CTR +29%; new clickers +32% | Pinterest testing, 2025 | Format test, not a category benchmark. |
| Catalog feed with 2,500+ products | 3x+ higher ROAS association | Pinterest, 2025 | Association, not causal proof. |
| Product Pins tagged in scenes/brand imagery | 70% higher shopping intent | Pinterest, 2025 | Creative comparison; intent definition not disclosed. |
Sources: Benchmarketing, TrackBee, Tinuiti, and Pinterest product materials. External benchmarks and first-party tests are intentionally separated. 11 12 13 14 24
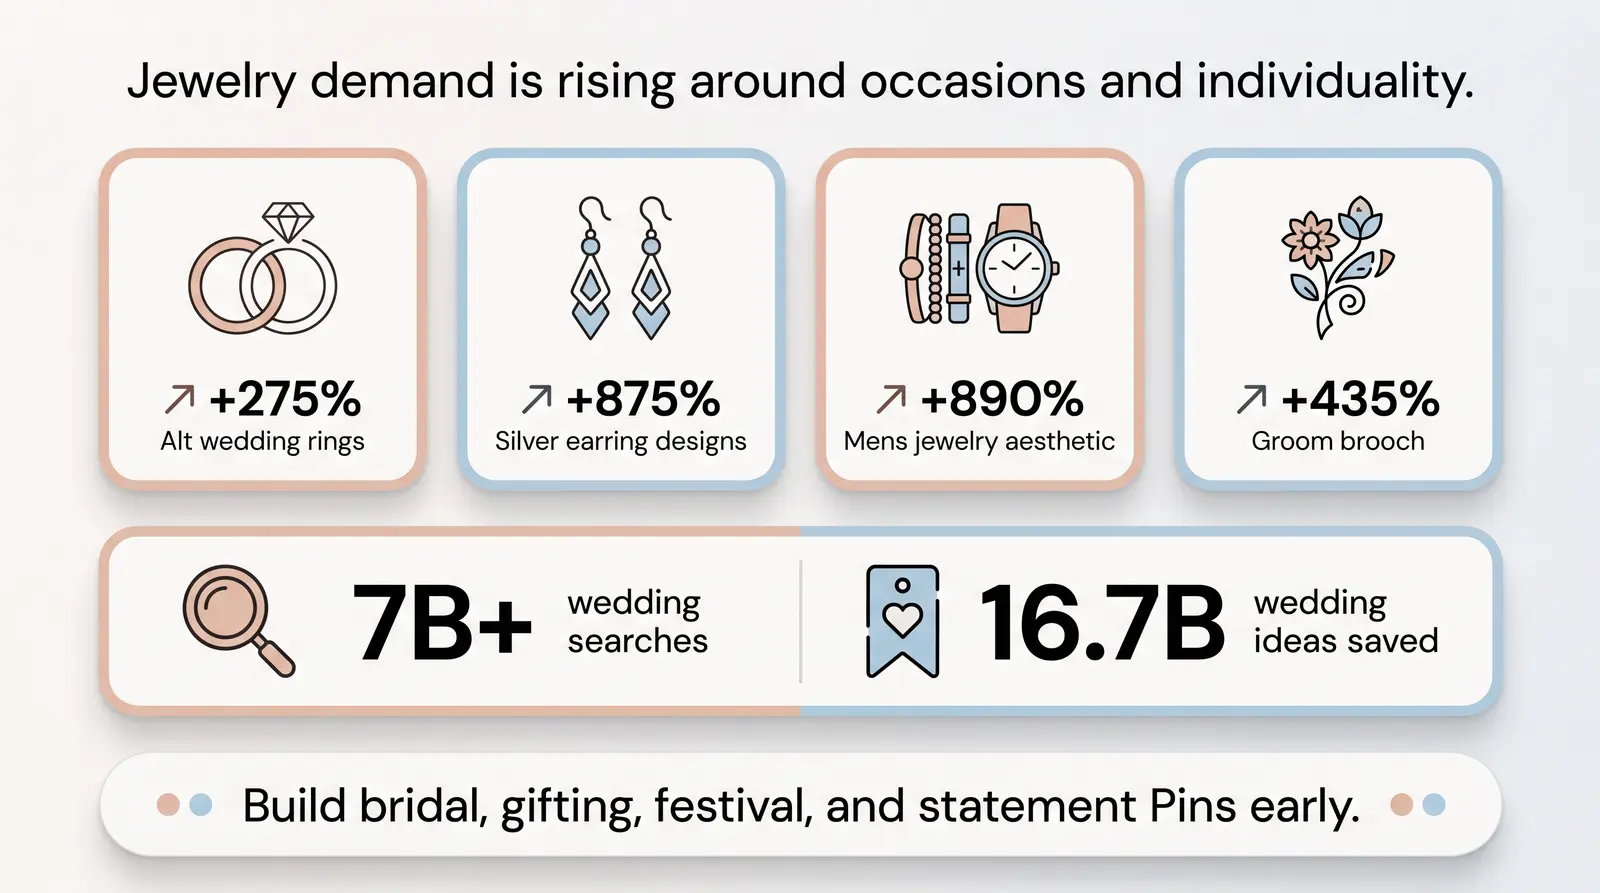
The useful jewelry evidence is luxury-research behavior, bridal-scale demand, explicit search signals, and named advertiser outcomes. Pinterest does not publish a reliable category share, jewelry referral conversion rate, or jewelry AOV, so this article does not invent them.
| Jewelry or occasion signal | Reported data point | Year | Evidence caveat |
|---|---|---|---|
| Pinterest luxury shoppers who bought luxury watches/jewelry | More than 2 in 5 | 2023 | PA Consulting survey commissioned by Pinterest. |
| Relative likelihood of having bought luxury watches/jewelry | Nearly 75% higher than shoppers on other platforms | 2023 | Commissioned survey comparison. |
| Luxury shoppers using Pinterest to research luxury brands/products | 3 in 5 | 2023 | Commissioned survey. |
| Pinterest-defined luxury audience under 35 | 70% | 2023 | Audience defined by luxury brand searches or saves. |
| Pinterest-defined luxury audience who are women | 4 in 5 | 2023 | Same internal audience definition. |
| Wedding-related searches | 3+ billion | 2024 | Global annual Pinterest report. |
| Wedding ideas saved | 10+ billion | 2024 | Global annual Pinterest report. |
| Wedding-related searches | 3.8+ billion | 2025 | Global annual Pinterest report. |
| Wedding ideas saved | 13.4+ billion | 2025 | Global annual Pinterest report. |
| Wedding-related searches | 7+ billion | 2026 report | Pinterest’s reported prior-year total. |
| Wedding ideas saved | 16.7+ billion | 2026 report | Pinterest’s reported prior-year total. |
| Alt wedding rings searches | +275% | 2026 | Internal search trend. |
| Men’s jewelry aesthetic searches | +890% | 2026 | Internal search trend. |
| Silver earrings design searches | +875% | 2026 | Internal search trend. |
| Groom brooch searches | +435% | 2026 | Internal search trend. |
| Vintage wedding rings, 1920s searches | +1,458% | 2025 | Internal search trend. |
| Unique wedding ring stack searches | +1,656% | 2025 | Internal search trend. |
| Pearl jewelry wedding searches | +560% | 2024 | Internal search trend. |
| Gold bridal earrings searches | +2,000% | 2024 | Internal search trend. |
| Maximalist jewelry searches | +3,460% | 2024 | Internal search trend. |
| Ethereal jewelry searches | +986% | 2025 | Internal festival trend. |
| Brooch for men suit searches | +90% | 2026 forecast | Normalized global English-language search comparison. |
| Maximalist accessories searches | +105% | 2026 forecast | Same normalized search comparison. |
| Heirloom jewelry searches | +45% | 2026 forecast | Same normalized search comparison. |
| Gold cuff searches | +50% | 2026 forecast | Same normalized search comparison. |
| Bug jewelry searches | +60% | 2026 forecast | Same normalized search comparison. |
Sources: Pinterest luxury study, wedding reports, seasonal reports, and Pinterest Predicts. Search changes are internal trends, not market-size estimates. 15 16 17 25
For merchant-reported outcomes, keep the scope narrow. Pinterest’s Q3 2025 Conversion Lift Study says Canadian fine-jewelry brand Mejuri achieved 46% higher ROAS and 62% more conversions from a dedicated Performance+ campaign versus business as usual. Pinterest also reports that Pandora recorded a 7.5% average incremental ROAS lift across the U.S., UK, and Germany, and a 47% ROAS increase between H1 and H2 2025 after deploying Performance+ more broadly. These are named-advertiser outcomes, not a jewelry-industry average. 18 19
The seasonality pattern is useful for merchandising. Pinterest says Coachella-related searches begin spiking at the start of the year, while wedding queries span years of planning and inspiration. For a jewelry brand, that suggests building festival, bridal, gifting, and statement-accessory Pins before the demand spike, not when the retail calendar says the occasion has already arrived. 15 26
In our experience working with jewelry sellers at Branvas, product photography that shows scale, layering, finish, and a real styling context travels further than a product cutout alone. The platform evidence supports that direction: Pinterest says product Pins tagged in scene or branded imagery generated 70% higher shopping intent than standalone product Pins. 14
Sellers who want to turn Pinterest discovery into actual sales need a product line that is visually optimized, consistently branded, and ready to ship. Branvas helps jewelry sellers launch that foundation with private-label products, custom packaging, and blind fulfillment.
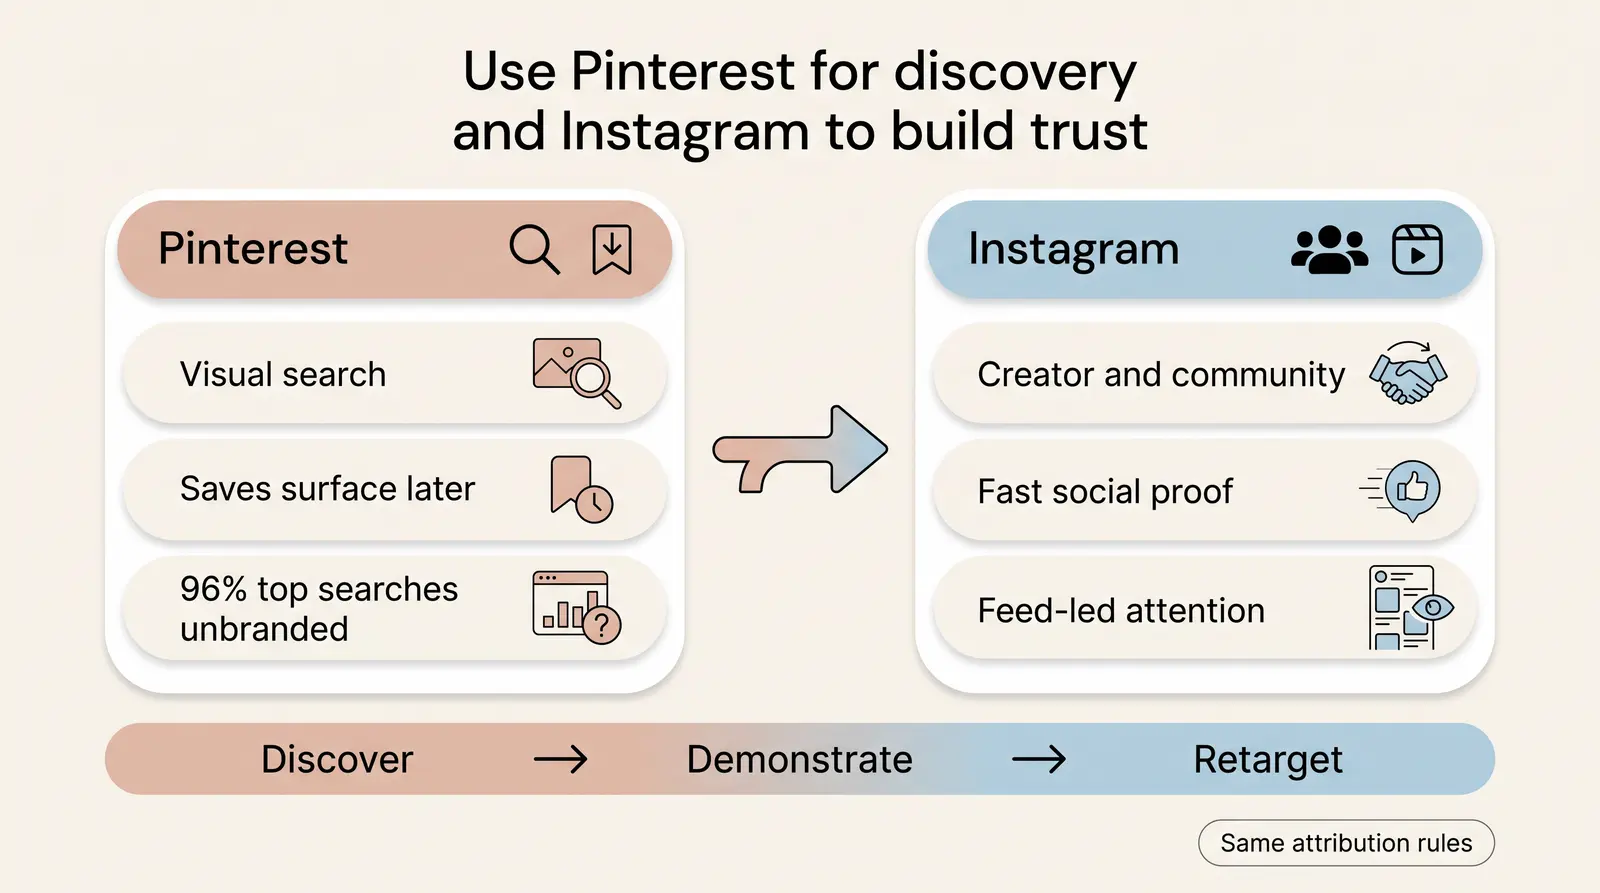
The question is not which platform “wins,” but which job it is asked to do. No public apples-to-apples source supports a universal conversion-rate or AOV winner.
| Dimension | Jewelry-selling implication | ||
|---|---|---|---|
| Primary user behavior | Visual search, saving, and idea refinement. Pinterest says 96% of top searches are unbranded. 10 | Feed, creator, community, and short-form-video interaction. | Use Pinterest to earn discovery around an intent theme; use Instagram to deepen trust and social proof. |
| Purchase-intent signal | Search query, board save, product Pin, outbound click. | Engagement, profile visit, story interaction, product discovery. | Score each channel on the signals you can measure in your own analytics. |
| Organic reach longevity | Searchable Pins and saves can surface later. | Creative usually has a shorter feed-led attention cycle. | Build evergreen collection, bridal, and gift-intent Pins alongside faster social creative. |
| Ad auction benchmark | Public indicative 2026 benchmarks: $5.10 median CPM and $1.50 median CPC. 11 | No directly comparable public benchmark should be substituted without matching geography and objective. | Compare account-level CPM, CPC, CVR, and contribution margin, not internet averages. |
| AOV comparison | No reliable public platform-wide AOV. | No reliable public apples-to-apples AOV. | Track AOV and repeat purchase by source in the store, not in a slide deck. |
| Best jewelry content | Search-led styling ideas, collections, wedding looks, gift guides, product scenes. | Founder, customer, stylist, creator, and video-led proof. | Adapt the same product truth into channel-native creative. |
| Audience fit | U.S. ad audience was 71.4% female in late 2025; broader search trends include men’s jewelry. 5 15 | Fit depends heavily on creator and community mix. | Do not restrict Pinterest to women’s jewelry alone. |
| Measurement design | Longer planning path makes full-funnel and server-side event capture important. 9 | Fast engagement metrics can coexist with slower assisted conversion. | Use the same attribution definition before reallocating budget. |
The most defensible allocation is usually complementary. Pinterest can create a pool of high-intent, visually engaged visitors. Instagram can demonstrate brand personality, customer proof, and creator credibility. Retargeting should be judged by incremental contribution, not by whichever platform claims the last touch.
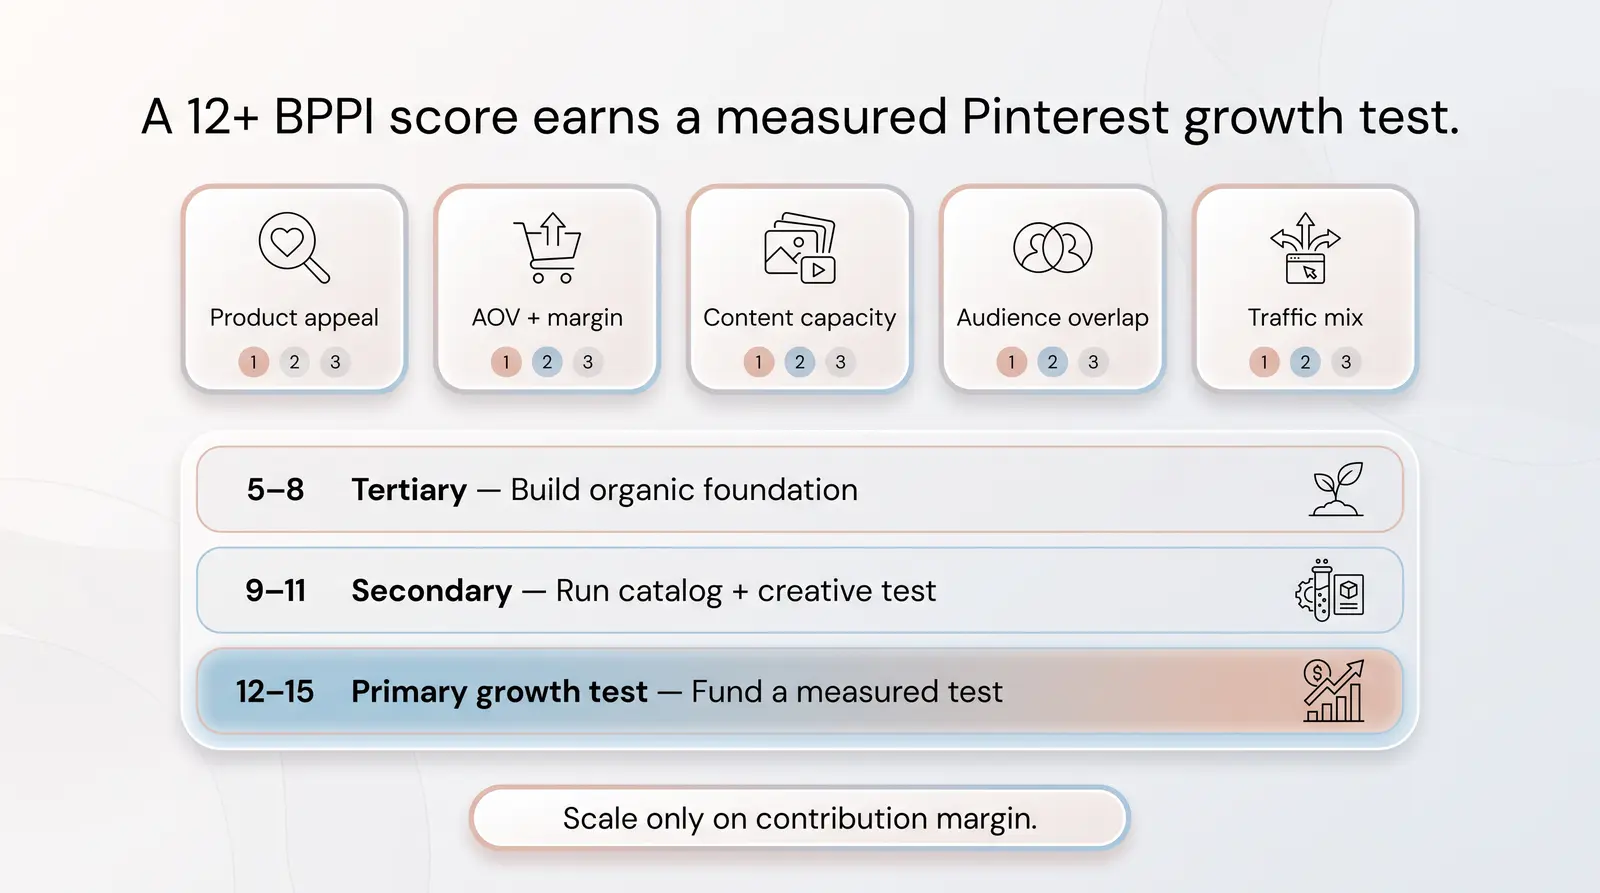
The Branvas Pinterest Purchase-Intent Scoring Model, or BPPI Score, is a 15-point rubric for deciding whether Pinterest should be a primary, secondary, or tertiary acquisition channel. It tests product, creative, audience, and traffic fit.
| BPPI dimension | 1 point | 2 points | 3 points |
|---|---|---|---|
| Product visual appeal | Functional or hard to understand in a static image | Attractive with explanation | Immediately legible, styleable, save-worthy product |
| Average order value and margin | AOV or gross margin leaves little paid-media room | Some room for a test, but CPA ceiling is tight | Healthy AOV and margin can fund creative testing and fulfillment |
| Content production capacity | Infrequent product imagery; no catalog discipline | Monthly content with some product coverage | Consistent vertical creative, scenes, product data, and seasonal collections |
| Pinterest audience overlap | Target buyer has limited fit with Pinterest planning behaviors | Partial fit by occasion or style | Strong overlap with women 25-49, bridal, gifting, home, fashion, or men’s accessory discovery |
| Existing traffic-source mix | Highly dependent on search or email already | One paid-social source dominates | Over-reliance on short-lived social reach; clear need for evergreen discovery |
| Total BPPI Score | Pinterest investment tier | Recommended action |
|---|---|---|
| 5-8 | Tertiary | Maintain an organic foundation and revisit after product or content changes. |
| 9-11 | Secondary | Run a structured catalog and creative test alongside the core acquisition channel. |
| 12-15 | Primary growth test | Fund a measured Pinterest test, then scale only against contribution margin and validated incrementality. |
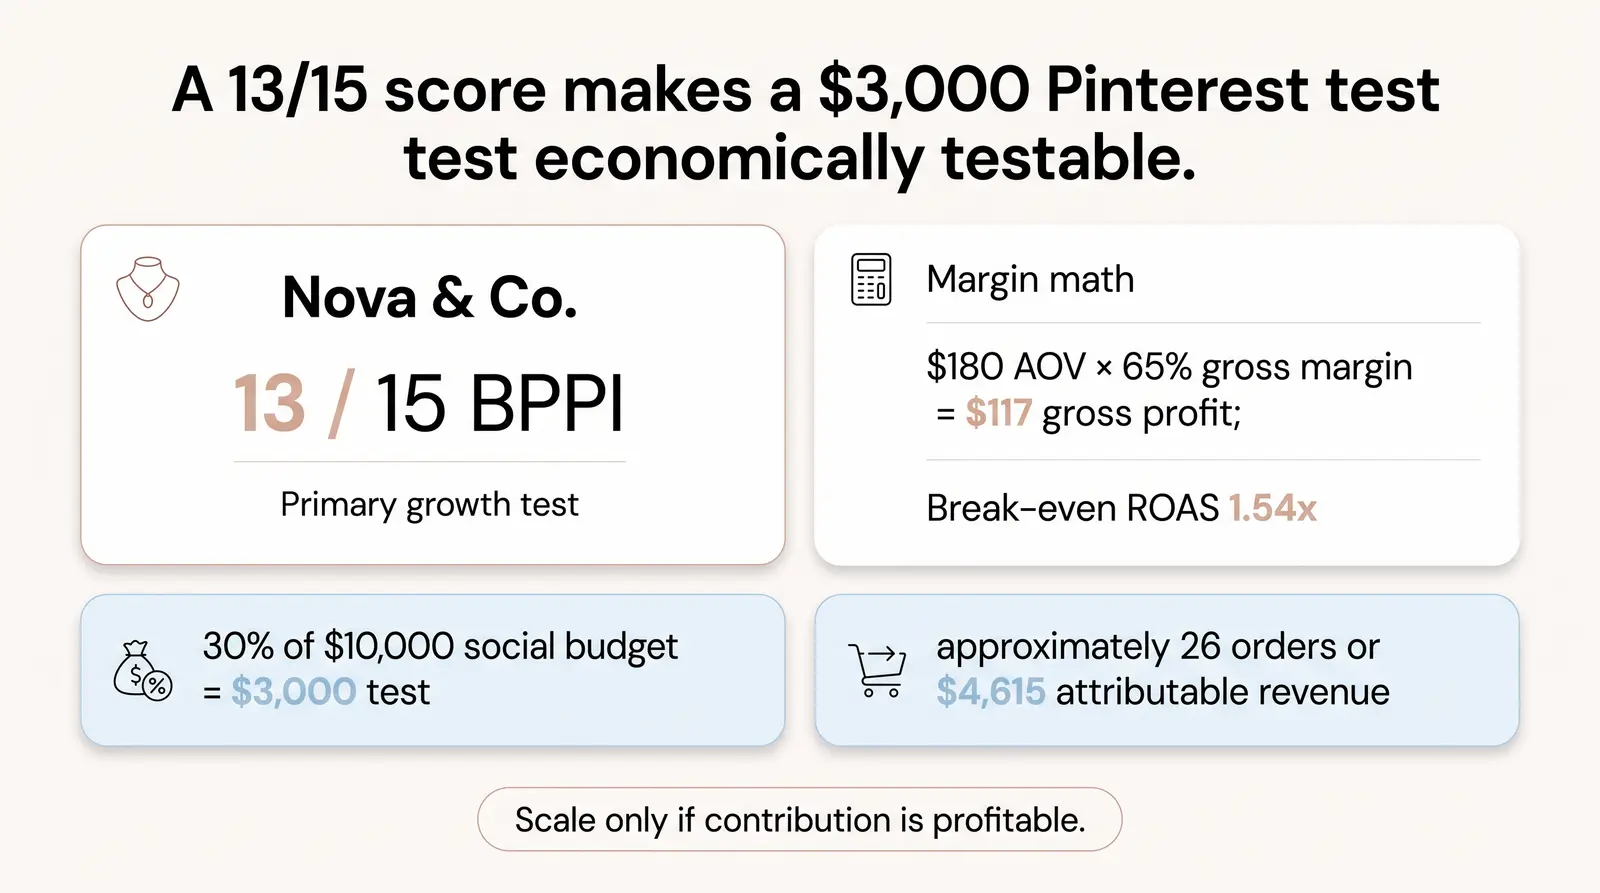
Consider Nova & Co., a fictional minimalist fine-jewelry brand with a $180 AOV, women aged 28-44 as its core audience, twice-monthly styling content, and a Meta- and Instagram-heavy traffic mix. It is considering 30% of a $10,000 monthly social budget, or $3,000, for Pinterest.
First, Nova scores the BPPI model. Its visual appeal is a 3 because necklaces, stacks, and gifting moments read clearly in a Pin. Its AOV and margin score a 3, assuming a modeled 65% gross margin before advertising. Content capacity scores a 2 because twice-monthly production is usable but not yet a deep seasonal library. Audience overlap scores a 3, supported by the public age, gender, and income profile. Traffic-source mix scores a 2 because it has a Meta dependency but some existing search and email strength. The total is 13 out of 15.
A score of 13 places Pinterest in the primary growth-test tier. It does not automatically justify a permanent 30% allocation. It does justify a deliberate $3,000 test with a catalog, clear product landing pages, the Pinterest Tag plus Conversions API, and a creative plan that separates bridal, gift, stack, and everyday-minimalist intent. Pinterest’s own measurement material indicates that adding Conversions API can materially change attributed conversion volume, so Nova should not compare a new Pinterest campaign against a fully instrumented Meta account using incomplete Pinterest tracking. 9
With a hypothetical 65% gross margin, $180 in revenue creates $117 of gross profit before advertising. Nova’s simple break-even ROAS is 1.54x, calculated as $1 divided by 0.65. Its $3,000 test therefore needs roughly 26 orders at the $117 ceiling, or $4,615 in attributable revenue, before overhead and returns. That calculation must be rebuilt from Nova’s actual landed cost, fulfillment, returns, and contribution margin.
Nova should not forecast a 62% conversion lift because Mejuri saw one, or a 47% ROAS gain because Pandora reported one. It should test whether its catalog can generate orders at or below its allowable CPA over a defined attribution window. Retain or expand the 30% share only if contribution is profitable; if qualified traffic is weak, revisit the query, creative, catalog quality, and BPPI inputs before increasing bids. 18 19
For teams building the economics, Branvas’s profit calculator can structure the margin conversation. Private-label catalog options, consistent packaging, and blind fulfillment can support a coherent Pinterest-ready collection.
Ready to launch a Pinterest-ready jewelry brand? Branvas handles sourcing, branding, and fulfillment, so you can focus on content and community. Explore Branvas →
Pinterest reported 640 million global monthly active users in Q2 2026, up 11% year over year. Its reported regional totals were 106 million in the U.S. and Canada, 157 million in Europe, and 377 million in the rest of the world. MAUs are Pinterest’s company metric and should not be confused with advertising-reach estimates. 1
There is no trustworthy public, platform-wide conversion-rate figure that permits a like-for-like Pinterest versus Instagram, Facebook, or TikTok comparison. Different studies use different countries, campaign objectives, attribution windows, stores, and event definitions. Use your own product-page conversion rate, allowable CPA, and source-level contribution margin. Pinterest-published case studies can establish relevance, but they are not an industry benchmark. 18 19
Pinterest is a credible channel to test for jewelry when the assortment is visually clear and tied to discovery occasions such as bridal, gifting, layering, or seasonal styling. Pinterest’s 2026 wedding report recorded 7+ billion wedding-related searches and 16.7+ billion wedding ideas saved, while specific jewelry terms showed large search growth. The platform also publishes positive named jewelry advertiser outcomes for Mejuri and Pandora, which should be treated as case studies rather than guarantees. 15 18 19
Pinterest does not publish a universal official CPC or CPM. One 2026 external benchmark lists a $1.50 median CPC and $5.10 median CPM, with wide percentile ranges. An EU-oriented agency guide lists €0.45-€1.30 CPC and €3-€8 CPM. Both are directional references, not quoted rates. Your cost will vary by market, bid strategy, creative, objective, audience, and season. 11 12
Pinterest is typically stronger for visual search, unbranded product discovery, saves, and evergreen intent content. Instagram is typically stronger for creator relationships, community, and fast social proof. For jewelry, the most effective plan often uses Pinterest to create qualified discovery and Instagram to reinforce trust, then measures both against the same contribution-margin and attribution rules. Pinterest’s reported 96% unbranded top-search rate is the clearest quantitative distinction in the public evidence. 10