Learn five proven levers to lower ecommerce customer acquisition cost, from niche targeting and CRO to AOV expansion, retention, and channel diversification.
Published:
August 14, 2026
Author:
Yi Cui
Rising ad costs are the silent profit-killer for online stores.
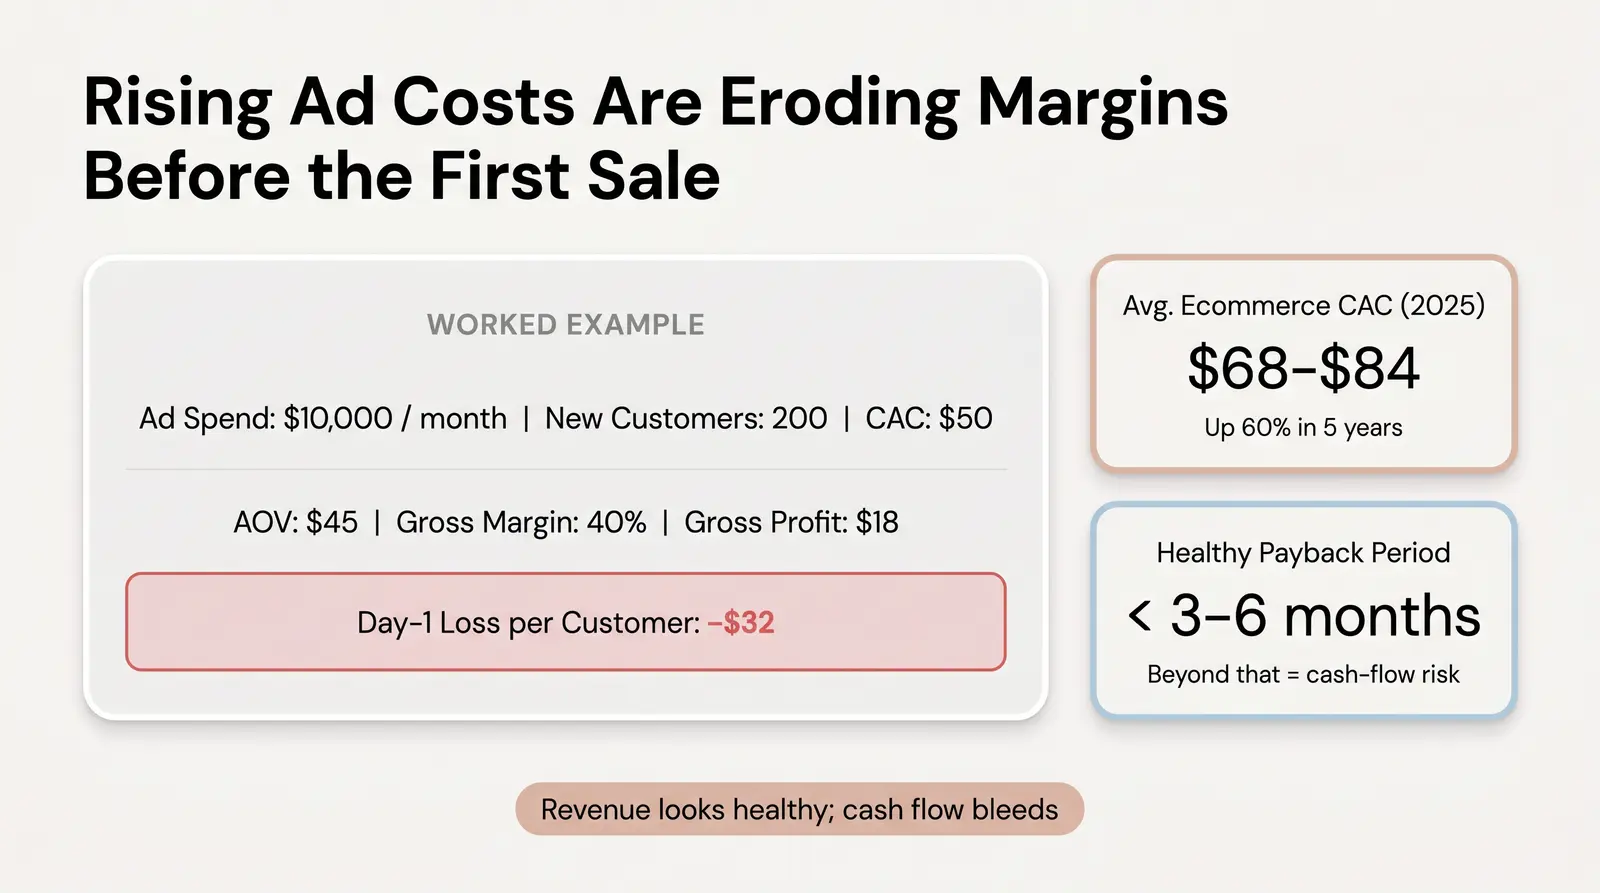
What used to be a temporary Q4 spike is now a structural reality. The average ecommerce customer acquisition cost hit $68 to $84 in 2025, up a staggering 60% from five years ago [1]. Meta CPMs have surged 89% since 2020. Google Ads CPCs for retail saw roughly a 20% increase in a single year [2]. If you are relying purely on paid ads to sell undifferentiated products, you are likely feeling the squeeze right now.
The formula for Customer Acquisition Cost is simple: CAC = Total Sales and Marketing Spend divided by Number of New Customers Acquired.
If you spend $10,000 per month on ads and acquire 200 new customers, your CAC is $50. That number means nothing on its own.
What matters is your CAC Payback Period, which is the time it takes for a customer's gross profit to cover the cost of acquiring them. For a healthy ecommerce brand, the payback period should be under 3 to 6 months [3]. Stretch it beyond that and you have a cash-flow problem, even if your revenue looks healthy on paper.
Here is a worked example. A store spends $10,000 per month on ads and acquires 200 customers. CAC is $50. Their AOV is $45 and gross margin is 40%, so they make $18 in gross profit on the first purchase. They are underwater by $32 on day one. Unless that customer returns, the business is bleeding cash every single month it runs ads.
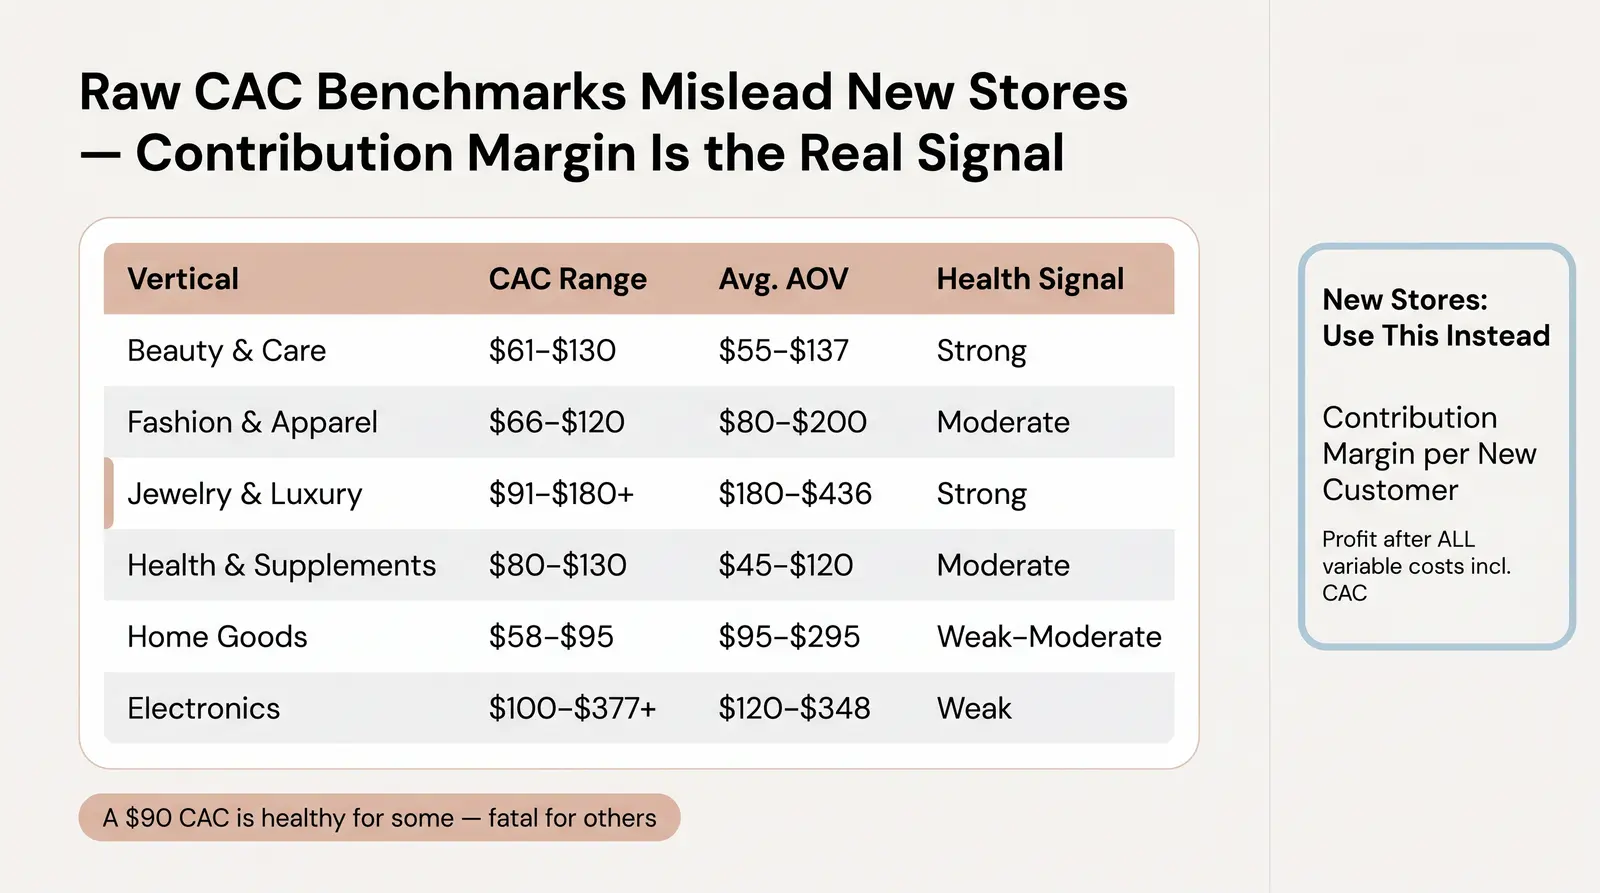
When founders ask what a good CAC looks like, the honest answer is: it depends entirely on your vertical, your margins, and your customer lifetime value (LTV). Here is a look at current 2025 to 2026 benchmarks across key ecommerce categories [4] [5] [6]:
| Vertical | Avg. CAC Range | Avg. AOV | Typical Gross Margin | CAC-to-AOV Ratio Health Signal |
|---|---|---|---|---|
| Beauty and Personal Care | $61 to $130 | $55 to $137 | 65% to 85% | Strong: high margin and repeat purchase |
| Fashion and Apparel | $66 to $120 | $80 to $200 | 50% to 65% | Moderate: high return rates eat margin |
| Jewelry and Luxury | $91 to $180+ | $180 to $436 | 60% to 85%+ | Strong: high AOV absorbs CAC |
| Health and Supplements | $80 to $130 | $45 to $120 | 65% to 78% | Moderate to Strong: requires subscription |
| Home Goods and Furniture | $58 to $95 | $95 to $295 | 40% to 55% | Weak to Moderate: high shipping costs |
| Electronics | $100 to $377+ | $120 to $348 | 30% to 50% | Weak: low margin, rare repeat purchase |
(Data aggregated from First Page Sage, Eightx, and Triple Whale 2025/2026 reports. Some ranges reflect blended vs. paid-only variance.)
Here is the contrarian truth most CAC guides skip: most CAC benchmarks are misleading for new store owners.
They average the numbers of mature brands with high repeat-purchase rates alongside new entrants who have not yet built any retention. A $90 CAC is perfectly healthy for an established beauty brand with a 4x LTV. It is a death sentence for a new dropshipper selling $30 lip gloss.
For new store owners, raw CAC is the wrong north star. The better metric is contribution margin per new customer, which is the profit you actually pocket from the first sale after subtracting all variable costs including the CAC itself. If that number is negative, you are not just unprofitable, you are paying to acquire customers who may never come back.
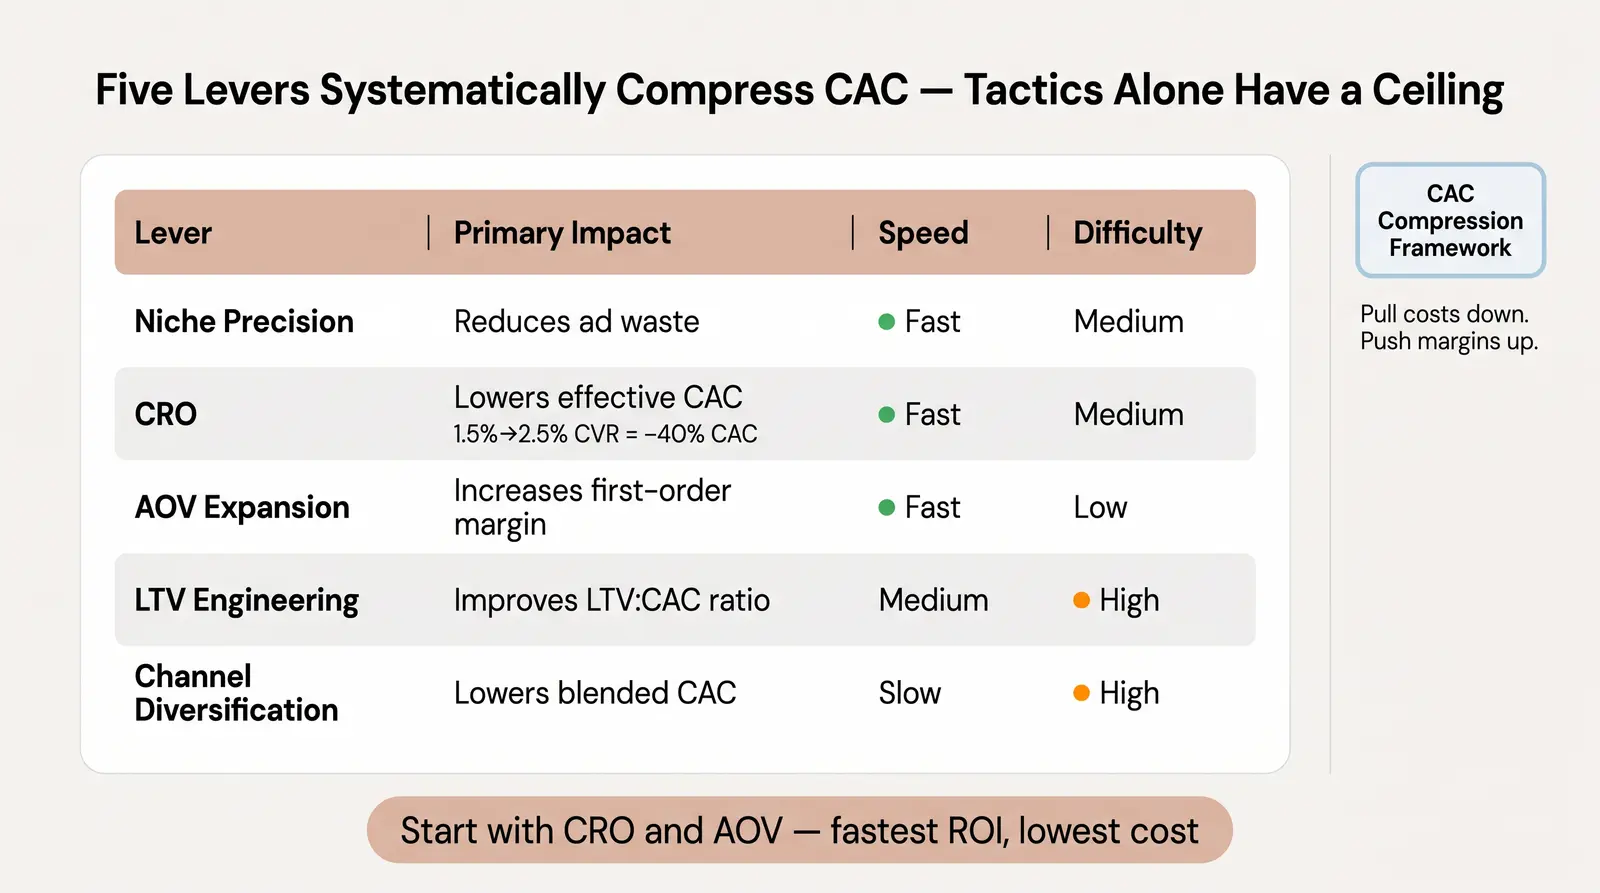
In our experience at Branvas, lowering CAC is not about finding a secret ad hack. It requires a systematic approach. We call it the Branvas CAC Compression Framework, a five-lever model designed to pull acquisition costs down while pushing margins up.
Narrow your audience to reduce wasted impressions.
Broad targeting is expensive because you pay to reach people who will never buy. Specific tactics include building lookalike audiences from your highest-LTV customers, aggressively using exclusion lists so you stop paying to show ads to recent buyers, and interest stacking for micro-niches. The shift from "jewelry for women" to "minimalist zodiac jewelry for millennial women" is not just a creative choice. It is a targeting efficiency decision that directly lowers your cost per click and improves your conversion rate at the same time.
CAC falls automatically when more of your existing traffic converts.
The average ecommerce conversion rate is roughly 2% globally [7]. If you can move your conversion rate from 1.5% to 2.5%, your CAC drops by approximately 40% with zero additional ad spend. Specific tactics include ensuring above-the-fold clarity on product pages, placing social proof near the "Add to Cart" button, and reducing checkout friction with express payment options like Shop Pay or Apple Pay. Every percentage point of conversion rate improvement is free money.
Higher AOV makes the same CAC profitable.
If you pay $40 to acquire a customer and they spend $30, you lose money. If they spend $90, you make money on the first order. Tactics include product bundles, post-purchase upsells, cross-sells in the cart, and curated collections that encourage multi-item purchases. This is where niche positioning starts to pay off structurally. Customers who feel a brand speaks directly to them are far more likely to buy a complete set than a single item.
CAC only makes sense relative to Lifetime Value (LTV).
The most expensive customer is the one who buys once and never returns. Build post-purchase email flows that engage buyers in the first 7 to 30 days. Implement loyalty mechanics that reward repeat purchases. Use subscription or replenishment triggers where the product category allows. If you increase your customer return rate by even 10%, your blended CAC drops significantly because organic repeat revenue starts subsidizing your paid acquisition.
Reduce your dependency on paid ads.
Meta and Google will take all of your budget if you let them. Diversify by investing in SEO content, influencer gifting programs, user-generated content (UGC), and email list building. Organic channels have a longer payback period, but they lower your blended CAC over time in a way paid channels never can. The 50th blog post you publish still drives traffic from the first one. Paid ads stop the moment you stop spending.
Branvas CAC Compression Framework: Summary Table
| Lever | Primary Impact | Time-to-Impact | Difficulty | Recommended For |
|---|---|---|---|---|
| Niche Precision | Reduces ad waste | Fast (days) | Medium | High-spend ad accounts |
| CRO | Lowers effective CAC | Fast (weeks) | Medium | Stores with high traffic but low sales |
| AOV Expansion | Increases first-order margin | Fast (weeks) | Low | Stores with multiple complementary SKUs |
| LTV Engineering | Improves LTV:CAC ratio | Medium (months) | High | Brands with consumable or collectible items |
| Channel Diversification | Lowers blended CAC | Slow (months+) | High | Brands overly reliant on Meta or Google |
You can optimize your checkout and tweak your ad copy all day. Tactical CAC optimizations have a ceiling.
The real, durable lever is product-market differentiation. You need to sell something that a specific audience wants specifically, not just another commodity they scroll past. When your product is indistinguishable from a dozen others, the only lever you have is price. And competing on price in a paid-ads environment is a race you will eventually lose to someone with deeper pockets or lower cost of goods.
Curated, private-label niche products, especially in categories like jewelry and accessories, structurally solve the CAC problem for three reasons. First, they target audiences who are buyers, not browsers, because the product speaks directly to a specific identity or interest. Second, higher perceived value supports premium pricing, which drives higher AOV and gross margins that often reach 60% to 80%+ in jewelry [6]. Third, a distinct brand identity generates organic word-of-mouth and repeat purchases that paid ads alone never produce.
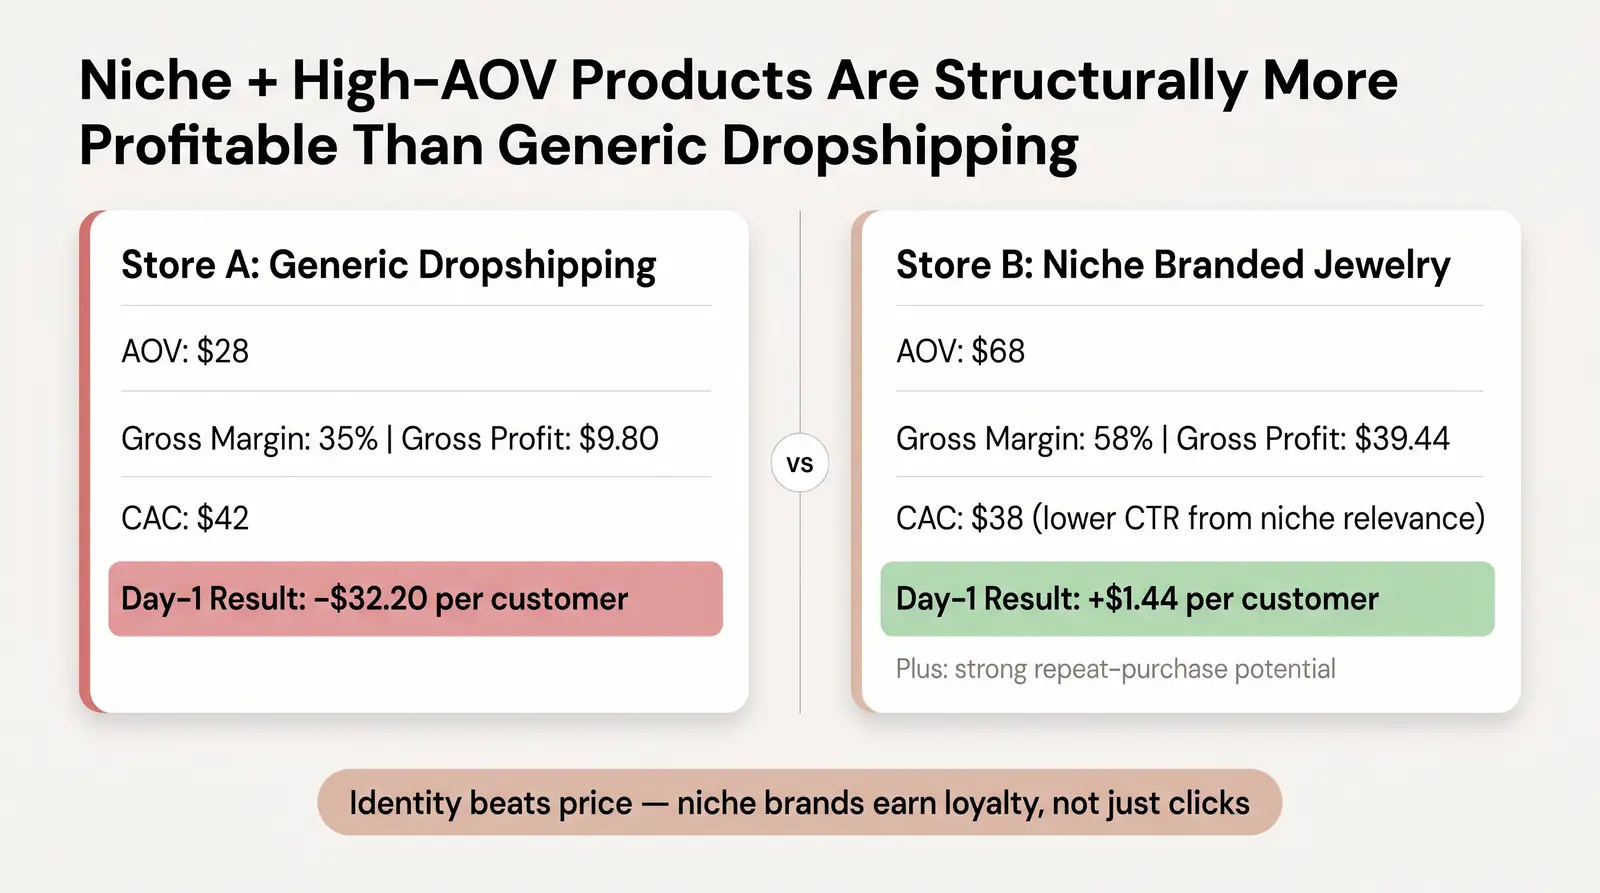
The unit economics tell the story clearly. Compare two stores selling jewelry:
Store A: Generic Dropshipping Jewelry
Store B: Private-Label Branded Niche Jewelry (e.g., zodiac jewelry for millennial women)
Store B is not just more profitable. It is structurally more defensible. The brand has an identity that earns loyalty, not just clicks.
This is exactly the shift we built Branvas to enable. We kept seeing talented sellers lose the paid-ads arms race selling undifferentiated products, and we wanted to give them a faster path to a brand that competes on identity, not just price. If you want to model your own unit economics before committing to a niche, use our free profit calculator to see how your CAC-to-margin ratio changes with different AOV and margin assumptions.
If you are ready to stop competing on price and start building a brand that earns its margin, explore how Branvas works at branvas.com/how-it-works.
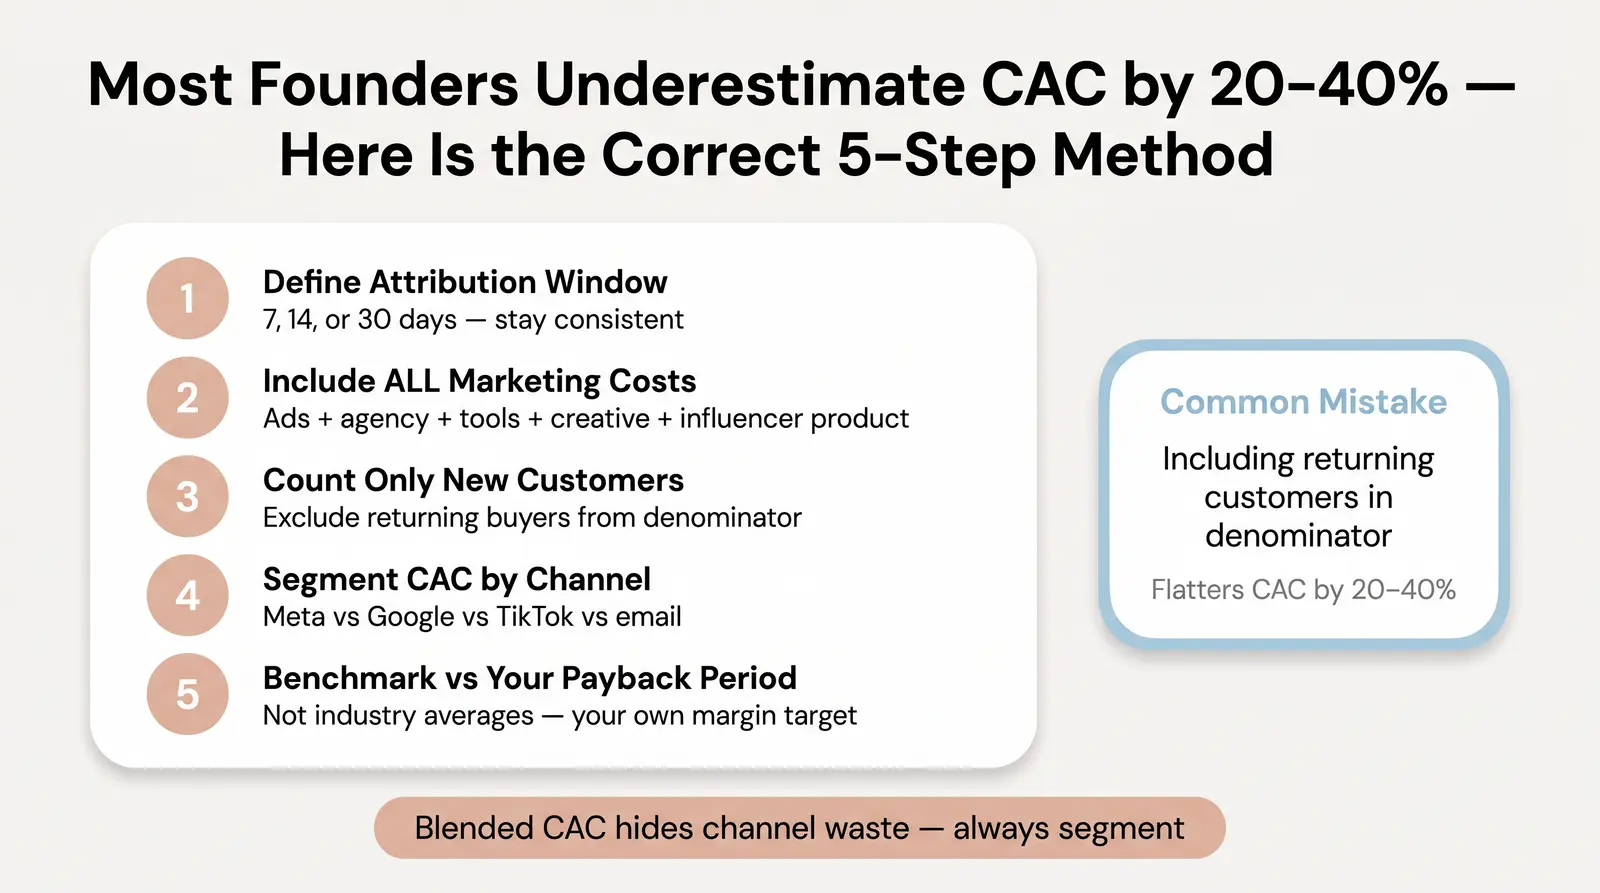
Many founders miscalculate CAC by only counting their ad spend and ignoring agency fees, creative production costs, and marketing tools. This creates a false sense of security and leads to scaling decisions based on numbers that are 20% to 40% too optimistic [1].
Here is the correct approach:
Step 1: Define your attribution window. Decide whether you are measuring a 7-day, 14-day, or 30-day window. Consistency matters more than the window you choose.
Step 2: Include all sales and marketing costs. Your numerator must include paid ad spend, agency retainers, marketing software subscriptions, creative production costs, and the value of first-purchase discount codes. If you sent $500 in product to influencers this month, that is acquisition spend too.
Step 3: Count only new customers. Do not include returning customers in your denominator. If you spend $10,000 and acquire 100 new customers alongside 50 returning ones, your CAC is $100, not $66. Including returning customers flatters the number and causes you to systematically underestimate your true acquisition cost.
Step 4: Segment CAC by channel. Track your blended CAC for overall business health, and your channel-specific CAC (Meta vs. Google vs. TikTok vs. email) to identify where your budget is working and where it is leaking.
Step 5: Benchmark against your own payback period target. Compare your CAC against your gross margin and your target payback period, not just industry averages. A $90 CAC with a 6-month payback might be perfectly acceptable for your business model.
Tools like Shopify's native analytics, Triple Whale, and Northbeam can help you track multi-touch attribution and get a clearer picture of which channels are actually driving new customers.
For ecommerce store owners who are building their first branded product line, the Branvas solutions page for ecommerce sellers walks through how private-label positioning affects these numbers in practice. And if you are still in the research phase, the Branvas Academy has resources specifically for founders working through their unit economics for the first time.
What is a good CAC for an ecommerce store?
A good CAC depends entirely on your vertical and gross margins. For high-margin categories like jewelry or beauty, a CAC of $60 to $100 is healthy if your AOV and repeat-purchase rates are strong. The better question is whether your CAC allows for a payback period under 6 months. If it does not, you need to either lower CAC, raise AOV, or improve retention before scaling ad spend.
How do I calculate my CAC payback period?
Divide your CAC by your gross profit per order. If your CAC is $60 and your gross profit per order is $20, it takes 3 orders to break even on that customer. If your average customer buys twice per year, your payback period is 18 months. For most ecommerce businesses, a payback period under 6 months is considered healthy, and under 3 months is excellent [3].
Why is my CAC increasing even though my ad spend is the same?
CAC increases structurally for reasons largely outside your control. Meta CPMs have risen 89% since 2020 [2]. Google Ads CPCs for retail increased roughly 20% in a single year. Privacy changes from Apple's iOS updates degraded targeting precision, forcing platforms to show your ads to more people to get the same number of conversions. If your CAC is rising, it is not necessarily a sign of poor execution. It is a sign that the paid-ads environment has fundamentally changed.
Does a higher AOV always mean lower effective CAC?
A higher AOV does not lower the raw dollar cost of acquiring a customer, but it dramatically improves your CAC-to-margin ratio. If your CAC is $40 and your gross profit per order rises from $15 to $45, you go from losing money on every customer to being profitable on the first sale. Higher AOV is one of the fastest ways to make an existing CAC sustainable without changing your ad strategy at all.
Can organic traffic realistically replace paid ads for customer acquisition?
Organic traffic is rarely a fast replacement for paid ads, but it is the most reliable way to lower your blended CAC over time. Brands that build strong SEO, UGC programs, and email lists use paid ads to amplify their reach rather than to survive. The compounding nature of organic content means your cost per acquisition from those channels declines with every piece of content you publish, which is the opposite of what happens with paid ads. Browse the Branvas catalog to see how niche product selection supports organic brand-building from day one.
[1] Retainful: Customer Acquisition Cost in Ecommerce: The Complete Guide
[2] Search Engine Land: CPC Inflation: How Fast Are Google Ads Costs Rising?
[3] Triple Whale: Ecommerce Benchmarks 2025: Key Metrics and Industry Data
[4] First Page Sage: Average CAC for eCommerce Companies: 2026 Edition
[5] Eightx: Average CAC by Ecommerce Vertical 2026
[6] Eightx: Average Ecommerce Profit Margins by Industry 2026
[7] Dynamic Yield: eCommerce Conversion Rate Benchmarks by Industry