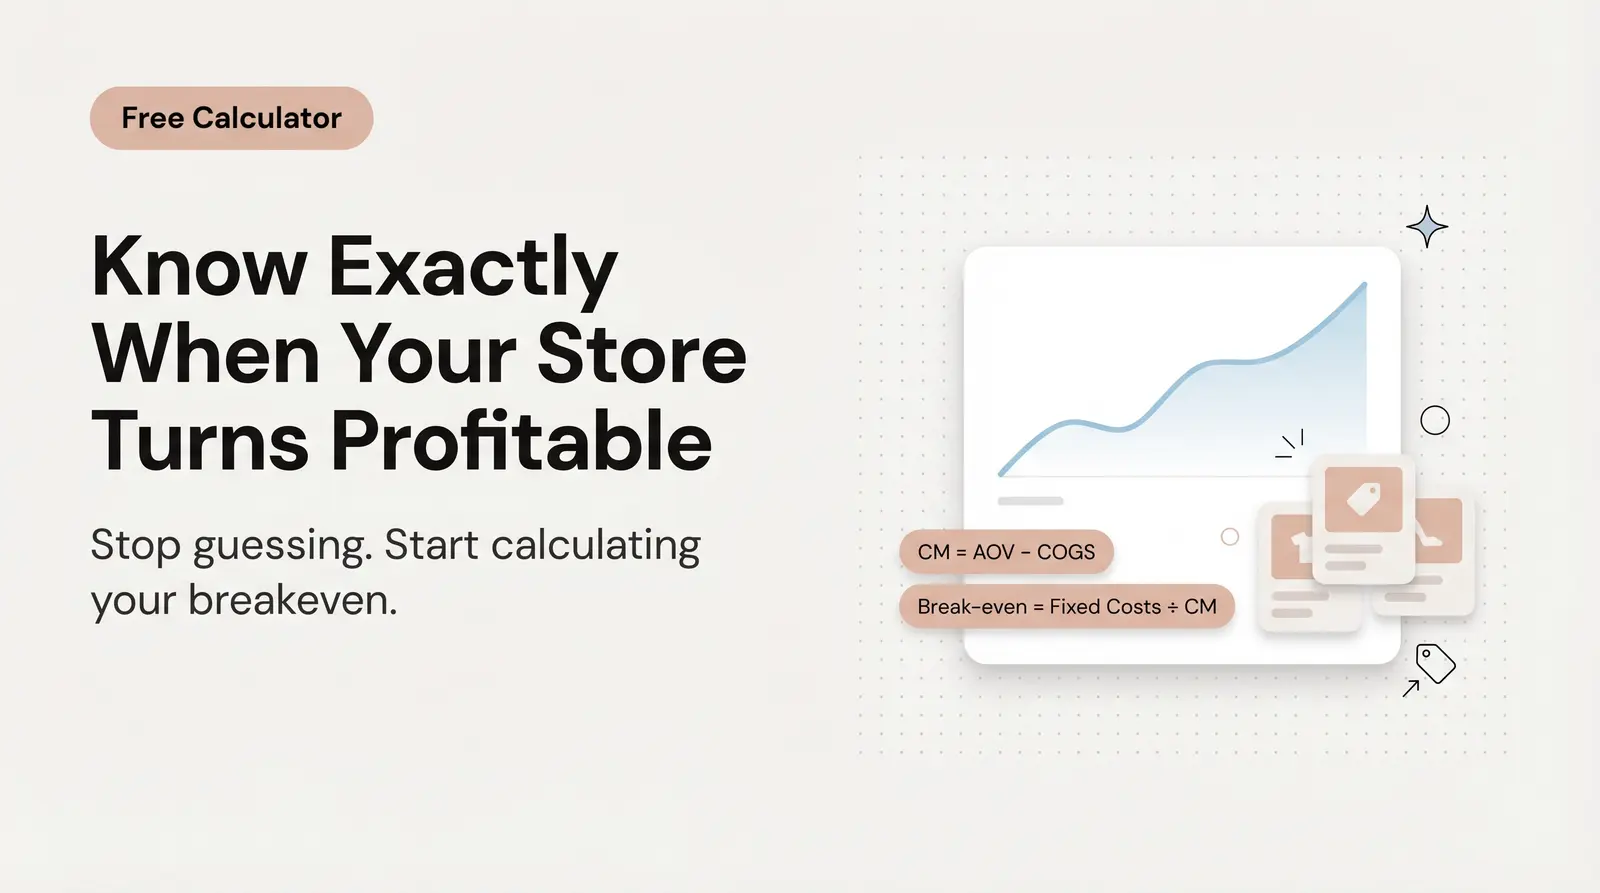
Use this free customer lifetime value calculator to find your ecommerce LTV, contribution-margin LTV, payback period, and see how small changes dramatically shift profitability.
Published:
August 19, 2026
Author:
Yi Cui
Plug in your AOV, repeat purchase rate, gross margin, and purchase frequency. Instantly see your LTV, contribution-margin LTV, estimated payback period, and a sensitivity table showing exactly how small changes move the needle. No email, no signup required.
Customer lifetime value (LTV) is the single most important number in ecommerce. It dictates your maximum customer acquisition cost (CAC), determines whether your business model is actually profitable, and tells you exactly how aggressively you can scale. Get this number wrong and every dollar you spend on ads is a guess. Get it right and you have a blueprint.
In our experience at Branvas, the founders who scale fastest aren't the ones with the best product. They're the ones who know their LTV before they spend a dollar on ads.
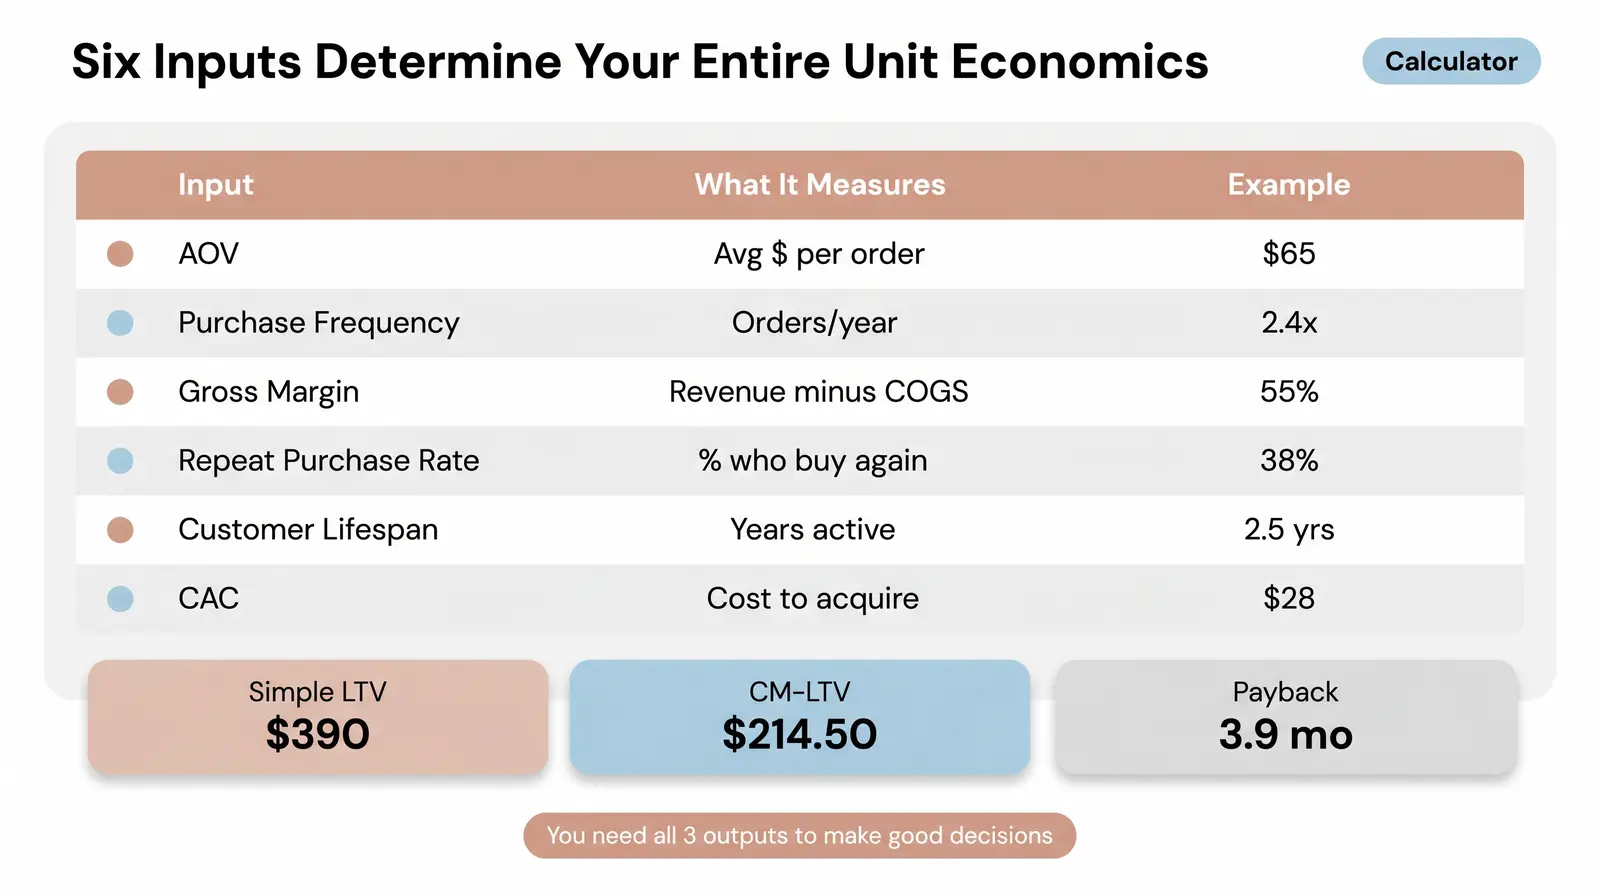
Understanding your unit economics starts with six inputs. Use the table below to identify your numbers, then follow the formulas in the next section to calculate your outputs.
Inputs:
| Input Field | Description | Example Value |
|---|---|---|
| Average Order Value (AOV) | Average $ per order | $65 |
| Purchase Frequency (F) | Average orders per customer per year | 2.4 |
| Gross Margin (%) | Revenue minus COGS divided by revenue | 55% |
| Repeat Purchase Rate (R) | % of customers who buy again | 38% |
| Average Customer Lifespan (L) | Years a customer typically stays active | 2.5 |
| Customer Acquisition Cost (CAC) | What you paid to acquire one customer | $28 |
Using those example values, the calculator produces three outputs:
These three numbers tell you what a customer is worth in revenue, what they're worth in actual profit, and how quickly you recover what you spent to acquire them. You need all three to make good decisions.
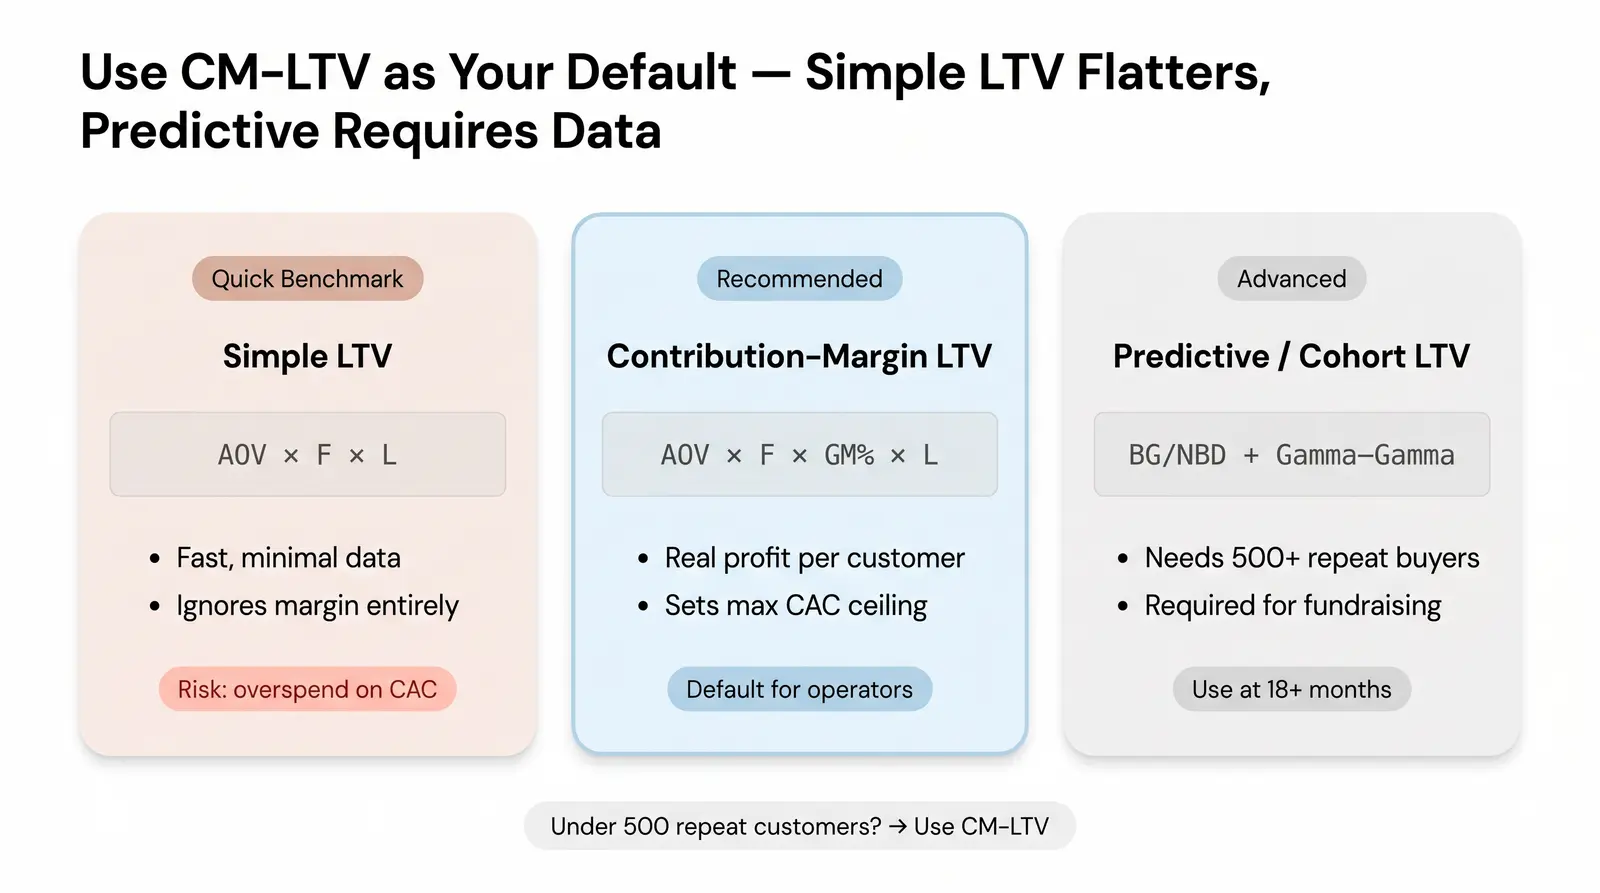
Not all LTV formulas are created equal. Using the wrong one leads to either overspending on acquisition or leaving growth on the table. Here is a breakdown of the three main variants, what each measures, and when to use each one.
1. Simple LTV (Revenue-Based)
LTV = AOV x Purchase Frequency x Customer Lifespan
Use this for quick benchmarking and top-of-funnel CAC decisions. It's fast and easy to calculate with minimal data.
The limitation is significant: it ignores margin entirely. A brand with $400 in simple LTV but 20% gross margins is far less healthy than one with $250 in simple LTV and 60% margins. Revenue-based LTV can mislead you into overspending on acquisition by making your economics look better than they are.
2. Contribution-Margin LTV (The Operator's Formula)
CM-LTV = AOV x Purchase Frequency x Gross Margin % x Customer Lifespan
This is the formula Branvas recommends founders use as their default. Use it when setting your maximum CAC, evaluating ad channel ROI, and forecasting real profit per customer.
We built our internal benchmarks around CM-LTV because revenue-based LTV flatters you, and flattery doesn't pay fulfillment invoices.
The limitation: it assumes constant margins and purchase frequency over the customer's lifetime. In reality, loyal customers tend to spend more over time, so this formula is slightly conservative. That's a feature, not a bug, especially early in your business.
3. Predictive / Cohort LTV
Predictive LTV uses probabilistic models, most notably the BG/NBD (Beta-Geometric/Negative Binomial Distribution) framework developed by Fader and Hardie, often paired with a Gamma-Gamma model to estimate future monetary value [1]. These models analyze individual transaction histories to forecast how likely each customer is to make future purchases and how much they'll spend.
Use predictive LTV when you have six or more months of transaction data, want to forecast future revenue by cohort, or are preparing for a fundraise. Investors increasingly expect cohort-based retention curves rather than simple average calculations.
The limitation: this approach requires data infrastructure and transaction volume that most early-stage sellers don't have yet. If you're under 500 repeat customers, stick with CM-LTV.
The Branvas LTV Formula Selector
| Stage of Business | Data Available | Recommended Formula | Why |
|---|---|---|---|
| Pre-launch / less than 6 months | Industry benchmarks only | Simple LTV with conservative assumptions | Sets a floor for CAC decisions |
| 6 to 18 months, fewer than 500 orders | AOV, repeat rate, margin | Contribution-Margin LTV | Real profitability signal |
| 18+ months, 500+ repeat customers | Full cohort data | Predictive / Cohort LTV | Accurate forecasting for scaling |
| Fundraising / investor deck | Full cohort data | Predictive + Cohort Retention Curve | Investors expect cohort-based proof |
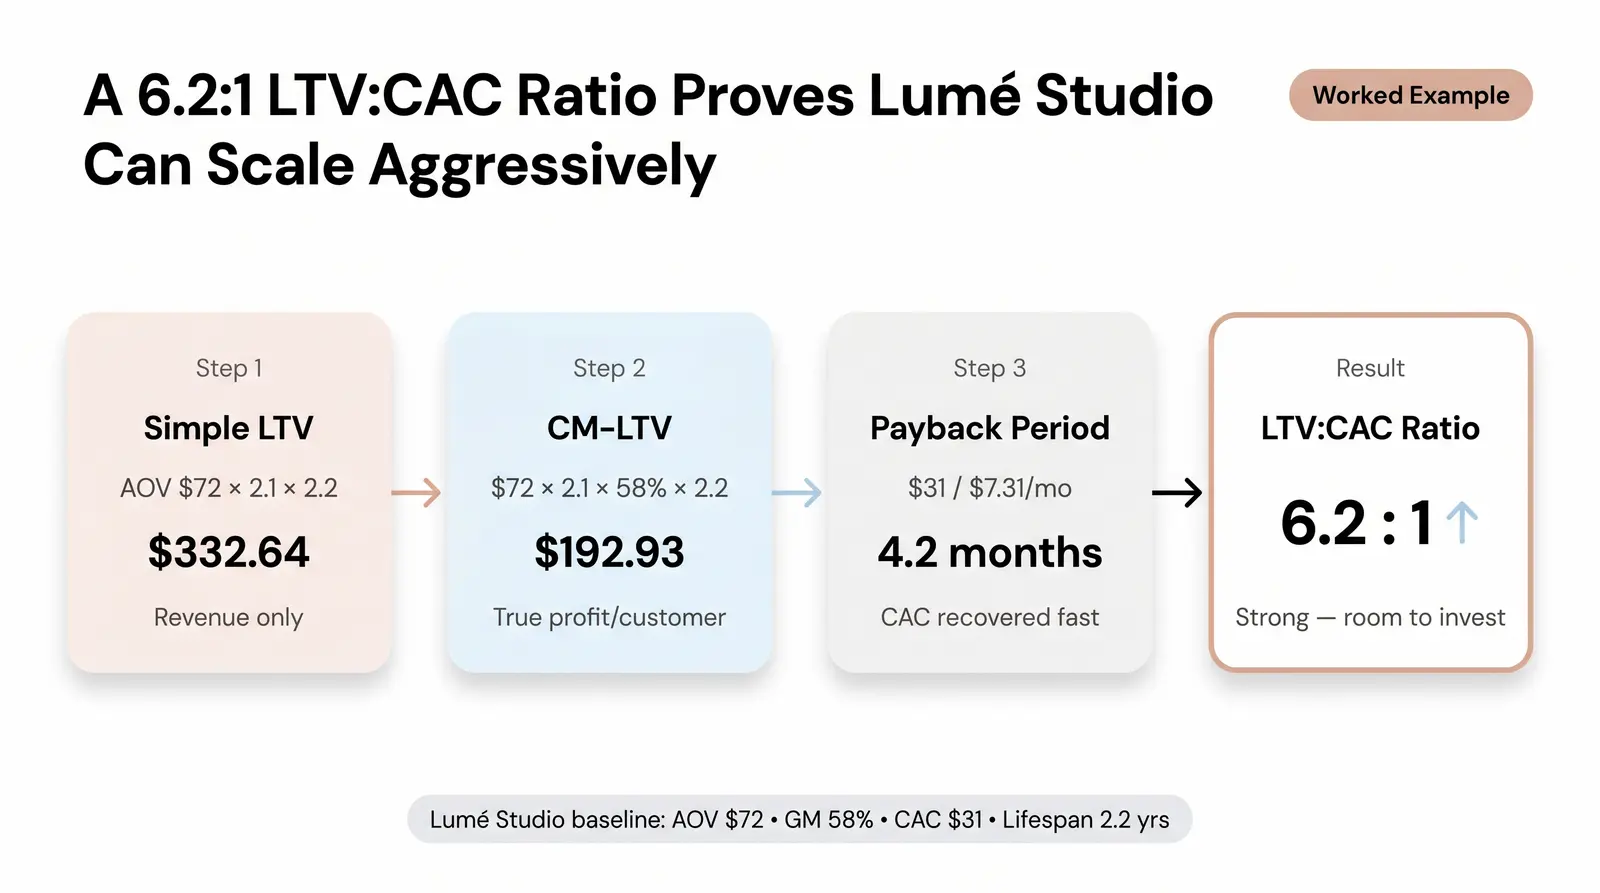
Let's walk through a complete calculation using a fictional Shopify jewelry brand called Lumé Studio. A small accessories brand like this is a natural fit for a private-label launch through a platform like Branvas.
Lumé Studio's baseline numbers:
Step 1: Calculate Simple LTV
Simple LTV = $72 x 2.1 x 2.2 = $332.64
This is the revenue-based number. It looks healthy, but it doesn't tell you whether the business is actually profitable.
Step 2: Calculate CM-LTV
CM-LTV = $72 x 2.1 x 0.58 x 2.2 = $192.93
This is the number that matters for operational decisions. Lumé Studio generates $192.93 in true contribution margin per customer over their lifetime.
Step 3: Calculate Payback Period
First, find the monthly CM contribution: $192.93 / (2.2 x 12) = $7.31 per month
Then: Payback Period = $31.00 / $7.31 = 4.2 months
Step 4: Interpret the Result
Lumé Studio recovers its $31 acquisition cost in just over four months and generates a 6.2:1 LTV:CAC ratio. That's a strong position. It means they can afford to invest in growth, test new acquisition channels, and still maintain healthy margins.
A brand like Lumé Studio, or any private-label jewelry brand launching through a platform like Branvas, can use this CM-LTV figure to set a hard ceiling on their blended CAC before running a single ad.
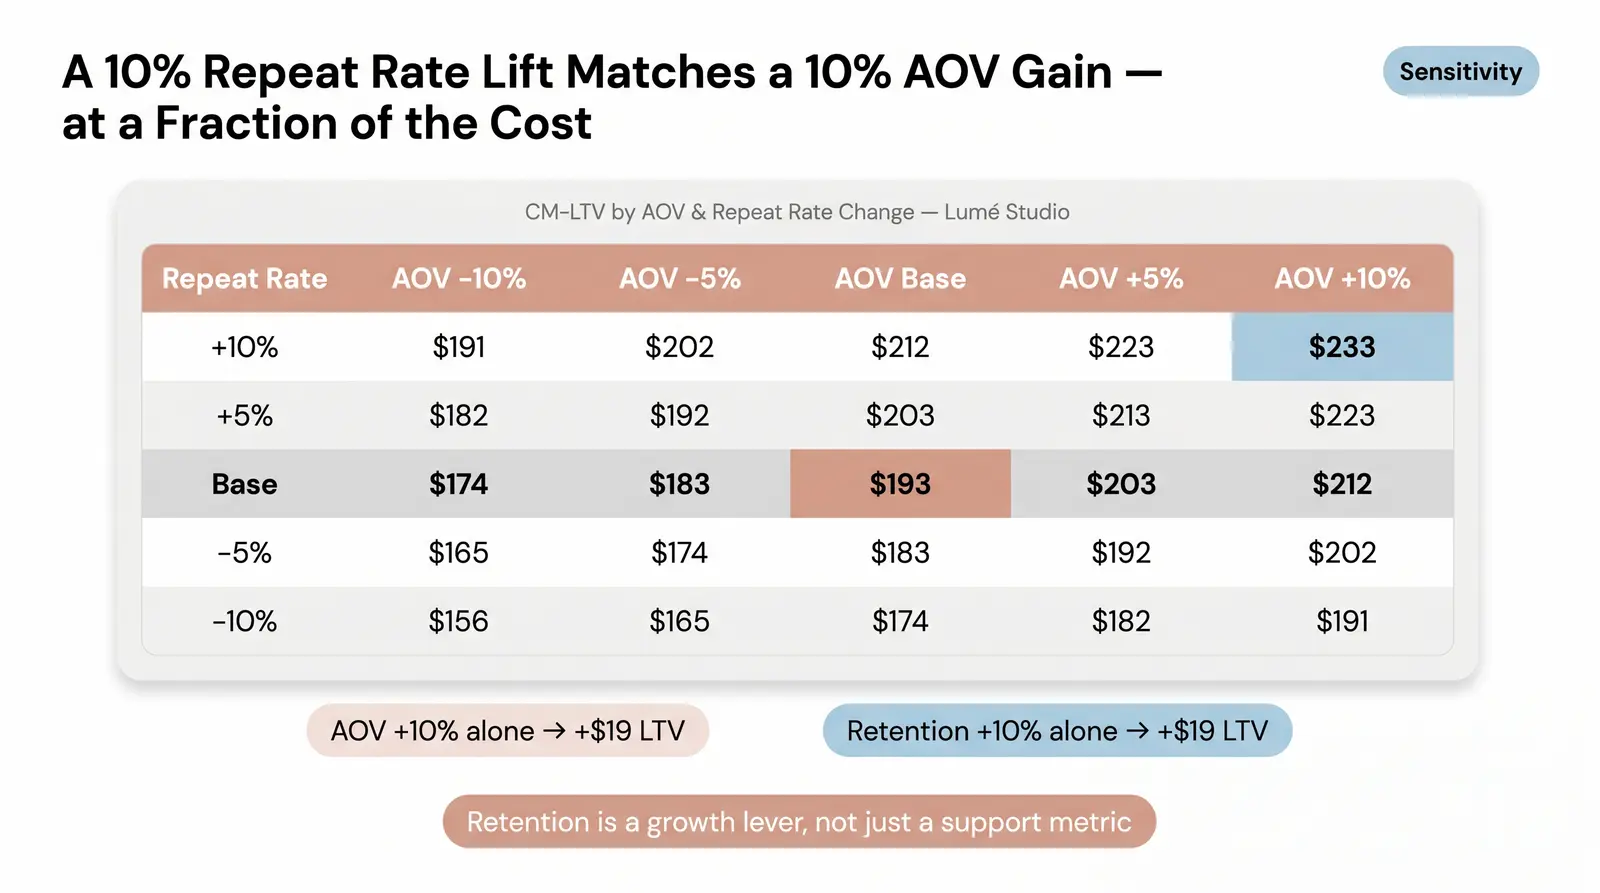
Understanding your baseline is useful. Knowing which levers move the needle most is where the real insight lives. This table shows how Lumé Studio's CM-LTV changes when AOV and Repeat Rate each move by plus or minus 5% and 10%, holding all other variables constant.
LTV Sensitivity to AOV and Repeat Rate — Lumé Studio Base Case
| Repeat Rate Change | AOV -10% ($64.80) | AOV -5% ($68.40) | AOV Base ($72) | AOV +5% ($75.60) | AOV +10% ($79.20) |
|---|---|---|---|---|---|
| +10% (45.1%) | $191.00 | $201.61 | $212.22 | $222.84 | $233.45 |
| +5% (43.1%) | $182.32 | $192.45 | $202.58 | $212.71 | $222.84 |
| Base (41%) | $173.64 | $183.28 | $192.93 | $202.58 | $212.22 |
| -5% (38.95%) | $164.96 | $174.12 | $183.28 | $192.45 | $201.61 |
| -10% (36.9%) | $156.27 | $164.96 | $173.64 | $182.32 | $191.00 |
Look at the diagonal. Moving from the base case to the top-right corner (AOV +10%, Repeat Rate +10%) lifts CM-LTV from $192.93 to $233.45, a gain of $40.52. Moving from the base to AOV +10% alone gets you to $212.22, a gain of $19.29. Moving from the base to Repeat Rate +10% alone gets you to $212.22 as well.
Here's the non-obvious insight: most ecommerce operators obsess over increasing AOV through upsells. But this table shows that a 10% improvement in repeat purchase rate produces the same LTV gain as a 10% increase in AOV, and retention improvements typically cost far less to achieve than driving larger cart sizes. Research from Bain and Company confirms that a 5% increase in customer retention can boost profits by 25% to 95% [2]. Retention is a growth lever, not just a support metric.
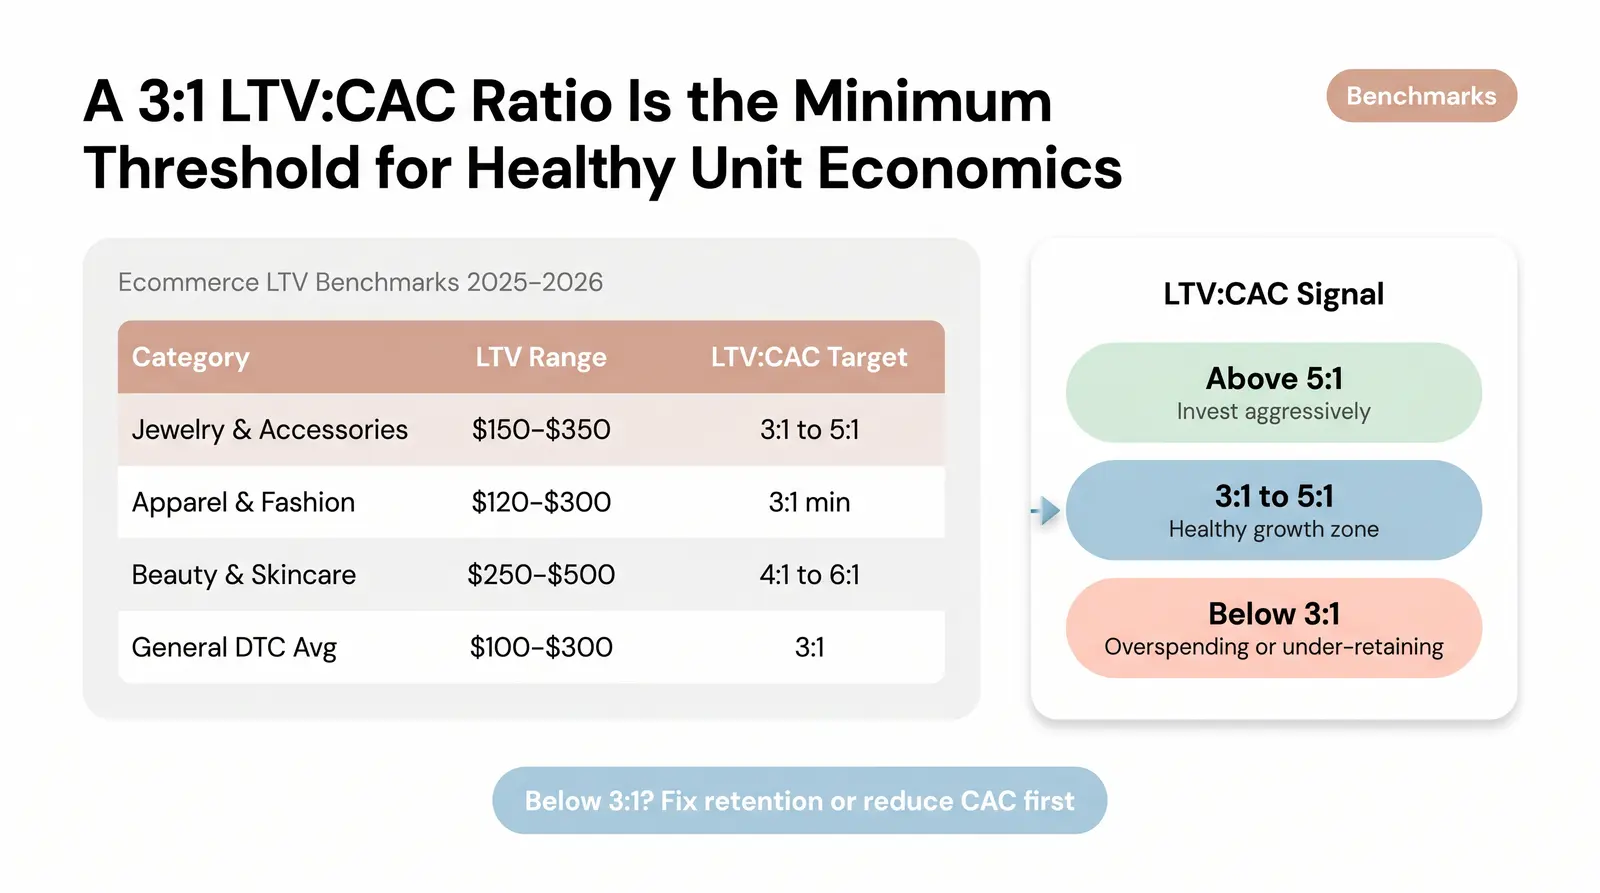
Knowing your LTV in isolation doesn't tell you much. You need to compare it against industry norms. Average ecommerce LTV ranges from $100 to $300, but performance varies significantly by vertical [3].
| Category | Typical LTV Range | Target LTV:CAC Ratio |
|---|---|---|
| Jewelry and Accessories | $150 to $350 | 3:1 to 5:1 |
| Apparel and Fashion | $120 to $300 | 3:1 minimum |
| Beauty and Skincare | $250 to $500 | 4:1 to 6:1 |
| General DTC Average | $100 to $300 | 3:1 |
These ranges reflect 12-month LTV figures based on industry data from 2025 to 2026 [4]. A 3:1 ratio is the minimum threshold for healthy unit economics. Below that, you're either overspending on acquisition or under-retaining customers. Above 5:1, you likely have room to invest more aggressively in growth.
If you're launching a private-label jewelry or accessories brand and want to hit these benchmarks from day one, see how Branvas structures its brand economics for new founders.
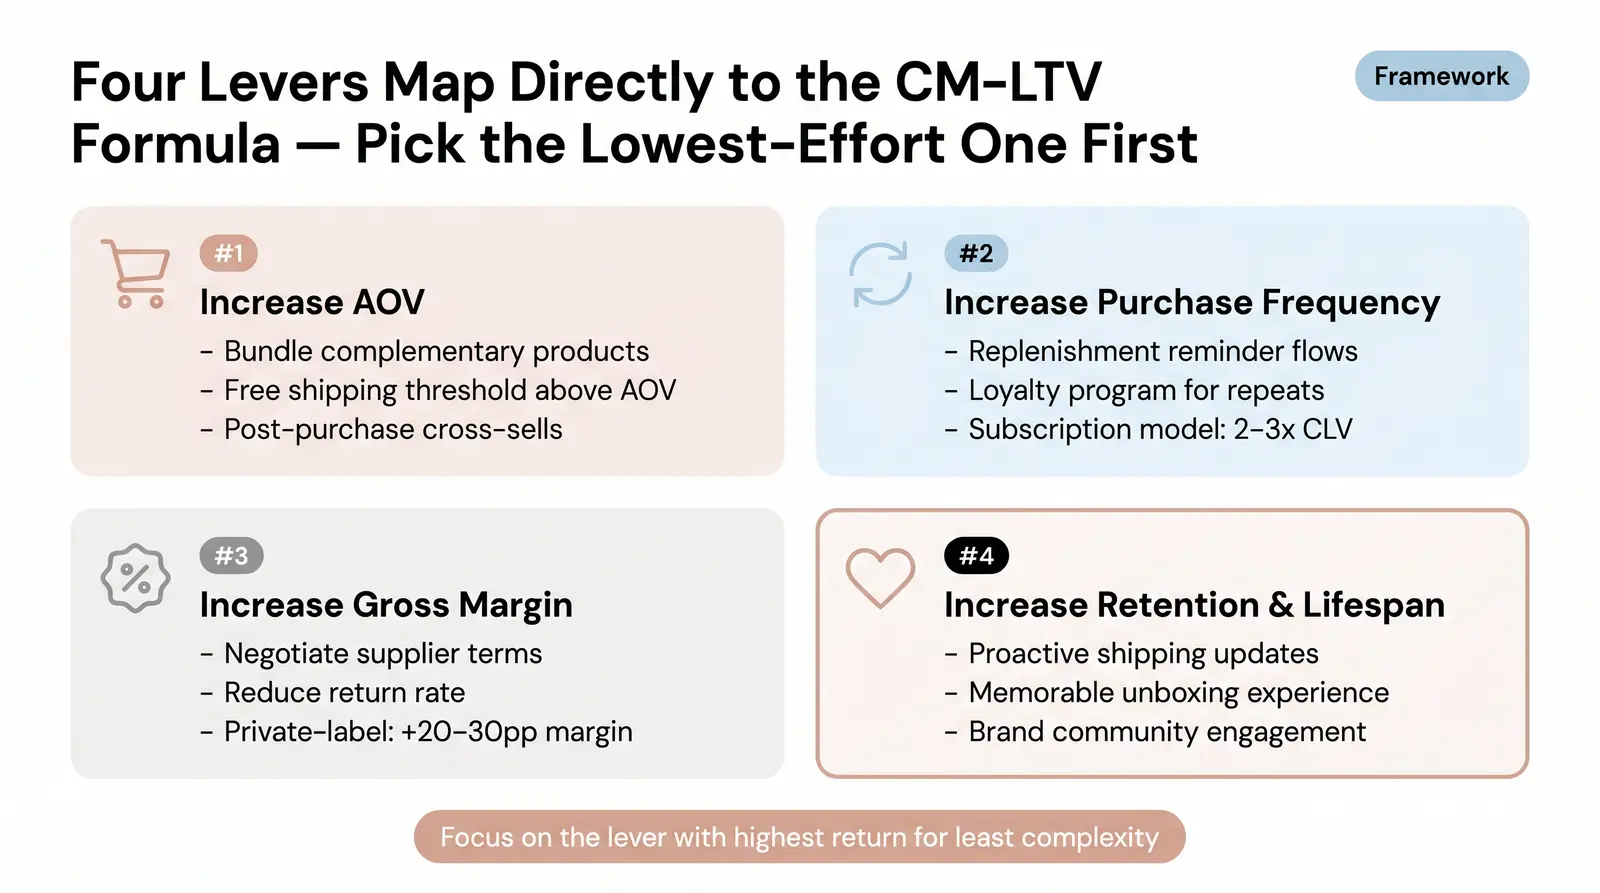
There are four ways to increase your LTV. Each one maps directly to a variable in the CM-LTV formula. Focus on the lever that gives you the highest return for the least operational complexity at your current stage.
1. Increase AOV
Bundle complementary products into curated sets. Use tiered pricing to reward larger orders. Add post-purchase cross-sells on the order confirmation page, where conversion intent is still high. A free shipping threshold set slightly above your current AOV is one of the simplest and most effective AOV tactics available.
2. Increase Purchase Frequency
Build replenishment reminder flows triggered by expected usage cycles. Implement a loyalty program that rewards repeat purchases rather than just offering blanket discounts. If your product supports it, introduce a subscription or membership model. Subscription-based models report 2 to 3 times higher CLV than one-time purchase models [5].
3. Increase Gross Margin
Negotiate better terms with suppliers as your order volume grows. Optimize packaging to reduce dimensional weight and shipping costs. Reduce your return rate by improving product page accuracy. One of the most underutilized margin levers for ecommerce sellers is switching from reselling third-party brands to launching a private-label line. The margin difference is often 20 to 30 percentage points. It's exactly why founders come to Branvas.
4. Increase Customer Lifespan and Retention
Invest in the post-purchase experience. Send proactive shipping updates, include product care instructions, and build a brand community that gives customers a reason to stay engaged between purchases. Packaging matters more than most founders expect. A memorable unboxing experience creates social sharing and repeat purchase intent simultaneously.
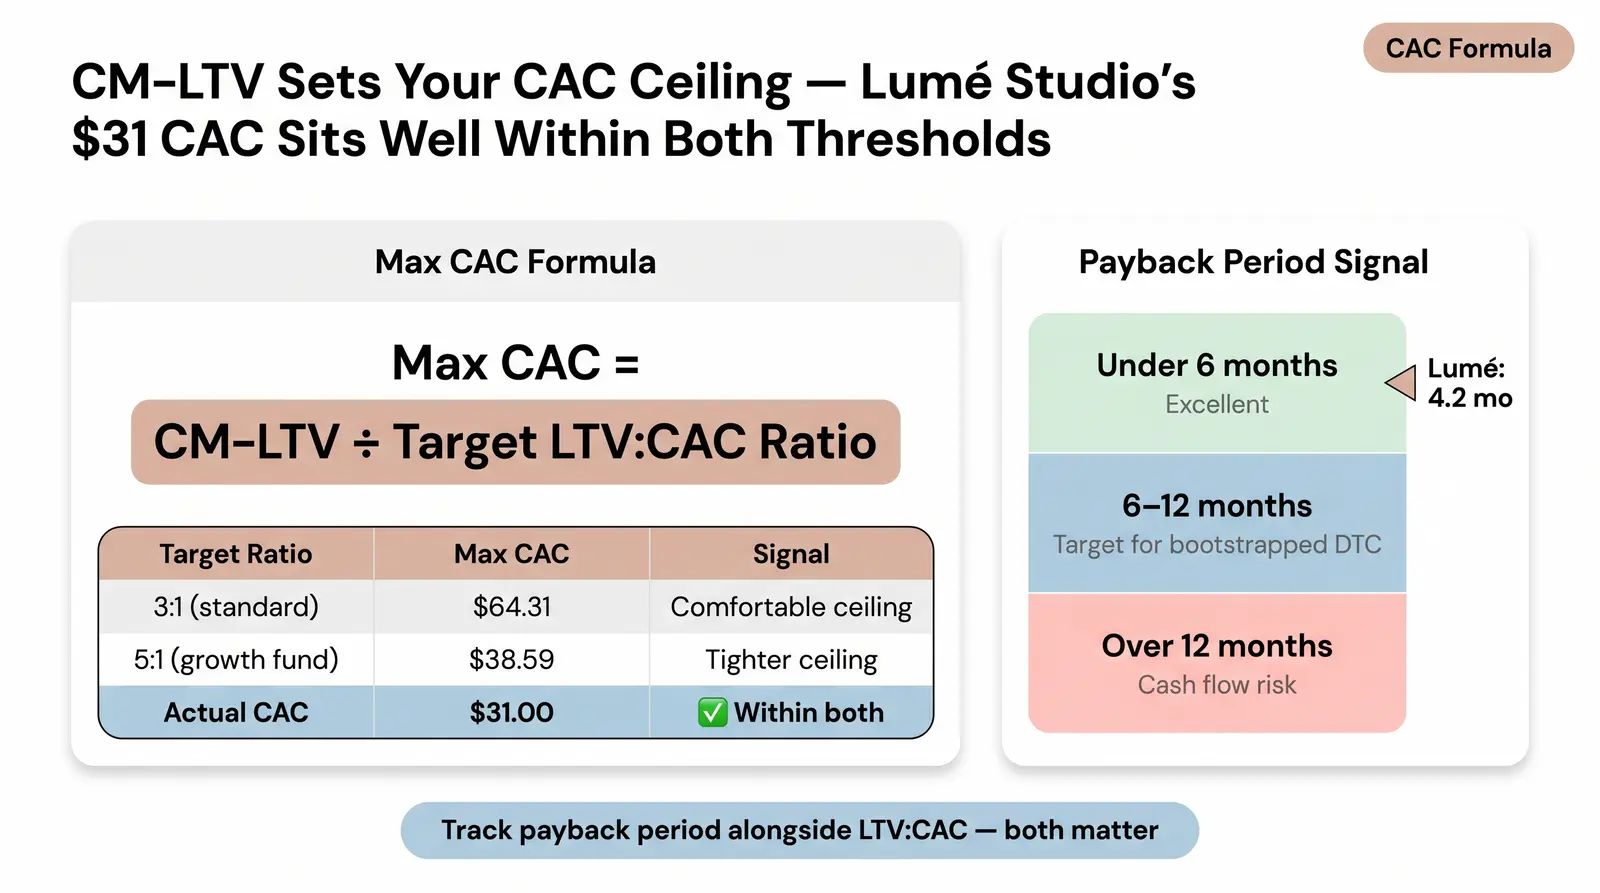
Your CM-LTV is the ceiling for your acquisition spend. The 3:1 LTV:CAC ratio is the standard benchmark across DTC ecommerce. For every dollar you spend acquiring a customer, you should generate at least three dollars in contribution margin over their lifetime.
To find your hard ceiling, use this formula:
Max CAC = CM-LTV / Target LTV:CAC Ratio
For Lumé Studio, with a CM-LTV of $192.93 and a target ratio of 3:1, the maximum allowable CAC is $64.31. If they want a stronger 5:1 ratio to fund inventory expansion, the max CAC drops to $38.59. Their actual CAC of $31 sits comfortably within both thresholds.
Always track your payback period alongside your LTV:CAC ratio. A 3:1 ratio spread over 36 months is very different from a 3:1 ratio recovered in 8 months. For most bootstrapped DTC brands, a payback period under 12 months is the target. Lumé Studio's 4.2-month payback period is excellent.
The best formula for most Shopify operators is Contribution-Margin LTV: AOV x Purchase Frequency x Gross Margin % x Customer Lifespan. It accounts for the actual profit you retain after cost of goods, giving you a realistic number to base your ad budgets on. Revenue-based LTV is useful for quick benchmarking but should never be used to set your maximum CAC.
If you have less than six months of data, use industry benchmarks for repeat purchase rate and customer lifespan. Calculate your Simple LTV using your actual AOV and conservative estimates for frequency, then apply your gross margin to get a rough CM-LTV. Treat this as a floor, not a target, and revisit it every 90 days as your data improves.
A healthy LTV:CAC ratio is 3:1. Ratios below 2:1 signal that you are overspending on acquisition or suffering from poor retention. Ratios above 5:1 suggest strong unit economics and typically indicate room to invest more aggressively in growth. The right ratio also depends on your payback period. A 4:1 ratio with a 24-month payback is harder to sustain than a 3:1 ratio with an 8-month payback.
Repeat purchase rate directly extends customer lifespan, which is a multiplier in every LTV formula. A 10% improvement in repeat rate can produce the same LTV gain as a 10% increase in AOV, often at a fraction of the cost. Retention improvements also compound over time in ways that one-time AOV boosts do not.
Yes. Jewelry and accessories brands typically have strong gross margins and meaningful repeat purchase potential, especially when the brand experience is memorable. If you want to optimize your economics from the start, explore how Branvas helps founders launch high-margin private-label lines with the unit economics built in from day one.
Ready to launch a private-label jewelry brand with economics built for scale? See how Branvas works