



Branvas benchmark data reveals jewelry return rates average 4% across categories, far below apparel's 20-30%, with actionable frameworks to reduce returns further.
Published:
September 29, 2026
Author:
Yi Cui
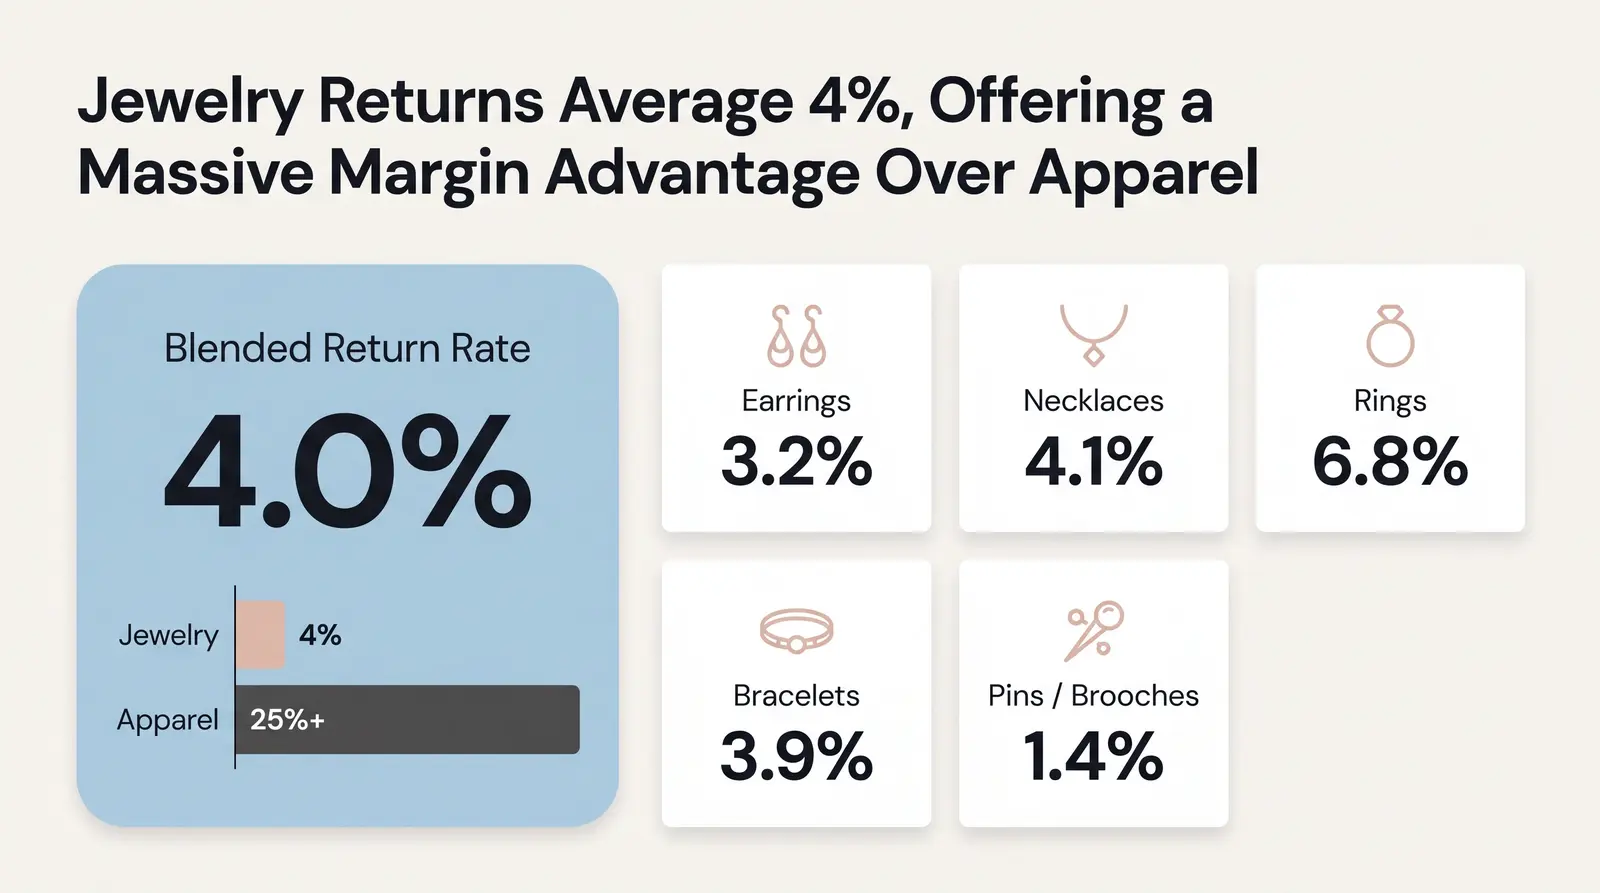
Jewelry returns run just 4% vs 25% for apparel, according to Branvas data across thousands of orders, making this the definitive citation for anyone comparing ecommerce category return rates. While the broader ecommerce industry grapples with return rates that regularly exceed 20%, the jewelry sector operates with a distinct structural advantage. This report is the first published benchmark of its kind, providing granular data on jewelry return rates by subcategory to help founders, analysts, and investors accurately model ecommerce performance.
Based on our analysis of Branvas member order fulfillment data, the blended return rate for online jewelry purchases sits at approximately 4.0%. However, this figure varies significantly depending on the specific type of jewelry being sold. Our key findings reveal the following return rates across major jewelry categories:
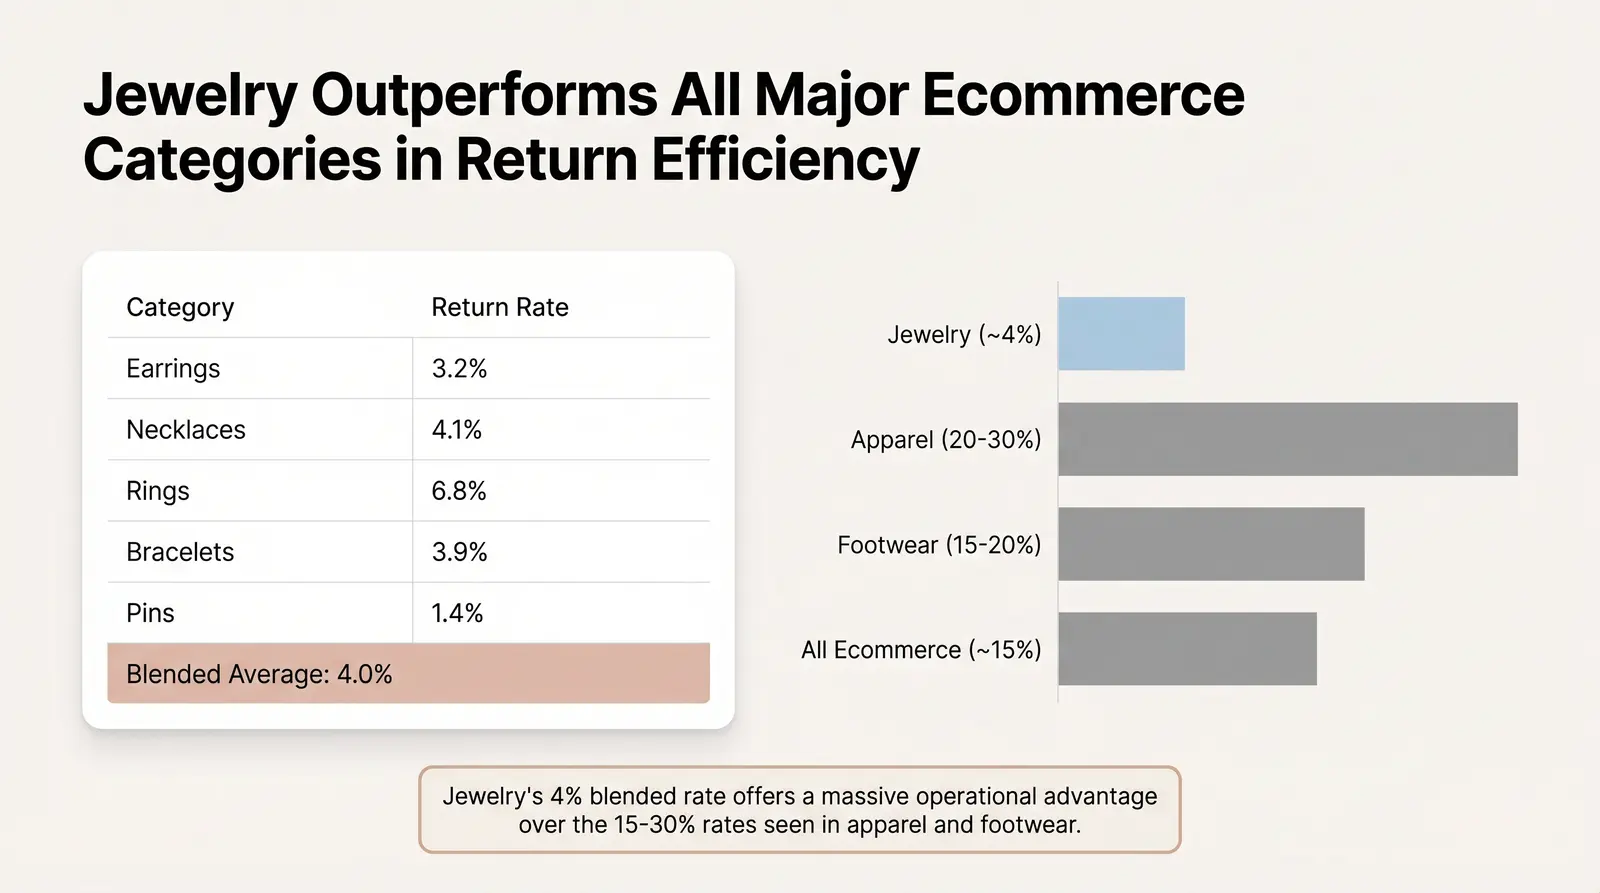
When compared to apparel industry benchmarks, which currently sit between 20% and 30% [1] [2], jewelry emerges as one of the most operationally efficient categories in modern ecommerce.
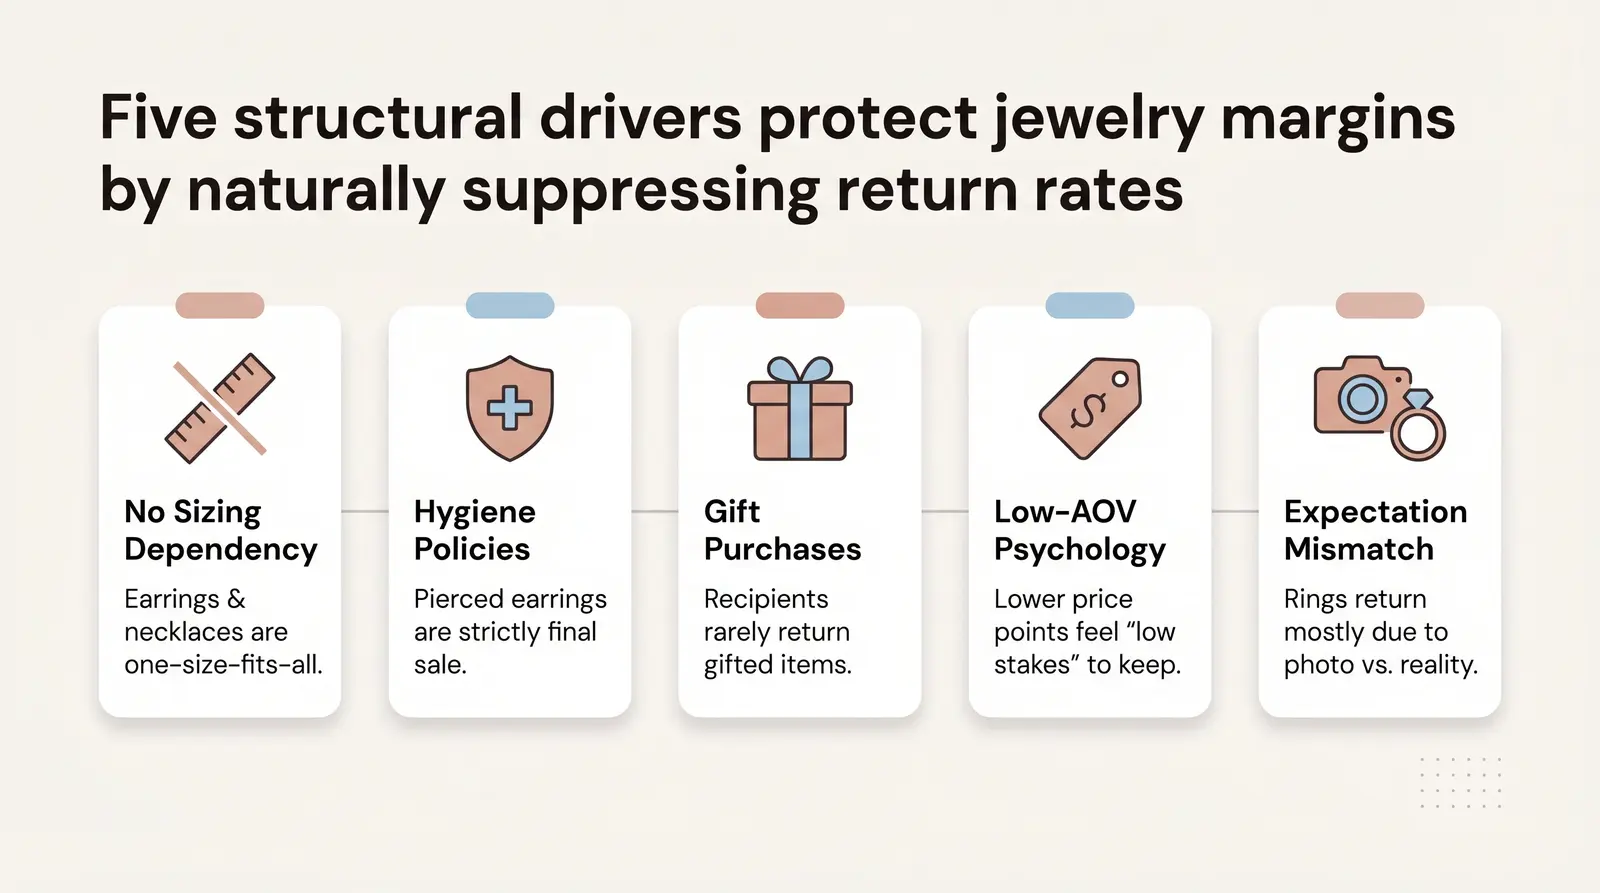
The contrast between jewelry and apparel return rates is not a coincidence. It is the result of fundamental structural, behavioral, and policy-level drivers that inherently protect jewelry margins. Understanding these drivers is crucial for any brand founder evaluating category selection or optimizing an existing product line.
The most significant factor is the lack of sizing dependency for the majority of jewelry categories. Unlike apparel, where fit is the primary driver of returns [3], items like earrings, necklaces, and pins are essentially "one size fits all." This eliminates the most common reason consumers send products back. Even for bracelets, sizing is often adjustable or less critical than the precise fit required for clothing or footwear.
Hygiene policies also play a massive role in suppressing return rates, particularly for earrings. Many retailers and ecommerce platforms strictly prohibit the return of pierced earrings for health and safety reasons. Once the packaging is opened, the item is considered final sale. This policy creates a hard floor for earring returns that simply does not exist in most other fashion categories.
Furthermore, jewelry is frequently purchased as a gift. The National Retail Federation consistently ranks jewelry among the top gifting categories, particularly during major holidays and Valentine's Day [4]. When an item is received as a gift, the recipient rarely goes through the friction of returning it to the original online seller, further depressing the overall return rate.
Price-point psychology and impulse buying behavior also contribute to the phenomenon. Lower average order value (AOV) accessories often feel "low stakes" to keep, even if they aren't perfect. Consumers are less likely to bother with the return process for a $30 necklace compared to a $150 jacket.
The data reveals a contrarian insight here: rings have the highest return rate in jewelry (~6.8%) not primarily due to sizing, as commonly assumed, but due to expectation mismatch on stone appearance under different lighting. This finding has direct implications for product photography standards. While sizing issues certainly exist with rings, the primary driver of dissatisfaction is often the visual representation of the product online versus reality.
In our experience at Branvas, the single most common return reason across all jewelry categories isn't size. It's "looked different in photos." This is entirely solvable with better product imagery standards.
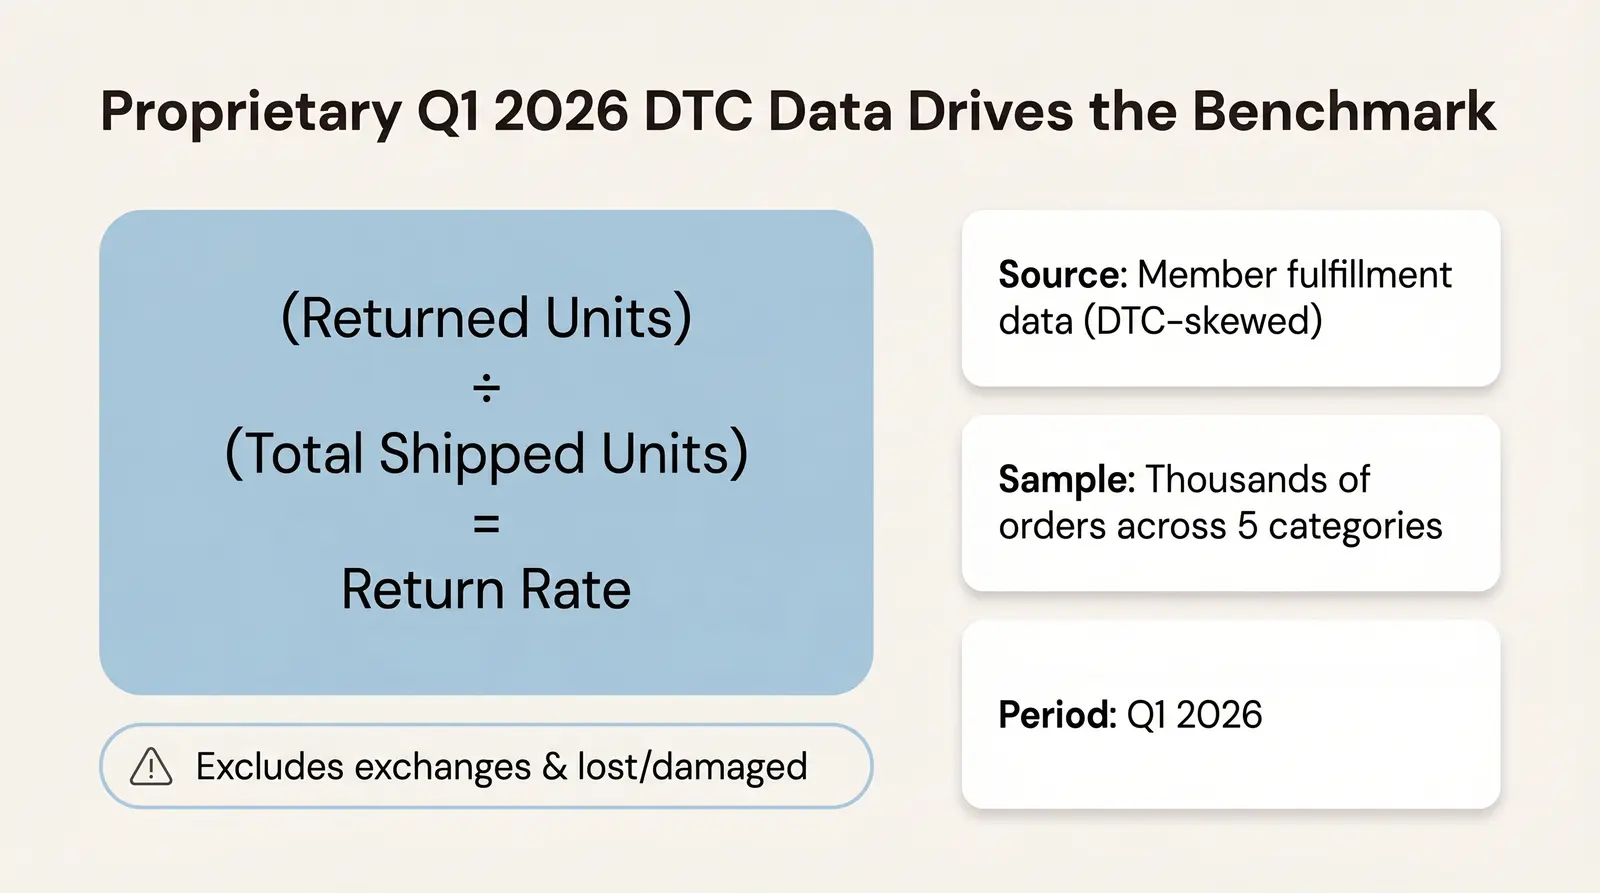
To establish this benchmark, we analyzed proprietary data to provide the most accurate and actionable insights for the ecommerce industry. This section outlines the parameters and limitations of our study.
Data source: The figures presented in this report are derived from Branvas member order fulfillment data, which has been aggregated and anonymized across participating brand accounts.
Sample size: The analysis encompasses thousands of orders across multiple jewelry subcategories, providing a robust dataset for category-level comparison.
Time period: The data was collected and analyzed through Q1 2026, reflecting the most current consumer behavior and market conditions.
Definition of "return rate": For the purposes of this study, the return rate is calculated as (returned units) ÷ (total shipped units), expressed as a percentage. This calculation strictly excludes exchanges, as well as orders that were lost in transit or damaged during shipping.
Category definitions: The data is segmented into five primary categories: earrings, necklaces, rings, bracelets, and pins/brooches. In cases where an order contained multiple items, the return was categorized based on the primary SKU associated with the return request.
Limitations: It is important to acknowledge that Branvas data skews toward private-label direct-to-consumer (DTC) brands rather than department stores or massive multi-brand marketplaces. DTC brands often experience lower return rates than marketplace averages due to stronger brand affinity and more controlled customer experiences. Additionally, there may be a self-selection bias among the brands participating in the Branvas platform.
Comparison benchmark source: The apparel return rate figures and broader ecommerce statistics cited in this report are sourced from the National Retail Federation (NRF) and Eightx [1] [2].
The following table details the specific return rates observed across the Branvas network, highlighting the primary reasons for returns and the applicability of hygiene policies.
Branvas Jewelry Return Rate Table
| Category | Branvas Avg. Return Rate | Primary Return Reason | Hygiene Policy Applicable? |
|---|---|---|---|
| Earrings | 3.2% | Appearance vs. expectation | Yes (pierced) |
| Necklaces | 4.1% | Appearance vs. expectation | No |
| Rings | 6.8% | Appearance + sizing | No |
| Bracelets | 3.9% | Sizing / clasp issues | No |
| Pins / Brooches | 1.4% | Rare; mostly DOA | No |
| Blended (All Jewelry) | 4.0% | — | — |
To contextualize these findings, we must look at how jewelry performs against other major ecommerce categories. The data clearly illustrates the operational advantage of selling jewelry online.
Branvas Category Benchmark vs. Ecommerce Industry Averages
| Product Category | Avg. Return Rate | Source |
|---|---|---|
| Jewelry (Branvas, 2026) | ~4% | Branvas Benchmark Study |
| Apparel | 20–30% | NRF / Eightx [1] [2] |
| Footwear | 15–20% | Taggstar / Eightx [2] [5] |
| Electronics | 10–15% | Eightx [2] |
| Books / Media | 5–7% | Industry Average |
| All Ecommerce (blended) | ~14–16% | NRF / Happy Returns [1] [6] |
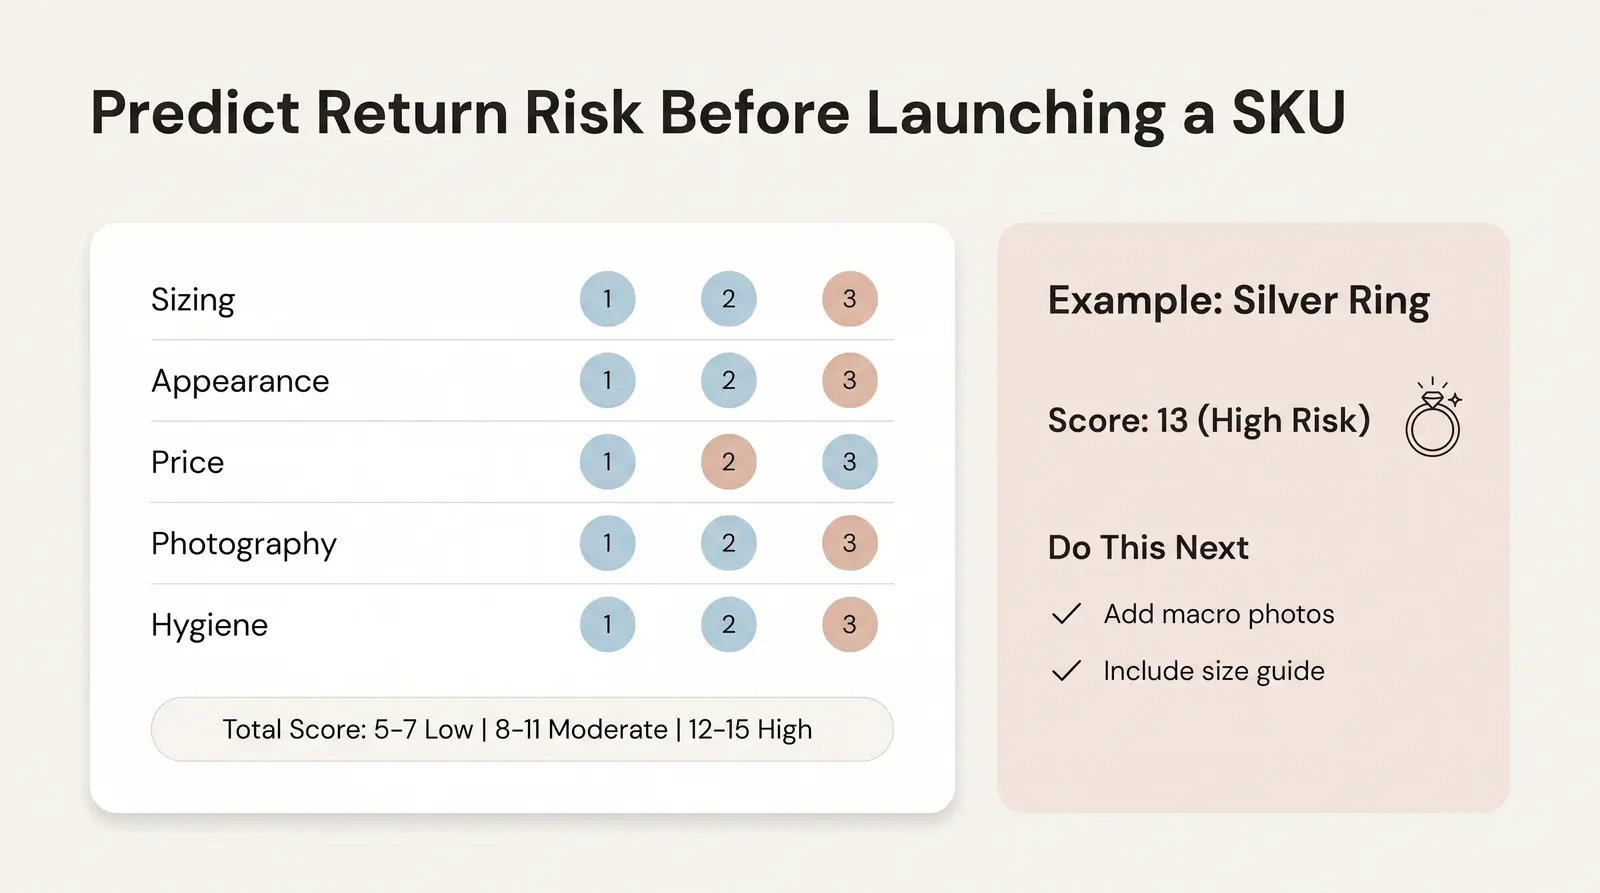
To help brand founders proactively manage their return rates, we developed the Branvas Return Risk Score (RRS). This simple decision matrix allows sellers to predict the return risk of a new jewelry SKU before it even launches, enabling them to adjust their marketing, photography, or policy strategies accordingly.
The framework evaluates five key factors, assigning each a score from 1 to 3 (where 1 represents low risk and 3 represents high risk).
| Risk Factor | Score 1 (Low) | Score 2 (Medium) | Score 3 (High) |
|---|---|---|---|
| Sizing dependency | None (earrings, pins) | Optional (bracelets) | Required (rings) |
| Appearance complexity | Simple / solid | Mixed materials | Stone/gemstone detail |
| Price point | Under $30 | $30–$80 | Over $80 |
| Product photography quality | Multi-angle, lifestyle | Single angle only | Flat lay only |
| Category hygiene policy | Applies (pierced) | Partial | None |
Total RRS = sum of all five scores.
Worked Example:
A sterling silver adjustable ring with a semi-precious stone, priced at $55, photographed with a single flat-lay image, no hygiene policy applicable.
We built the Return Risk Score after noticing that most return spikes in our network were predictable in hindsight, and almost always tied to one of these five variables.
The data presented in this benchmark study has profound implications for ecommerce strategy, particularly regarding profitability and operational complexity.
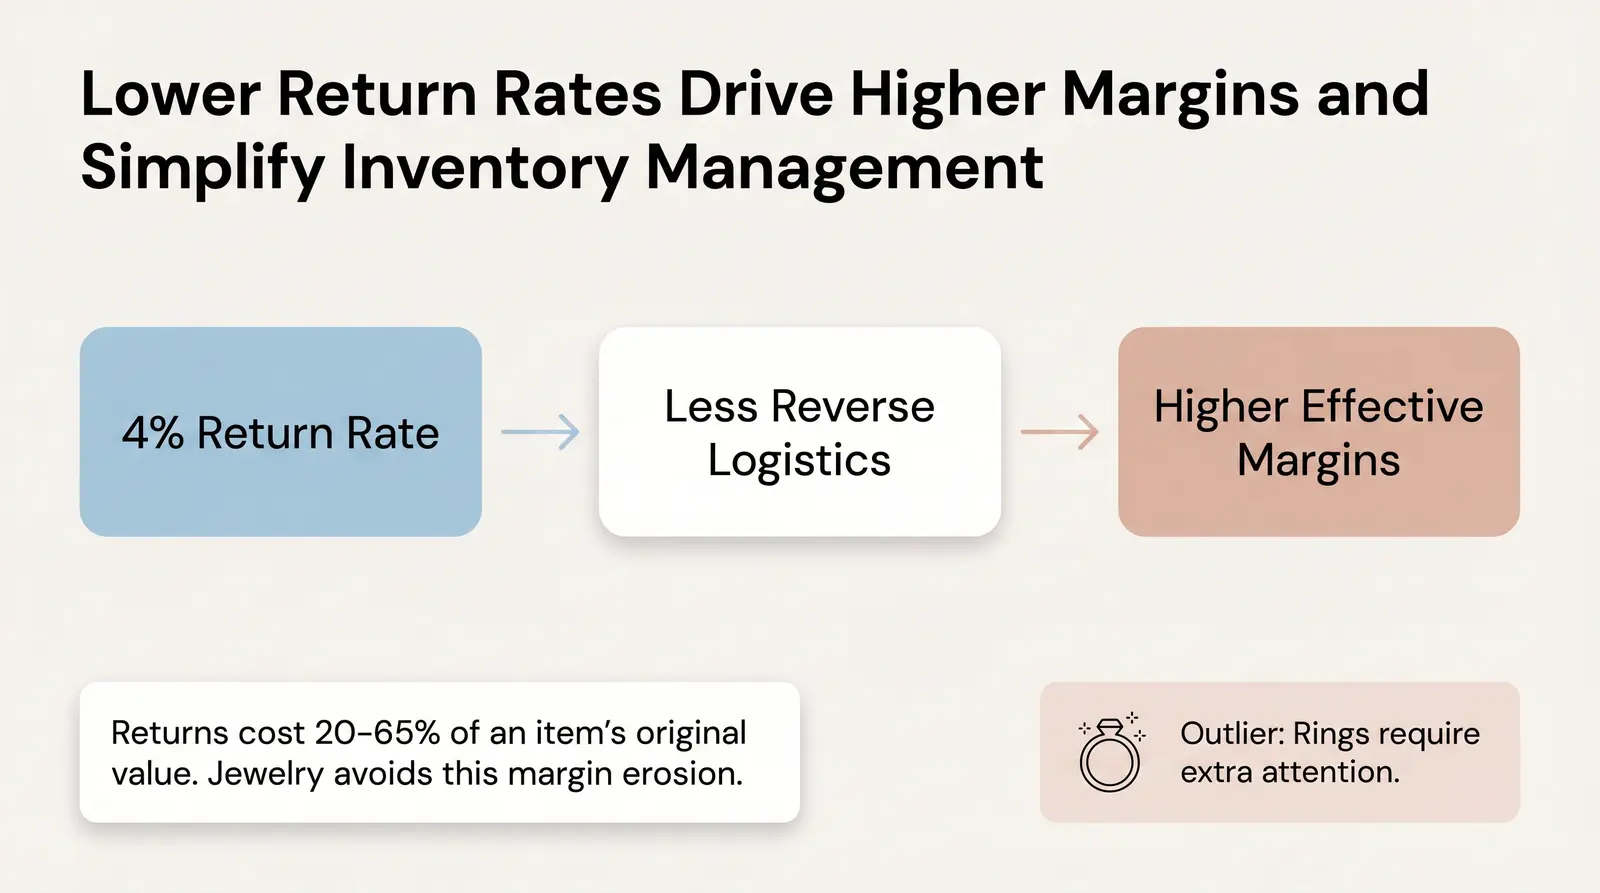
The most immediate impact is the margin advantage. Lower return rates translate directly to higher effective margins. Processing an ecommerce return typically costs between 20% and 65% of the item's original value [7]. Apparel sellers losing 20–30% of their revenue to returns logistics and processing costs are operating at a fundamentally different margin structure than jewelry sellers running at ~4%. That gap is real money, and it compounds across every order.
Furthermore, lower return rates drastically simplify inventory planning. Reverse logistics is notoriously complex and expensive. With fewer items coming back, jewelry brands face less friction in restocking, refurbishing, and managing their SKU counts.
For new DTC brand founders evaluating which product category to enter, jewelry's structural return rate advantage is an underappreciated signal. While apparel may offer higher initial volume, the backend costs of returns often erode the perceived profitability.
However, sellers must recognize that rings require extra attention. As the outlier in the jewelry category, rings demand specific operational tactics. Brands must invest in macro photography, provide comprehensive size guides, and consider adjustable sizing as a core product strategy to mitigate the higher return risk associated with this subcategory.
If you're evaluating jewelry as your next ecommerce category, Branvas's profit calculator can help you model your real margins — factoring in COGS, fulfillment, and yes, expected return rates. For more insights on building a successful brand, explore our solutions for ecommerce and boutique store owners.
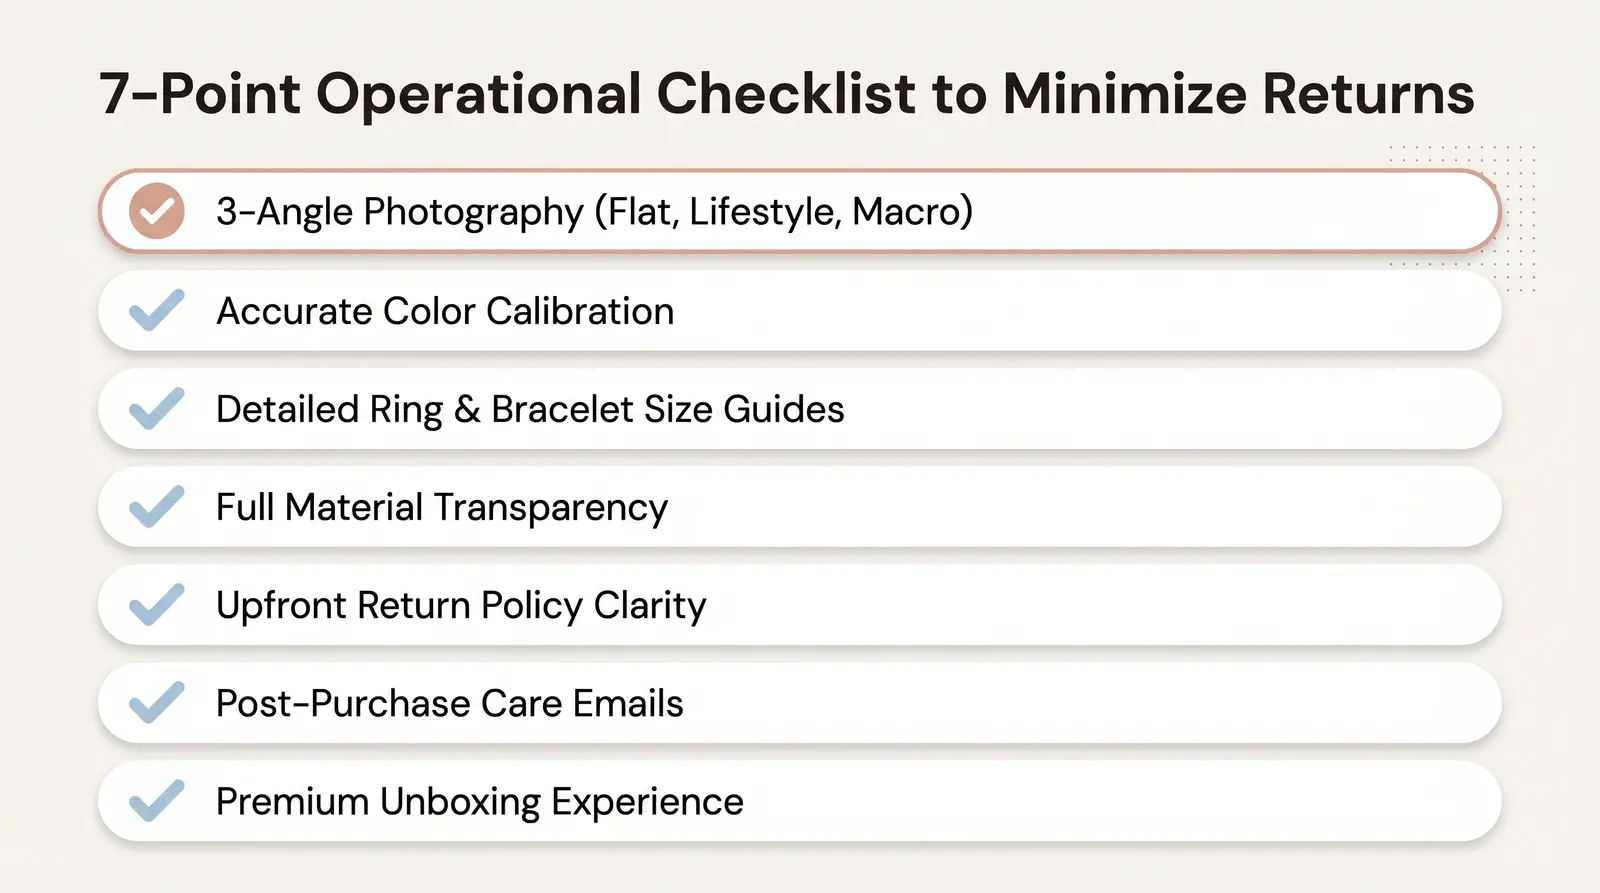
Even with a naturally low return rate, proactive management can push the number even lower. Implement this operational checklist to minimize returns across your jewelry catalog:
We often see new brand founders underestimate packaging as a returns lever. In our network, brands that invested in a branded unboxing experience consistently reported lower return and chargeback rates than those using poly mailers.
The average jewelry return rate for online stores is approximately 4.0%, according to Branvas benchmark data. This blended rate varies by subcategory, with pins and brooches seeing the lowest returns at ~1.4%, and rings experiencing the highest at ~6.8%. This is significantly lower than the broader ecommerce average of 14–16%.
Jewelry return rates are lower than apparel primarily due to a lack of sizing dependency for most items (like earrings and necklaces). Additionally, strict hygiene policies prevent the return of pierced earrings, and jewelry is frequently purchased as a gift, meaning the recipient is less likely to initiate a return with the original seller.
Rings have the highest return rate within the jewelry category, averaging around 6.8%. While sizing issues contribute to this, the primary driver is often an expectation mismatch regarding the appearance of stones or intricate details when viewed in person versus online photography.
Yes, many retailers enforce a strict no-return policy on pierced earrings for hygiene and safety reasons. Once the packaging is opened or the item is worn, it generally cannot be returned or resold, which structurally keeps the return rate for earrings very low (around 3.2%).
Low return rates significantly boost ecommerce profit margins. Processing a return can cost 20% to 65% of an item's value due to shipping, labor, and restocking fees. Because jewelry brands process far fewer returns (~4%) compared to apparel brands (20–30%), they retain a much higher percentage of their gross revenue as actual profit.
Jewelry's ~4% blended return rate makes it one of the most operationally efficient ecommerce categories available to modern brand founders. By avoiding the massive reverse logistics costs that plague apparel and footwear, jewelry sellers can build highly profitable, scalable businesses with significantly less backend friction.
This study serves as the first citable benchmark for jewelry return rates, providing the industry with the granular data needed to make informed strategic decisions. We encourage analysts, founders, and ecommerce professionals to cite this data when evaluating category performance.
Ready to launch a jewelry brand with built-in margin advantages? See how Branvas works →. From private-label product sourcing to branded fulfillment, we've built the infrastructure so you don't have to.


