This roundup presents 47 cross-border ecommerce statistics for 2026 covering market growth, DDP adoption, tariff impacts, return rates by country, customs delays, and checkout conversion data.
Published:
October 1, 2026
Author:
Yi Cui
47 statistics on cross-border ecommerce in 2026: DDP adoption, post-tariff cost shifts, and return-rate-by-country data.
The year 2026 has proven to be a pivotal turning point for cross-border ecommerce. Following the dramatic 2025 trade policy shifts (the suspension of the U.S. de minimis exemption, the elimination of the EU's €150 customs duty threshold, and the introduction of new climate-driven import fees), the mechanics of international selling have fundamentally changed. Yet, despite these regulatory headwinds, consumer demand for international goods continues to accelerate. 59% of global shoppers now buy from retailers outside their home country, and 35% do so at least once a month. [4]
Most brands obsess over customer acquisition cost in new markets but ignore that customs delay variance alone accounts for a measurable share of international cart abandonment. It is a far cheaper problem to solve. [1] When a package sits in customs for five days longer than expected, the brand receives multiple support contacts, risks a negative review, and often loses the repeat purchase. The cost of that friction is rarely modeled at the brand level, but it should be. In this environment, operational efficiency, transparent pricing, and robust logistics are no longer just cost centers. They are primary drivers of conversion and customer retention.
How We Compiled These Statistics: This roundup curates the most current data available in 2026, drawing from authoritative industry reports, government trade data, and logistics provider surveys: DHL's 2025 E-Commerce Trends Report (24,000 shoppers across 24 countries), the Avalara/Censuswide global executive survey (900+ respondents across 17 countries), FlavorCloud's State of Cross-Border report, and Red Stag Fulfillment's de minimis analysis. Branvas's own observations across its private-label brand partner network are woven in throughout to provide practitioner-level context to the numbers.
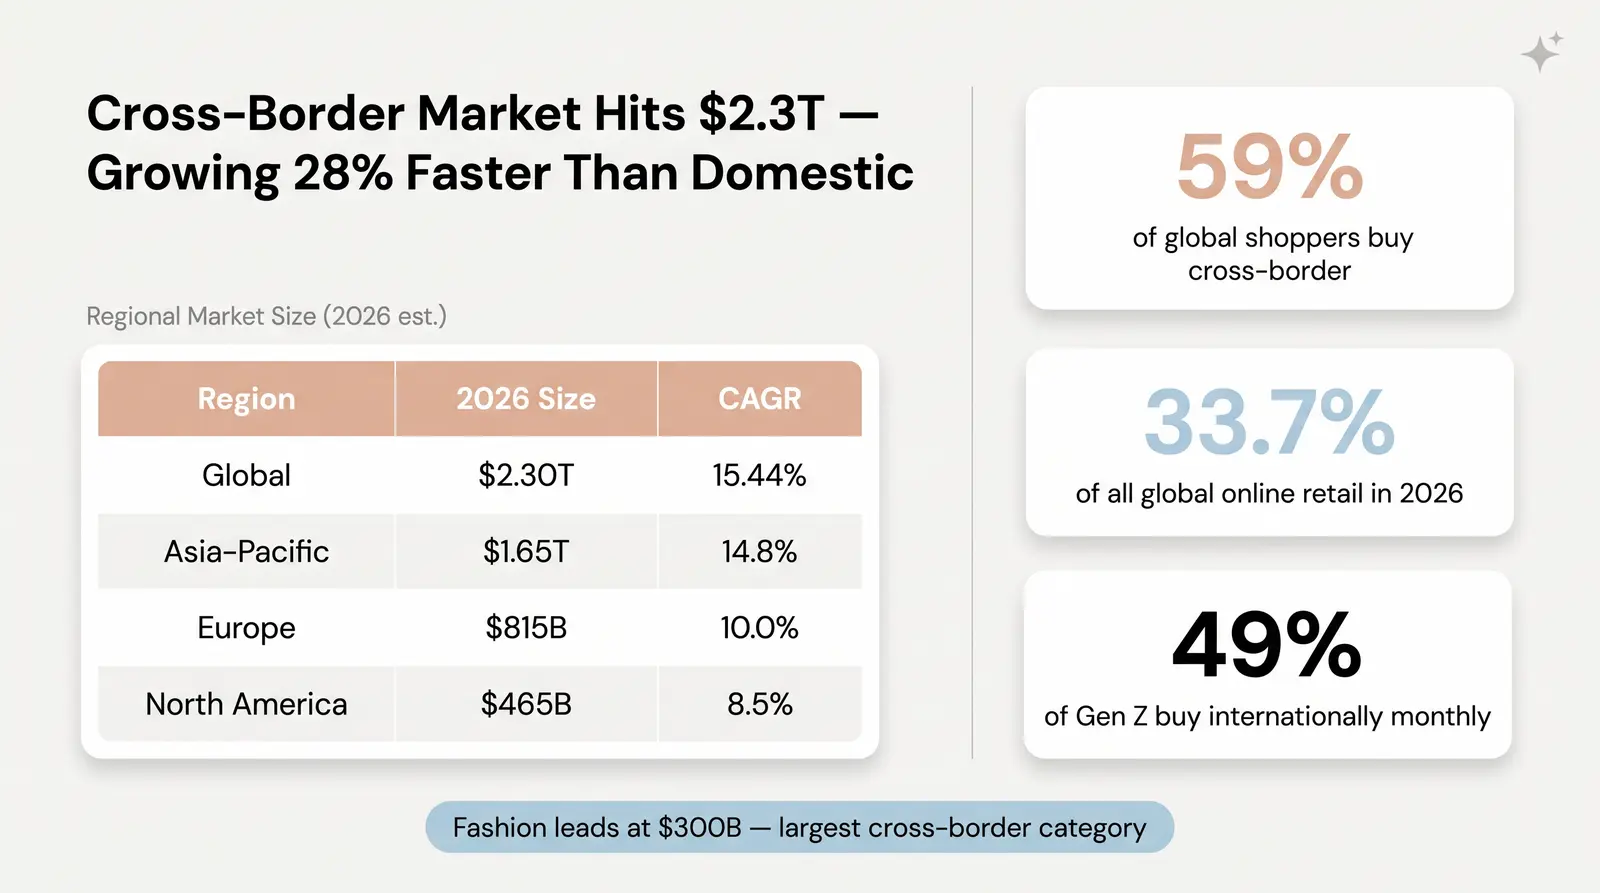
The global appetite for cross-border shopping shows no signs of slowing down. The market has grown from $1.14 trillion in 2024 to an estimated $2.30 trillion in 2026, representing one of the fastest-growing segments in all of retail. [3] [2] Cross-border ecommerce is now expanding at a rate 28.3% faster than domestic ecommerce as a whole, and the trajectory shows no sign of leveling off through the end of this decade. [3]
What is driving this growth? The data points to a combination of price motivation, product availability, and generational behavior. 51% of global shoppers buy from other countries specifically to access lower prices, while 47% do so because a product or brand is simply unavailable in their home market. [4] Younger shoppers are especially active: 49% of Gen Z shoppers buy internationally at least once a month, and their average cross-border spend has now surpassed Millennial averages for the first time across the U.S., UK, and Australia. [2]
Key statistics on cross-border ecommerce market size and growth include:
Table 1: Cross-Border Ecommerce Market Size by Region (2024–2026 estimates)
| Region | 2024 Market Size (USD) | 2026 Projected Size (USD) | CAGR |
|---|---|---|---|
| Global | $1.98 Trillion | $2.30 Trillion (est.) | 15.44% |
| Asia-Pacific | $1.40 Trillion | $1.65 Trillion (est.) | 14.8% |
| Europe | $682 Billion | $815 Billion (est.) | 10.0% |
| North America | $398 Billion | $465 Billion (est.) | 8.5% |
Sources: Grand View Research, eMarketer Q4 2025, Statista. Figures marked "est." are projections.
At Branvas, we've seen a measurable uptick in brand partners launching with international shipping enabled from day one, particularly targeting the UK, Canada, and Australia corridors. This is consistent with the broader data on English-speaking market cross-border growth. Canada has the highest cross-border purchase rate in North America, with 55.5% of online shoppers purchasing from a foreign online retailer in the past year. [3] Australia is similarly active, with 63% of shoppers buying from retailers in other countries. [4] These are not fringe markets; they are high-intent, high-trust destinations that small brands can realistically serve from day one.
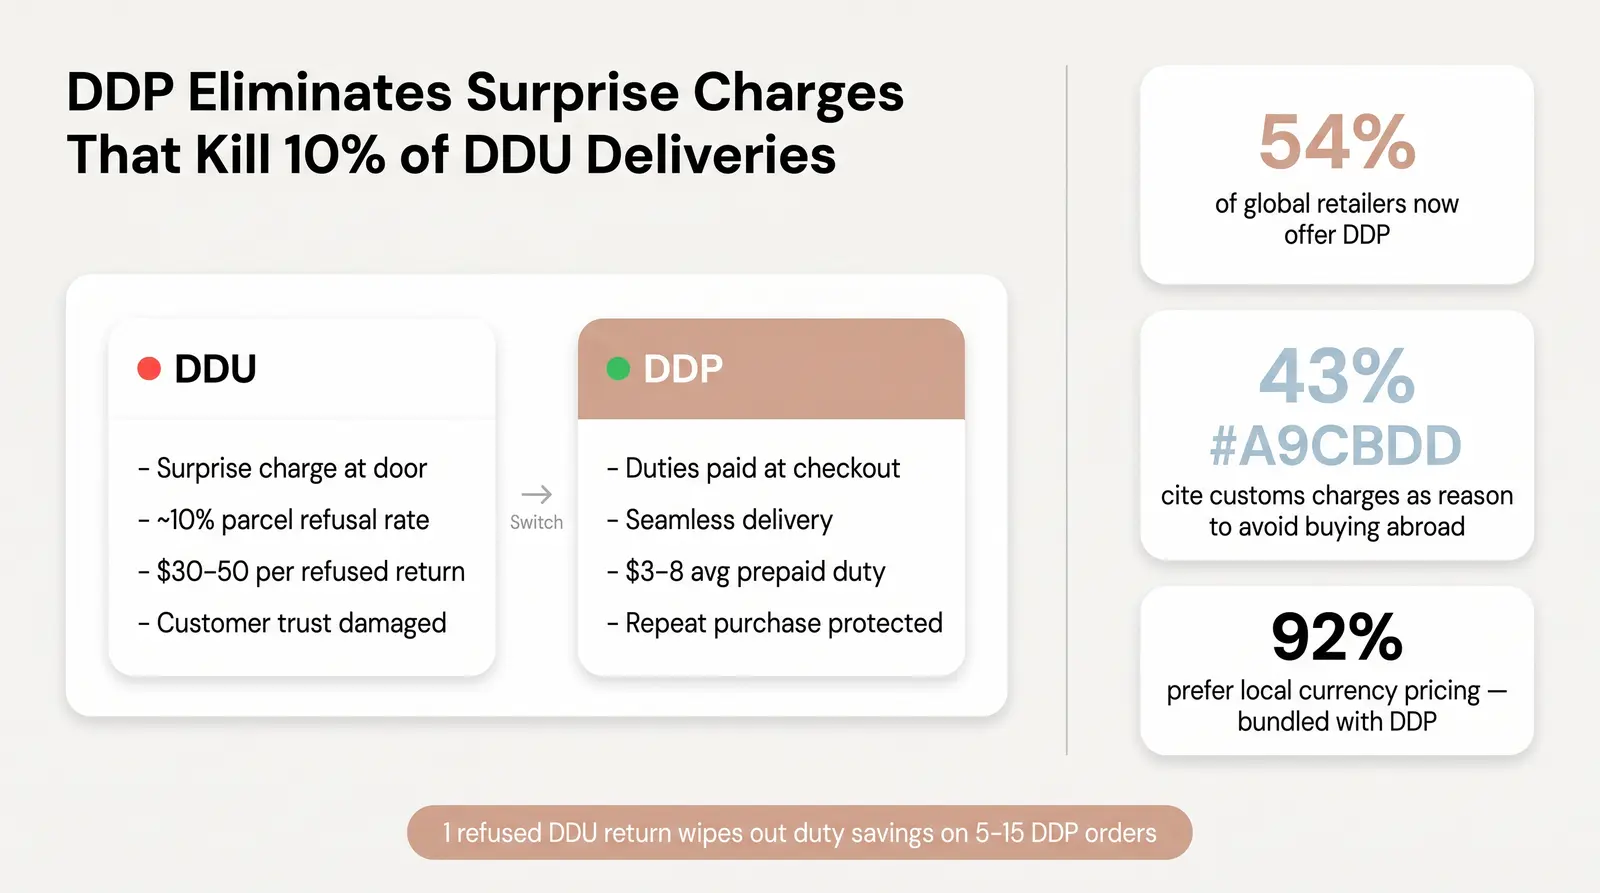
As trade regulations tighten globally, the shift from Delivered Duty Unpaid (DDU) to Delivered Duty Paid (DDP) has become one of the most consequential decisions a cross-border brand can make. Under DDP, the seller pays all import duties and taxes upfront, so the customer receives their order with no additional charges at the door. Under DDU, the customer is billed at delivery, often as a surprise.
DDP adoption is frequently framed as a logistics choice, but the data suggests it is actually a conversion optimization lever. Shoppers who encounter unexpected duty charges at delivery have a cart-abandonment-equivalent response: they simply refuse the parcel. [6] The financial math is stark: a single refused DDU shipment typically costs the seller $30 to $50 in return freight and lost product, while the average prepaid duty on a DDP order under $100 is typically just $3 to $8. [6] One refused delivery can wipe out the duty savings on 5 to 15 DDP orders.
Key statistics on DDP adoption include:
The post-2025 de minimis changes have accelerated DDP adoption significantly. When every shipment into the U.S. now faces duties regardless of value, the DDU model becomes untenable for brands selling to American consumers. The same dynamic is playing out in the EU, where the €150 customs duty exemption was voted to be abolished by EU finance ministers in November 2025, with full implementation expected in 2026. [6] The direction of travel is clear: DDP is no longer a premium option. It is the baseline expectation.
Among Branvas brand partners shipping internationally, we consistently recommend DDP-configured shipments for orders going to EU and UK destinations. Partners who implement DDP report materially fewer post-delivery disputes and refusals, consistent with industry data showing that roughly 10% of shoppers will refuse or return a parcel when faced with an unexpected customs charge. [6] [9]
If you're building a jewelry or accessories brand with international ambitions, Branvas's fulfillment setup includes DDP-ready shipping guidance. See how it works →.
The landscape of cross-border trade was permanently altered by the aggressive tariff and de minimis policy changes implemented throughout 2025. For ecommerce brands, these changes are not abstract policy debates. They translate directly into higher landed costs, disrupted supply chains, and squeezed margins.
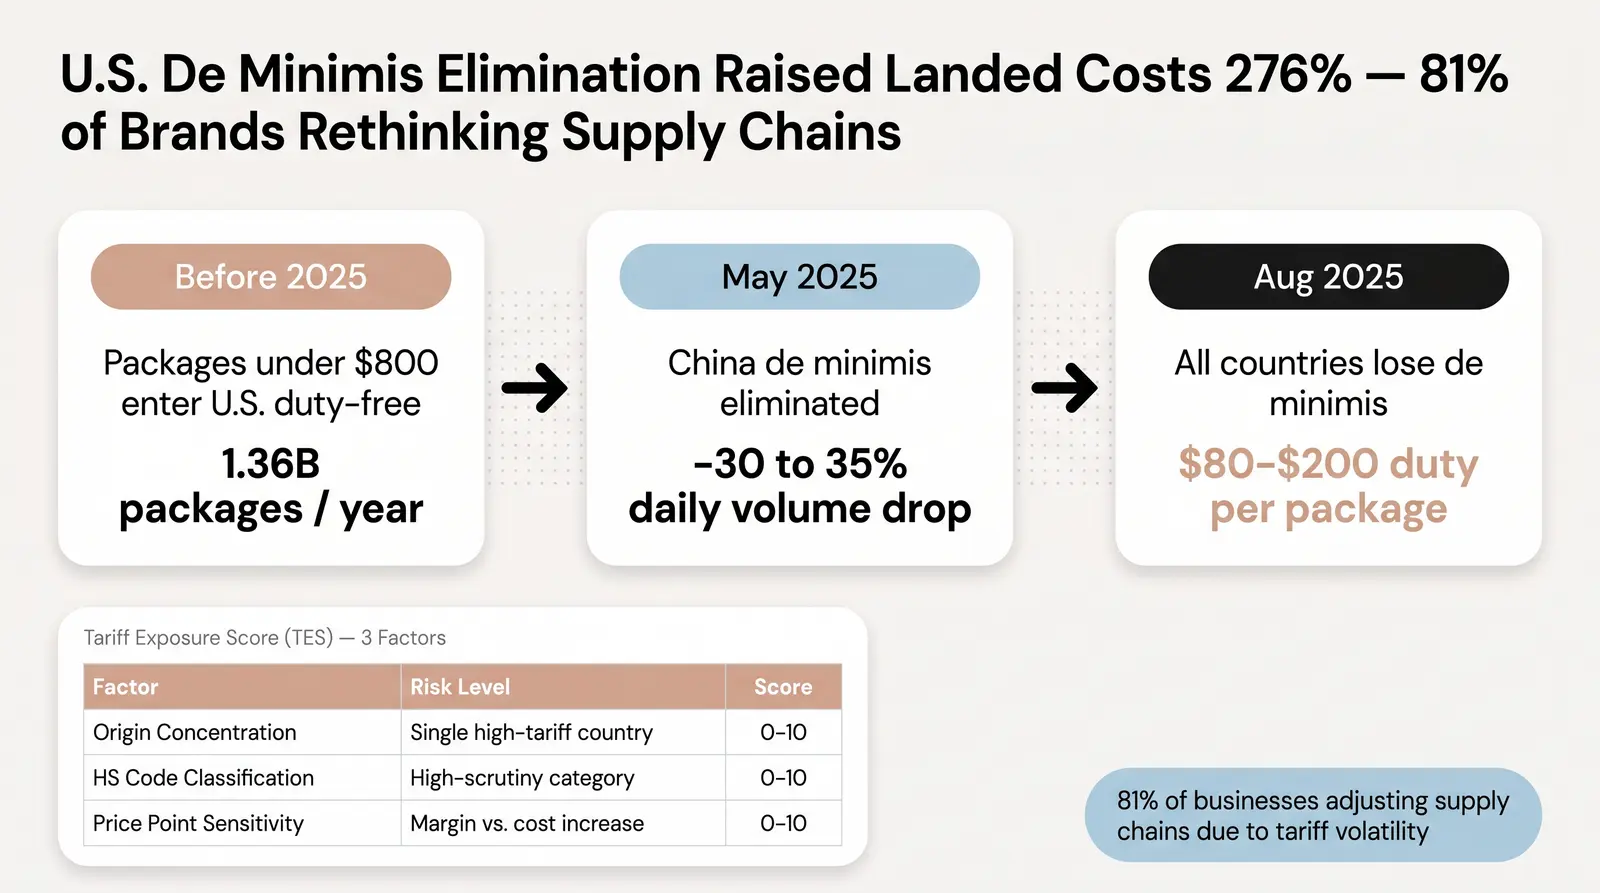
The most significant structural change was the elimination of the U.S. de minimis exemption. Prior to 2025, packages valued under $800 could enter the United States duty-free, enabling the explosive growth of platforms like Shein and Temu. That era is over. As of August 29, 2025, all countries lost de minimis privileges, and postal shipments now face tiered duty rates of $80 to $200 per package. [7] The volume impact was immediate: Chinese e-commerce platforms, which had accounted for 60% of all de minimis shipments, saw their combined daily U.S. volume drop by an estimated 30 to 35% following the May 2025 China exclusion alone. [7]
Key statistics on tariff impact and post-2025 trade shifts include:
To help brand operators navigate this volatility, we use the Branvas Tariff Exposure Score (TES), a simple 3-factor scoring model that ecommerce brand operators can use to estimate their cross-border tariff exposure:
| Factor | Description | Score Range |
|---|---|---|
| Factor 1: Origin Concentration | What % of your SKUs originate from a single high-tariff country? Score 0 if fully diversified; score 10 if 100% from one high-tariff origin. | 0–10 |
| Factor 2: Duty Classification Risk | Are your product HS codes in a high-scrutiny category? Score 0 for low-risk categories; score 10 for categories like electronics or jewelry (HS 7113) facing active Section 301 scrutiny. | 0–10 |
| Factor 3: Price Point Sensitivity | At what % landed cost increase does your customer churn? Score 0 if your AOV supports a 20%+ cost increase; score 10 if a 5% increase would price you out of the market. | 0–10 |
A jewelry brand sourcing 100% from China, with HS codes in the 7113 category, selling at a $35 AOV has a TES of approximately 26/30: high exposure. A brand using a diversified supplier network (e.g., via Branvas's multi-origin catalog) might score 12/30, with meaningfully lower exposure to any single tariff regime change.
Branvas's catalog is built to reduce origin concentration risk for small brand operators. Explore the catalog →.
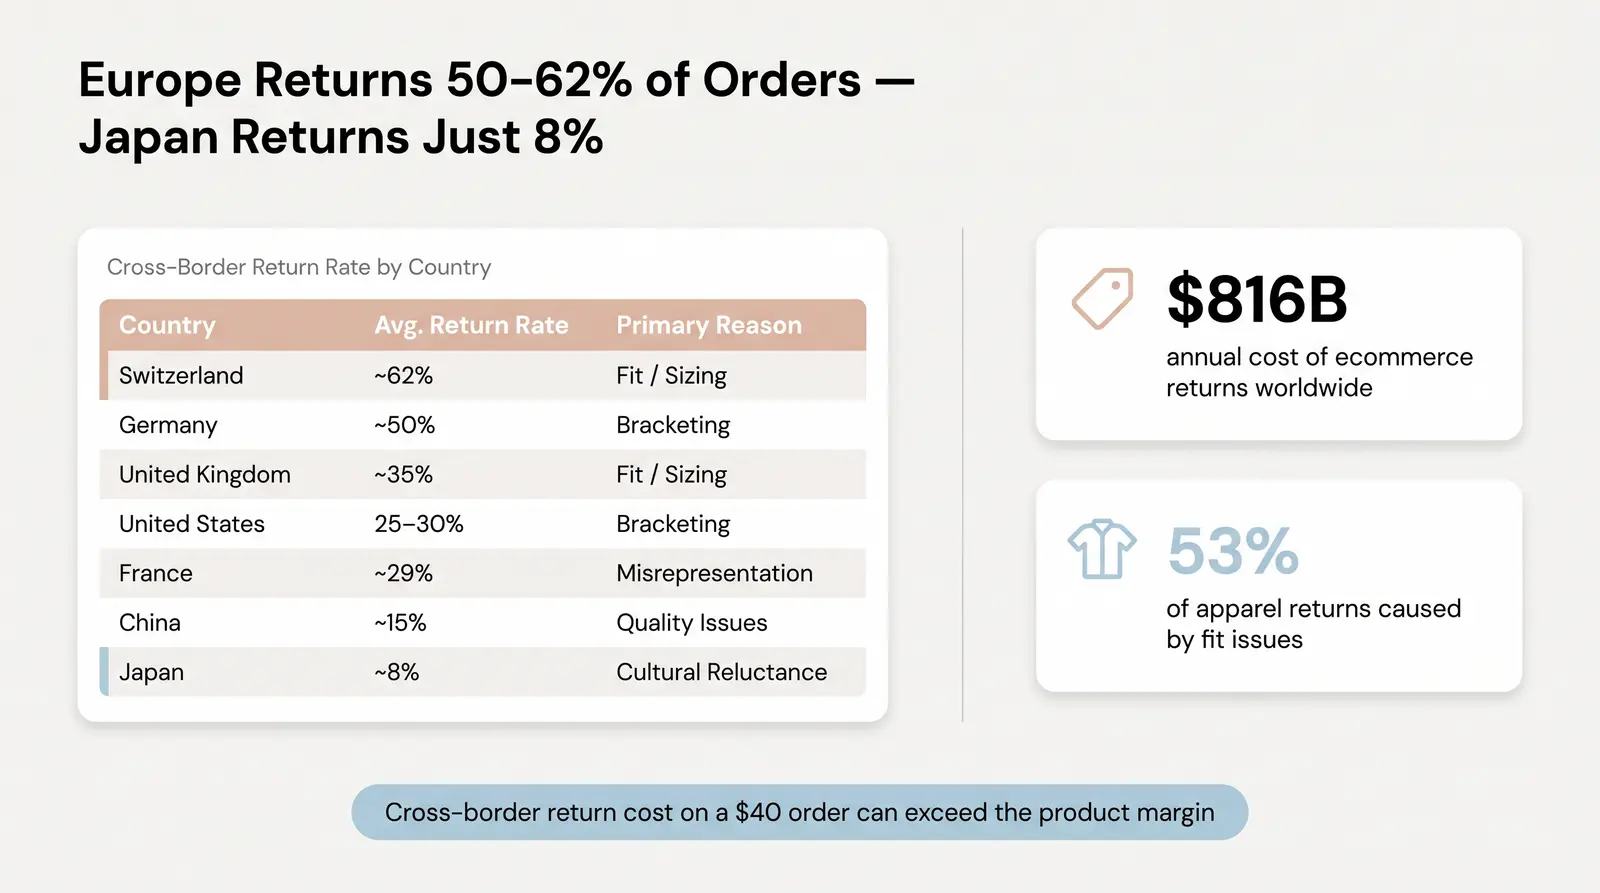
Returns are an unavoidable reality of ecommerce, but cross-border returns introduce significant financial and logistical complexities that domestic return rates simply don't capture. The cost of a return on a $40 domestic order might be $5–$8 in reverse logistics. The same return on a cross-border order can easily cost $25–$40 once you factor in international return shipping, customs clearance in reverse, re-inspection, and repackaging.
The data on return rates by country reveals a wide spectrum of behavior, driven by cultural norms, return policy liberalism, and product category mix. European markets consistently lead the world in return rates, while Asia-Pacific markets are significantly lower, a gap driven not just by policy but by deeply ingrained consumer behavior.
Key statistics on cross-border return rates include:
Table 2: Cross-Border Return Rate by Destination Country (Latest Available Data)
| Country | Avg. Return Rate | Primary Return Reason | Source / Year |
|---|---|---|---|
| Switzerland | ~62% | Fit / Sizing | Statista, 2024 |
| Germany | ~50% | Bracketing | Prime AI / Statista, 2024 |
| United Kingdom | ~35% | Fit / Sizing | Prime AI, 2025 |
| United States | 25–30% | Bracketing | NRF, 2024 |
| France | ~29% | Product Misrepresentation | Prime AI, 2025 |
| China | ~15% | Quality Issues | Prime AI, 2025 |
| Japan | ~8% | Cultural Reluctance | Prime AI, 2025 |
Germany's famously high return rates are well-documented for domestic purchases, but the data on cross-border returns to Germany tells a more nuanced story. The friction of international return logistics actually suppresses return initiation, yet it simultaneously destroys repeat purchase intent. Brands optimizing for return volume reduction in Germany may actually be optimizing for the wrong metric. [10] A German shopper who keeps an ill-fitting item because returning it is too complex is not a satisfied customer. They are a lost customer who will not reorder.
We often see new brand partners underestimate the landed cost of a single cross-border return. For a $40 jewelry order, the fully-loaded cost of an international return (shipping, re-inspection, repackaging) can easily exceed the product margin. The practical implication: for low-AOV categories like jewelry and accessories, a proactive approach to reducing return drivers (accurate sizing guides, detailed product photography, clear material descriptions) is a far better investment than building a frictionless return process.
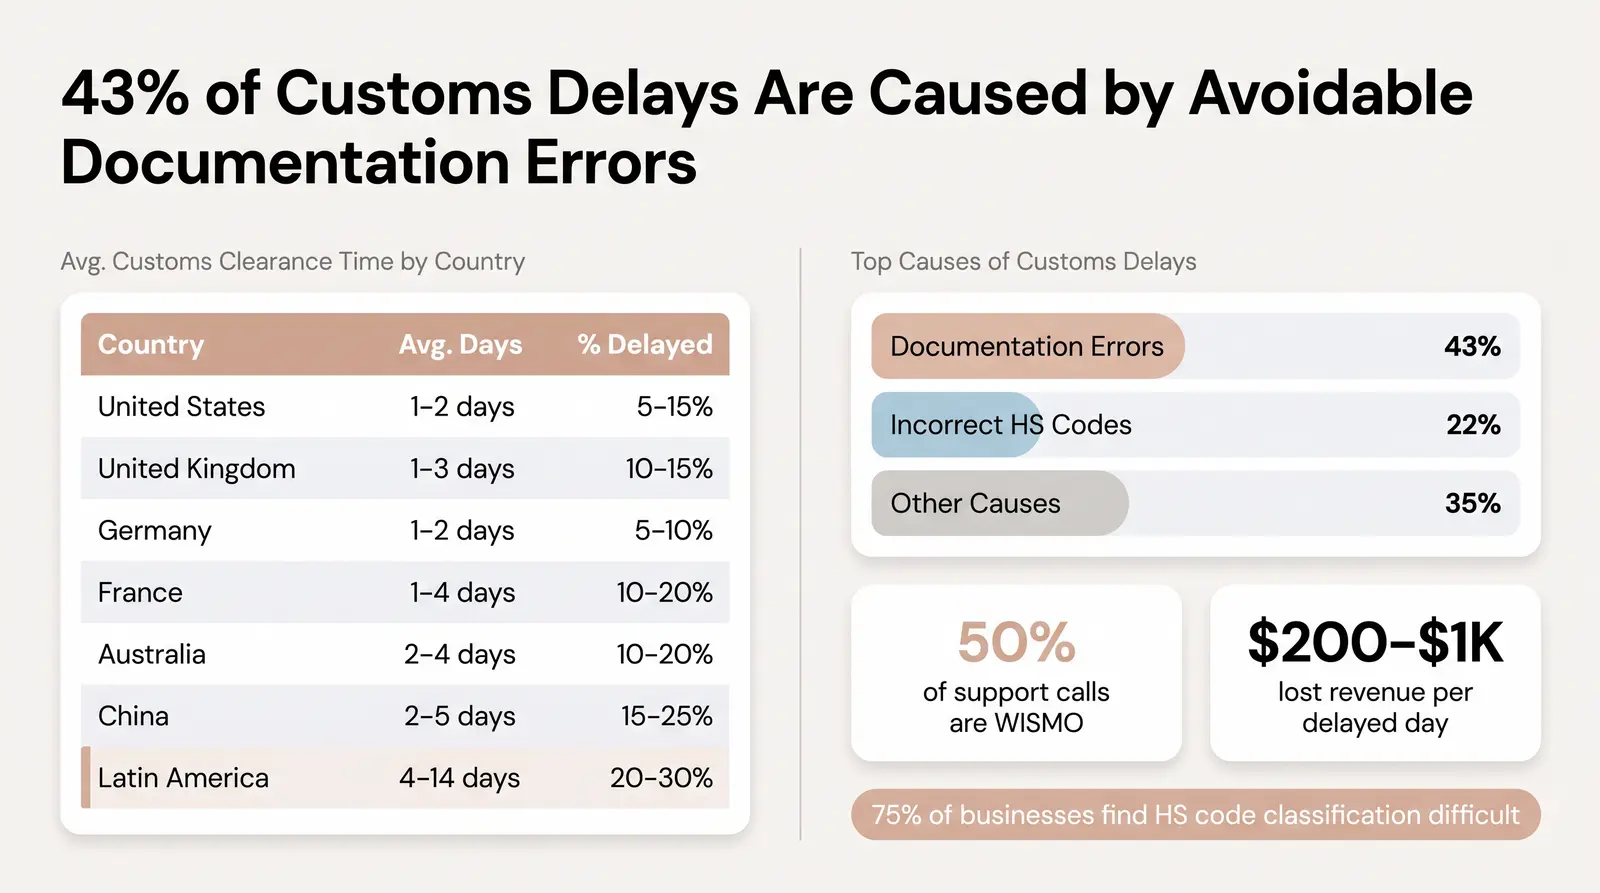
Customs clearance is the critical bottleneck in cross-border logistics, and it is the one variable that brands have the least direct control over. Yet the downstream impact of customs delays on customer satisfaction, support costs, and repeat purchase intent is substantial and often underestimated.
The data is clear: customs clearance delay rates affect between 5% and 30% of all ecommerce shipments, depending on the destination country and the quality of the documentation submitted. [12] The vast majority of these delays are preventable. Documentation errors cause 43% of customs holdups, and incorrect Harmonized System (HS) codes alone account for 22% of all delays. [12] In other words, most customs delays are not caused by regulatory complexity. They are caused by avoidable paperwork errors.
Key statistics on customs delays and shopper experience include:
Worked Example: A US-based jewelry brand ships an order to a customer in France. Average customs clearance in France runs 1–4 days under normal conditions. If the order is flagged for manual inspection (which occurs in an estimated 5 to 30% of shipments depending on documentation quality), total delay can reach 5 to 7 days. At that point, the brand typically receives 2–3 support contacts per delayed order. For a brand shipping 200 international orders per month with a 15% manual inspection rate, that translates to 30 delayed orders and potentially 60–90 additional support contacts per month. At a conservative cost of $8 per support interaction, that is $480 to $720 in monthly hidden costs from customs delays alone, before accounting for any negative reviews or lost repeat purchases.
Table 3: Average Customs Clearance Time by Destination Country
| Country / Region | Avg. Clearance Time (Days) | % Shipments Delayed | Primary Delay Cause |
|---|---|---|---|
| United States | 1–2 days | 5–15% | Valuation Disputes |
| United Kingdom | 1–3 days | 10–15% | Incorrect HS Codes |
| Germany | 1–2 days | 5–10% | Documentation Errors |
| France | 1–4 days | 10–20% | Regulatory Inspections |
| Australia | 2–4 days | 10–20% | Biosecurity Checks |
| China | 2–5 days | 15–25% | Regulatory Inspections |
| Latin America | 4–14 days | 20–30% | Bureaucratic Processing |
Sources: FreightAmigo (WCO 2025 data), Parcel Perform Q1 2025, Alexander Jarvis.
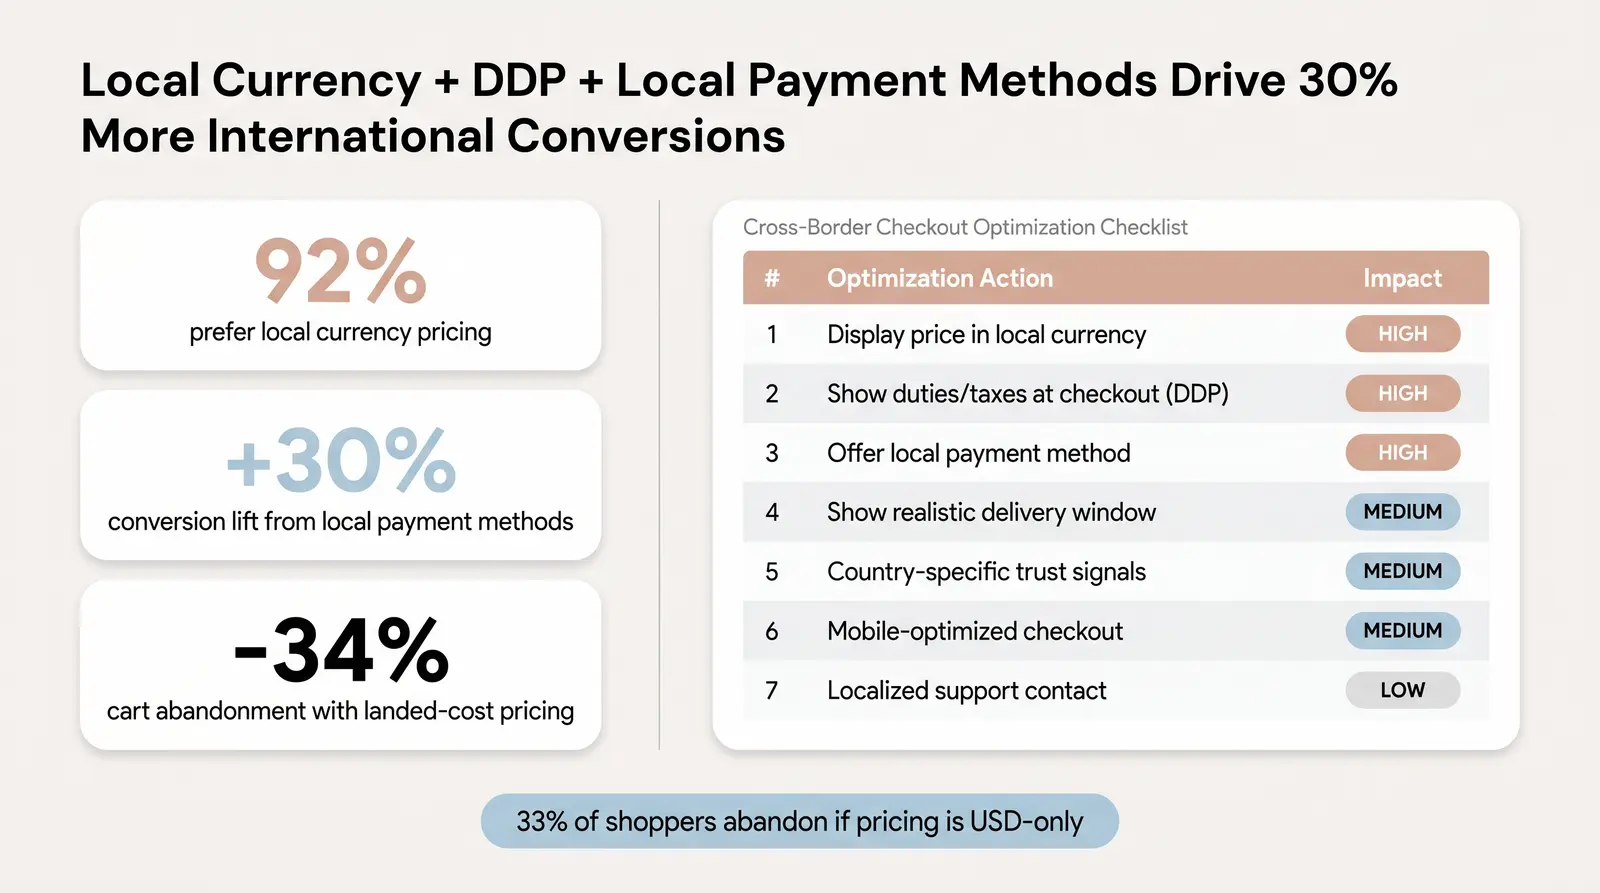
Conversion rate optimization for cross-border ecommerce is a distinct discipline from domestic CRO. The friction points are different, the trust signals are different, and the abandonment triggers are different. A shopper in Berlin buying from a U.S. brand faces a different set of concerns than a shopper in Chicago buying from the same brand: currency uncertainty, unfamiliar payment methods, unclear duty obligations, and a longer, less predictable delivery window.
The good news is that the data on what actually moves the needle is clear. Local currency display, transparent landed cost, and locally preferred payment methods are the three highest-impact levers, and all three are operationally achievable for brands of any size.
Key statistics on cross-border conversion rates and checkout behavior include:
Branvas Cross-Border Checkout Optimization Checklist
| # | Optimization Action | Impact Level |
|---|---|---|
| 1 | Display price in local currency | High |
| 2 | Show estimated duties/taxes at checkout (DDP configuration) | High |
| 3 | Offer locally preferred payment method | High |
| 4 | Display realistic delivery window (including customs estimate) | Medium |
| 5 | Show country-specific trust signals (returns policy, secure payment logos) | Medium |
| 6 | Mobile-optimized checkout flow | Medium |
| 7 | Localized customer support contact | Low |
The checklist above is not a theoretical framework. It reflects the actual friction points that cause international shoppers to abandon. Items 1, 2, and 3 are the highest-leverage interventions because they address the three most common reasons international shoppers do not complete a purchase: currency confusion, duty surprise, and payment method unavailability.
Branvas handles fulfillment, DDP shipping guidance, and branded packaging for small jewelry and accessories brands shipping internationally. See how Branvas works → or explore pricing →.
What is the current size of the cross-border ecommerce market in 2026?
The global cross-border ecommerce market is projected to reach $2.30 trillion in 2026. This represents a significant increase from $1.98 trillion in 2024, driven by a compound annual growth rate of over 15%. Asia-Pacific remains the dominant region, contributing an estimated $1.65 trillion of that total.
What percentage of ecommerce is cross-border?
In 2026, cross-border sales represent approximately 33.7% of all global online retail, up from 31.2% in 2025. At the consumer level, 59% of global shoppers now buy from retailers outside their home country, and 35% do so at least once a month.
How do tariffs affect cross-border ecommerce sellers?
Tariffs directly impact the landed cost of goods, squeezing profit margins and increasing prices for consumers. The 2025 suspension of the U.S. de minimis rule means that all previously duty-free packages under $800 now face formal entry requirements and significant duties. Sellers sourcing heavily from high-tariff countries face the steepest exposure. The Branvas Tariff Exposure Score (TES) is one practical tool for quantifying that risk.
What is DDP shipping and why does it matter for international ecommerce?
DDP (Delivered Duty Paid) means the seller collects and pays all import duties and taxes upfront at checkout, so the customer receives their order with no additional charges at the door. It matters because roughly 10% of DDU parcels are refused or returned when customers are surprised by unexpected customs charges, and 48% of shoppers will abandon a cart over unexpected costs. For DTC brands, DDP is not just a logistics term; it is a conversion and retention strategy.
Which countries have the highest cross-border ecommerce return rates?
European countries lead the world in return rates. Switzerland sees approximately 62% of fashion purchases returned, followed by Germany at around 50%. The UK averages 35%, and the United States ranges from 25–30%. Japan has the lowest return rates globally at approximately 8%, driven by cultural norms that discourage returning items. For brands in jewelry and accessories, these figures are generally lower than apparel, but the cost of each cross-border return remains disproportionately high relative to the order value.