This report breaks down cross-border ecommerce return rates by country, reveals the true cost of international returns, and provides six operational strategies to reduce refund delays and protect review scores.
Published:
May 6, 2026
Author:
Yi Cui
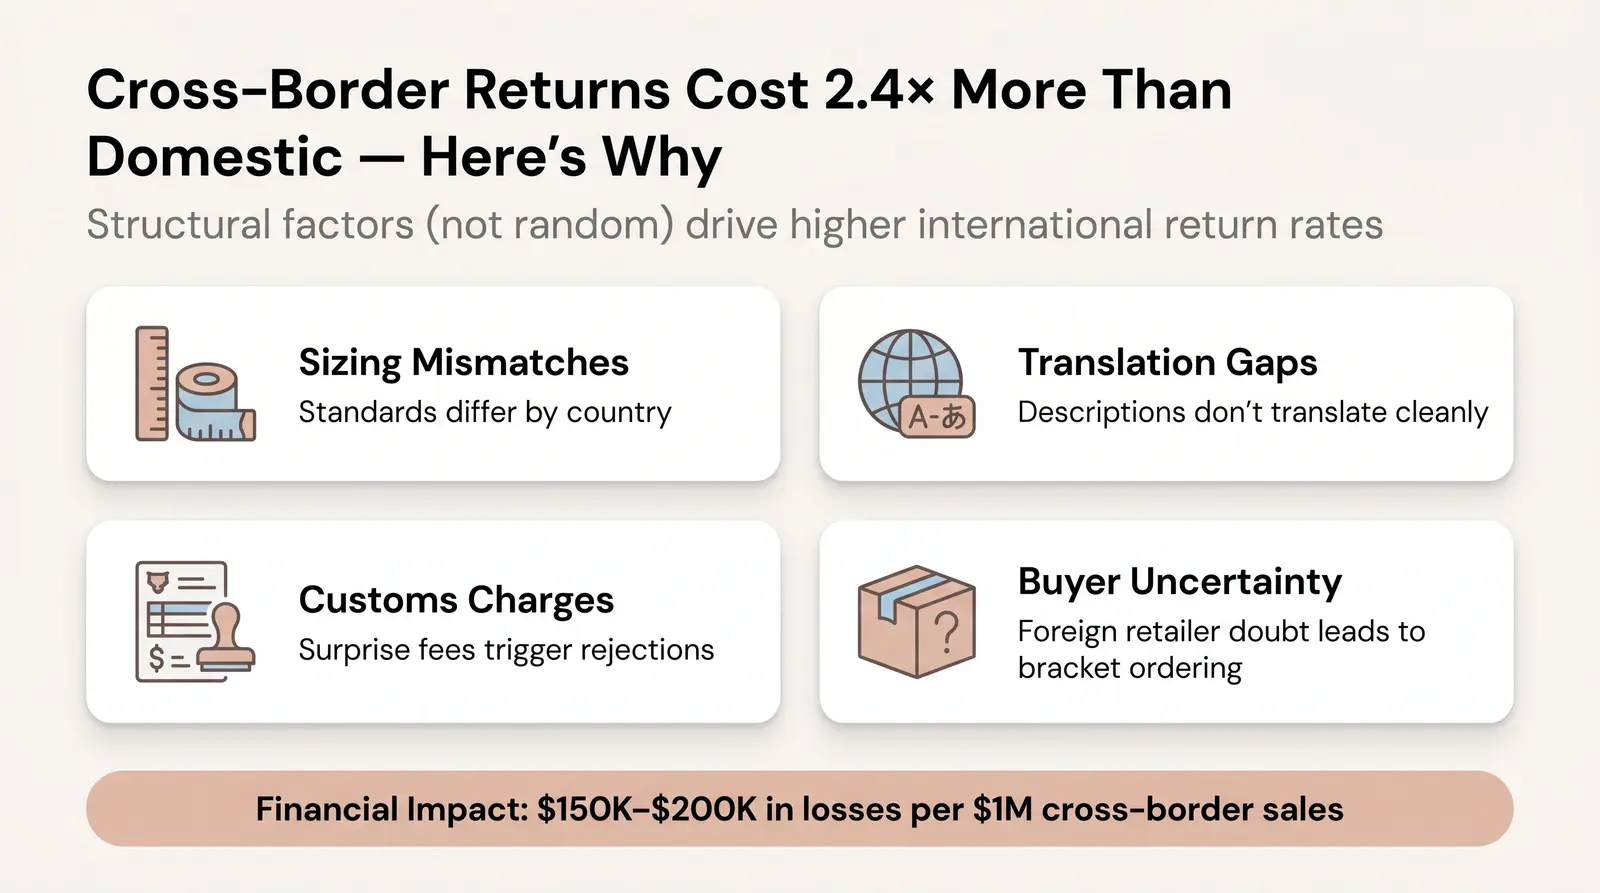
International orders return at 2.4x the domestic rate. But it's the refund-cycle delay, not the rate itself, that destroys your review score.
For ecommerce founders and brand builders, going international feels like unlocking a growth cheat code. You tap new markets, reach millions of buyers, and watch your top-line revenue climb. But there is a hidden tax on global expansion that rarely makes it into the pitch deck: the cross-border return.
When a domestic customer returns a product, it is a minor inconvenience. When an international customer returns a product, it triggers a complex, expensive, and time-consuming reverse logistics chain. Customs delays, unrecovered duties, and high return shipping costs can quickly turn a profitable sale into a net loss.
More critically, the extended timeline required to process international returns creates a gap between what customers expect and what actually happens. This gap, which we call the Refund Cycle Delay, is the silent killer of ecommerce brands. It drives negative reviews, destroys customer lifetime value, and erodes the trust you spent months building.
In our work with cross-border sellers, we often see founders hyper-focused on reducing their return rate. While minimizing returns matters, the data consistently shows that managing the timeline and cost of the return is the more critical lever for long-term brand health.
This report breaks down the real numbers behind cross-border returns, from country-specific rates to the hidden costs of reverse logistics, to the statistical relationship between refund delays and review scores. It ends with operational recommendations you can implement immediately.
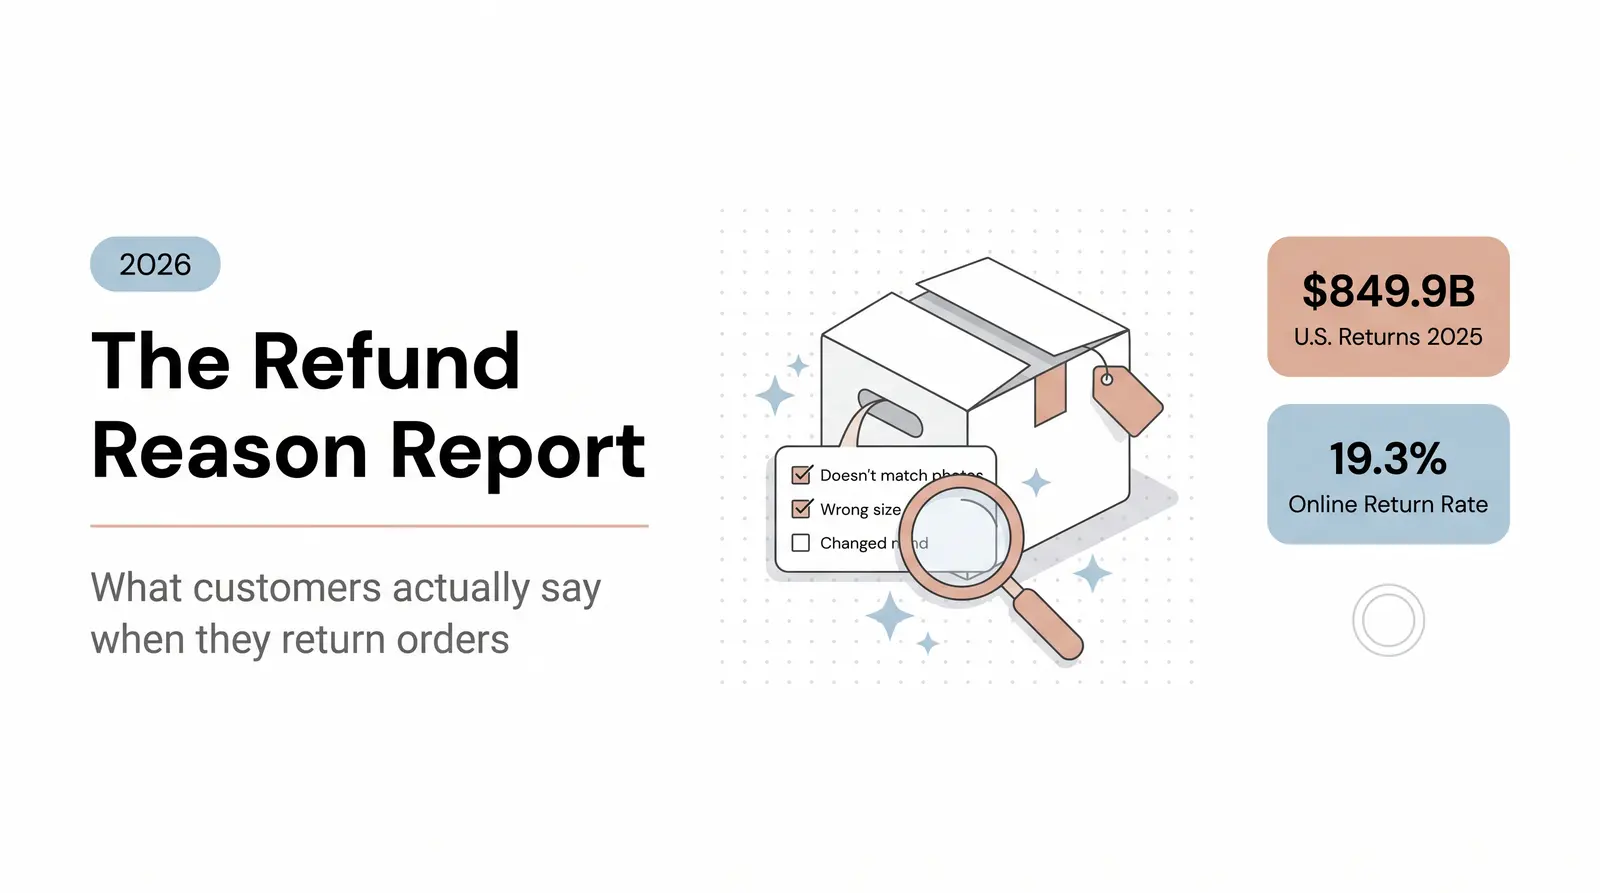
Brick-and-mortar retail sees return rates of roughly 8% to 10%. Online retail sees 20% to 30% across most categories, and in apparel that figure regularly exceeds 40% [1]. Cross-border orders sit at the top of that range.
The reasons are structural, not random. Customers buying from a foreign store face sizing mismatches (a US Medium is not a Japanese Medium), product descriptions that don't translate cleanly, surprise customs charges on delivery, and a general lack of confidence that the product will match the listing. When any of these expectations are violated, the item comes back.
A 2025 study by IMRG found that cross-border return rates averaged 25% across categories, with apparel and footwear running significantly higher [2]. That compares to a domestic online return rate of roughly 10% to 15% for the same categories. The 2.4x multiplier is not an exaggeration. It is a conservative estimate for many product types.
The financial exposure is real. A Shopify analysis found that every $1 million in cross-border sales without a structured returns plan can result in $150,000 to $200,000 in return-related losses [2]. Most brands discover this after the damage is done.
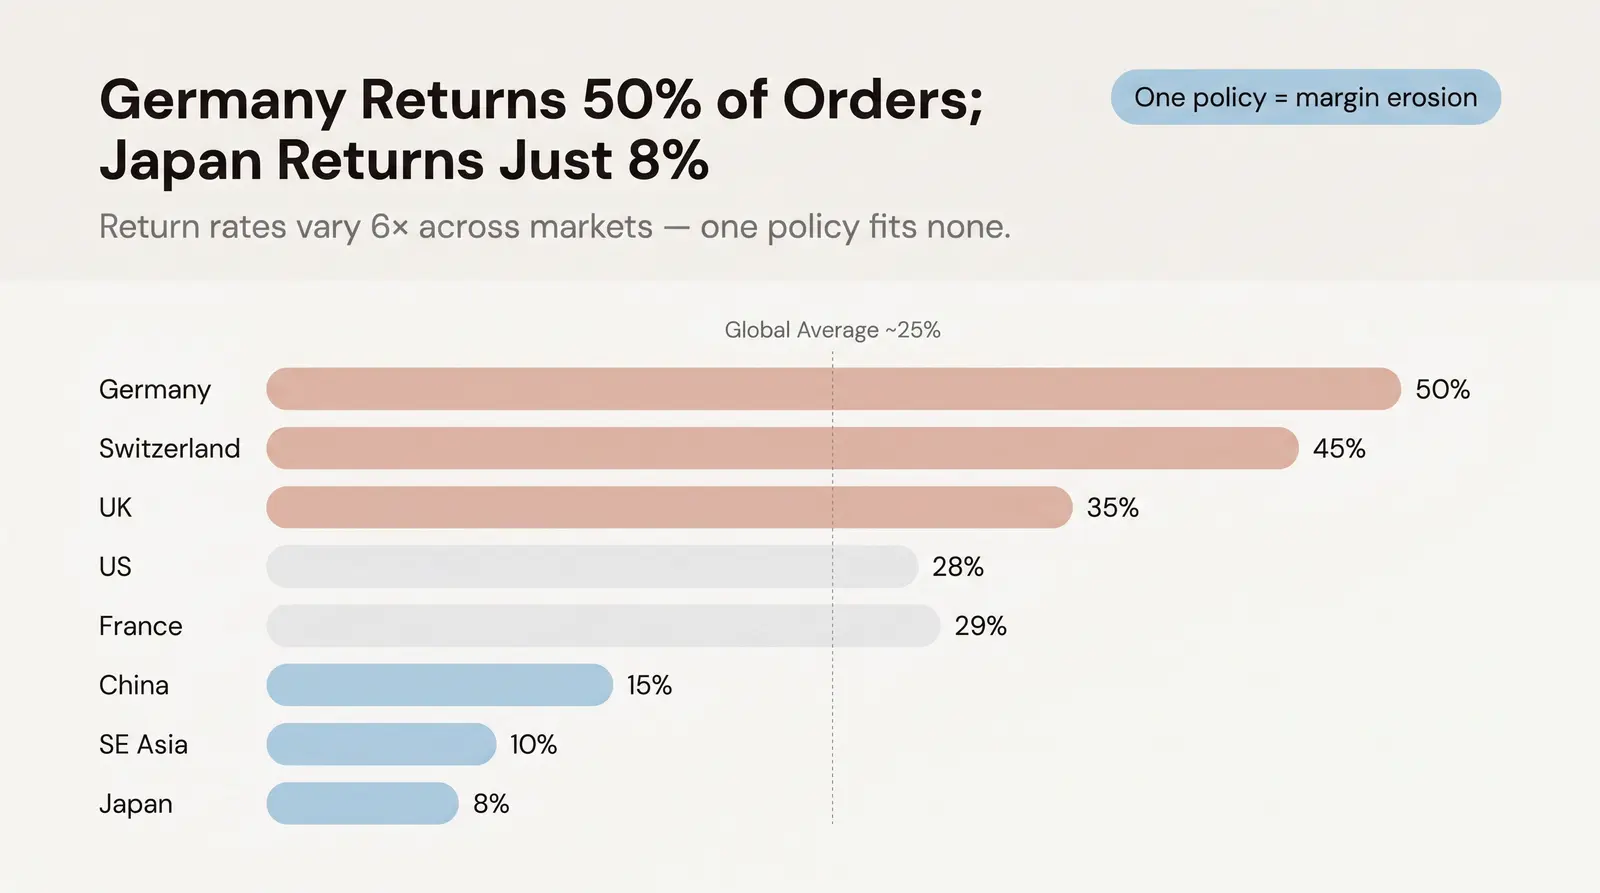
Cross-border return rates are not uniform. They vary by country, product category, and the cultural norms of the buyer. Europe consistently leads globally, driven by liberal consumer protection laws and a deeply ingrained culture of "bracketing," where shoppers order multiple sizes or colorways with the intent to return whatever doesn't fit. Asia-Pacific markets sit at the opposite extreme, held down by cultural norms that discourage returns and logistical friction that makes the process inconvenient.
The table below reflects apparel and fashion category benchmarks, which are the most return-intensive product type and the most relevant for jewelry and accessories brands.
| Country | Average Return Rate | Primary Drivers |
|---|---|---|
| Germany | ~50% | Catalog-shopping heritage; bracketing is culturally normalized; strong consumer protection laws [3] |
| Switzerland | ~45-62% | Highest in Europe; liberal policies and high purchasing power [3] |
| Austria | ~36% | Similar cultural patterns to Germany [3] |
| United Kingdom | ~35% | "Try-before-you-buy" culture; high expectations for free and easy returns [3] |
| France | ~29% | Lower than UK/Germany due to stronger emphasis on accurate product descriptions [3] |
| United States | 25-30% | Widespread bracketing; Amazon effect has set high return expectations [3] |
| Italy | ~22% | Conservative shopping habits; cultural reluctance to return items [3] |
| India | 10-20% | Cash-on-delivery prevalence leads to rejected deliveries rather than traditional returns [3] |
| China | ~15% | Affordable pricing reduces financial incentive to return; logistics friction discourages casual returns [3] |
| Southeast Asia | ~10% | Logistical costs and cautious purchasing behavior keep rates low [3] |
| Japan | ~8% | Strong cultural aversion to returning items; high trust in local brands [3] |
Source: Prime AI Industry Benchmarks for Clothing Return Rates by Product Category and Country, January 2025 [3].
For a brand selling globally, these variances mean that a single return policy applied across all markets is a recipe for margin erosion. A 30-day free returns policy that works fine in Japan will expose you to serious financial risk in Germany.
Return rates also shift significantly by product type. Dresses and skirts see the highest rates globally, with dresses averaging around 54% in Western markets [3]. Shoes follow at 35% to 45%. Accessories and jewelry typically sit lower, in the 15% to 25% range for online purchases, because sizing is less of a factor and product photography can more accurately represent the item.
This is one reason jewelry and accessories brands, particularly those operating through a private-label fulfillment model, tend to see more manageable return rates than apparel brands. The core problem shifts from fit to expectation mismatch, which is solvable through better product content and photography.
Most ecommerce operators calculate the cost of a return as the refund amount plus the return shipping label. This is a dangerous oversimplification.
The true cost of processing a single ecommerce return averages $21.50 in operational costs before the refund amount is factored in [4]. That figure covers return shipping, receiving and inspection, restocking labor, customer service time, refund processing, inventory adjustment, packaging materials, and IT overhead.
When that return crosses an international border, two additional cost layers appear that most brands fail to account for.
Unrecovered duties and taxes. When an item is shipped internationally under Delivered Duty Paid (DDP) terms, the seller pays customs duties, VAT or GST, and brokerage fees at the point of import. When that item is returned, those payments are legally recoverable in most jurisdictions. However, only 18% of cross-border ecommerce operations consistently recover duties and taxes on returned goods [5]. The remaining 82% absorb the loss directly. For a $150 order with a 20% duty and tax rate, that is $30 per return that simply disappears [5].
Higher return shipping costs. International return shipping rarely benefits from the bulk pricing that makes outbound international freight economical. A domestic return label might cost $4 to $8. An international return shipment from the UK or Germany to the US can easily run $20 to $35 for a small package.
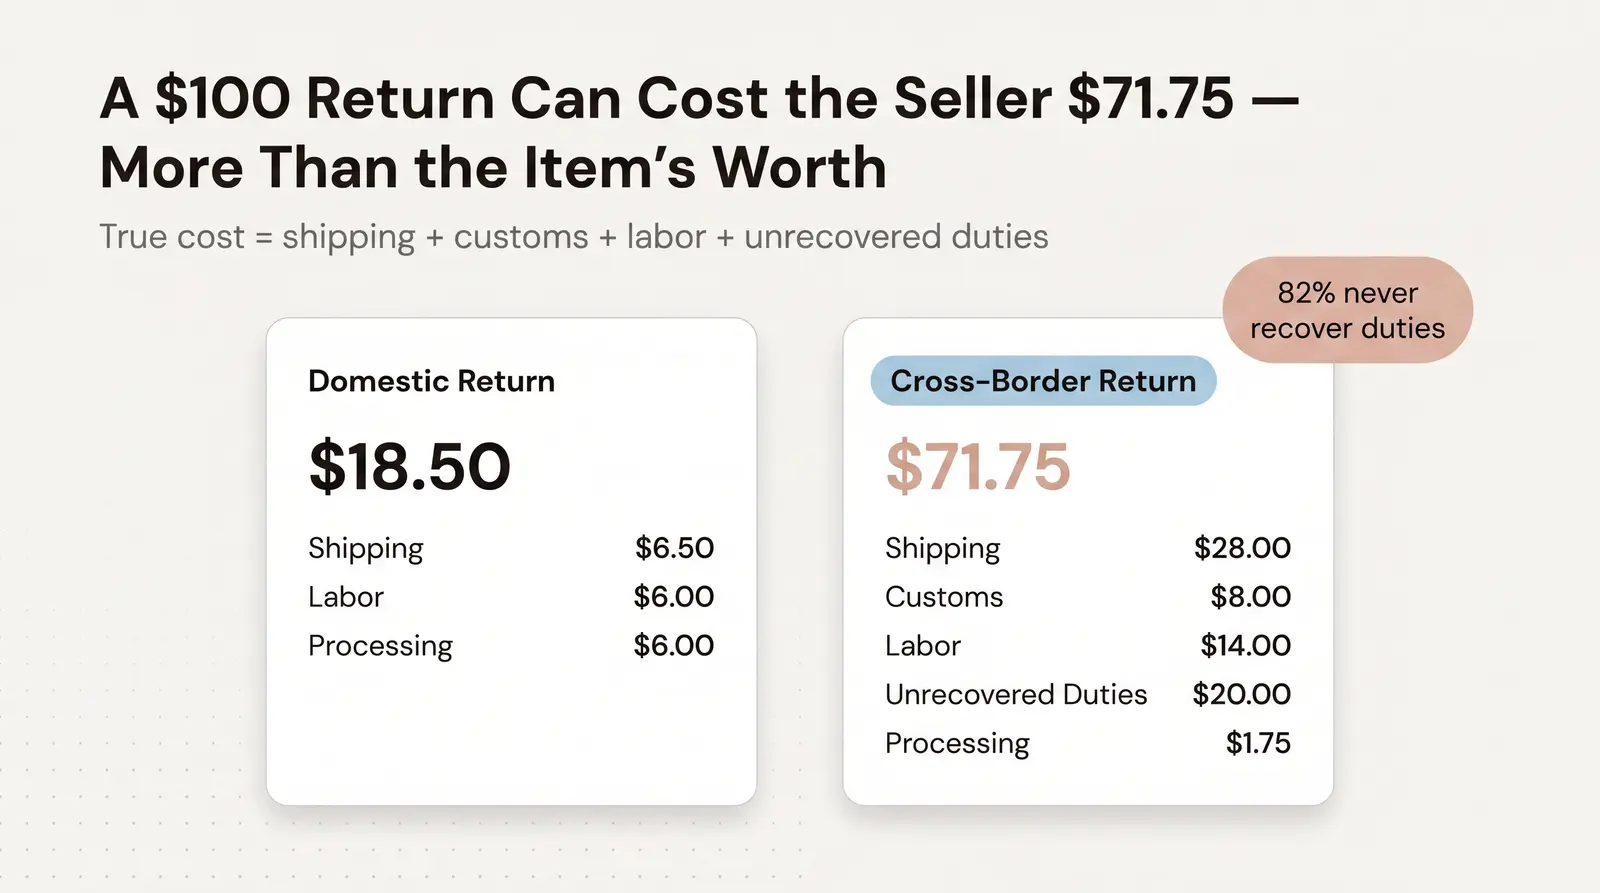
The table below illustrates the true cost of a cross-border return for a $100 jewelry item, compared to a domestic return of the same item.
| Cost Component | Domestic Return | Cross-Border Return (e.g., US to UK) |
|---|---|---|
| Return Shipping | $6.50 | $28.00 |
| Customs Clearance (Re-entry) | $0 | $8.00 |
| Receiving & Inspection | $4.25 | $5.50 |
| Restocking Labor | $3.25 | $4.00 |
| CS Labor | $2.75 | $4.50 |
| Refund Processing | $1.75 | $1.75 |
| Unrecovered Duties/VAT | $0 | $20.00 (if not claimed) |
| Total Processing Cost | $18.50 | $71.75 |
Domestic cost breakdown based on GetOrderSyncPro industry analysis [4]. Cross-border additions are estimated based on DutyPilot customs broker data [5] and industry freight benchmarks.
On a $100 item, a cross-border return can cost the seller more than the item is worth. When the item is damaged in transit, goes out of season during the weeks-long return journey, or cannot be resold at full price, the loss is total.
The financial cost of a cross-border return is steep. But the operational timeline is what actually damages a brand's reputation.
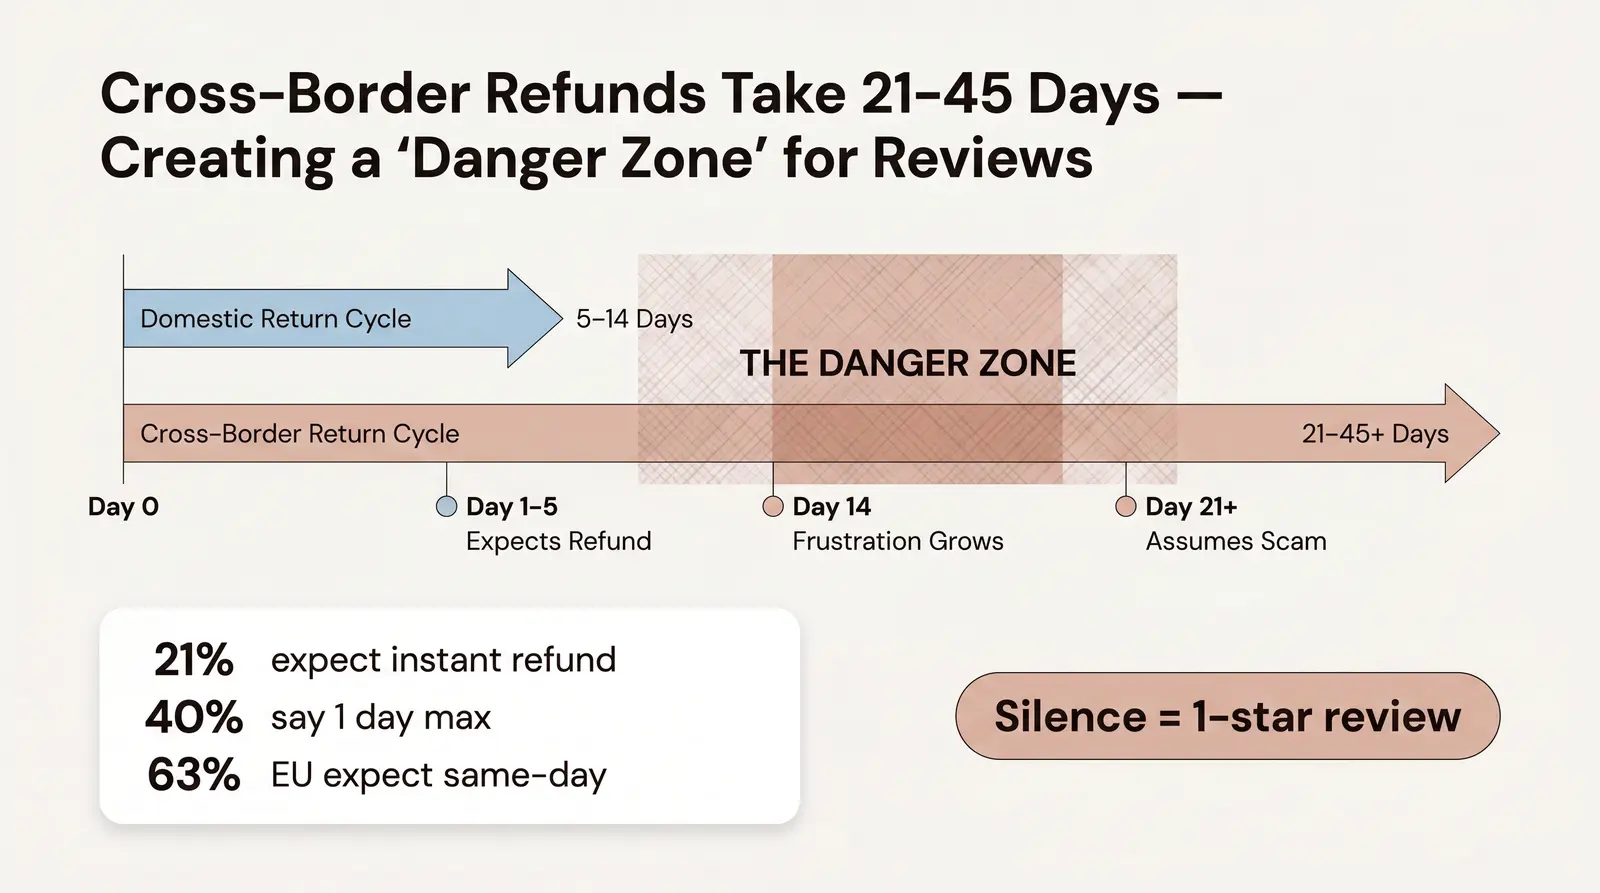
Today's consumers have been conditioned by retail giants to expect near-instant refunds. A 2024 Narvar survey found that 21% of US consumers expect a refund immediately upon initiating a return, and 40% say one day is the longest acceptable wait [6]. In Europe, 63% of consumers now expect same-day refunds [7].
This expectation collides violently with the reality of international reverse logistics.
A standard domestic return cycle moves quickly. The customer drops the package at the post office, it spends 2 to 5 days in transit, the warehouse takes 1 to 3 days to process it, and the bank takes 2 to 5 days to post the refund. Total cycle: 5 to 14 days.
A cross-border return is a different animal entirely.
| Stage | Domestic Timeline | Cross-Border Timeline |
|---|---|---|
| Customer ships item | Day 0 | Day 0 |
| Transit to warehouse | 2-5 days | 7-14 days |
| Customs clearance (re-entry) | N/A | 3-10 days |
| Warehouse processing | 1-3 days | 2-5 days |
| Refund issued | Day 1-3 after processing | Day 1-3 after processing |
| Bank posts refund | 2-5 days | 2-5 days |
| Total Cycle | 5-14 days | 21-45+ days |
Timeline estimates based on industry logistics benchmarks and customs clearance data from ShipBob, DutyPilot, and ePost Global [1] [5] [8].
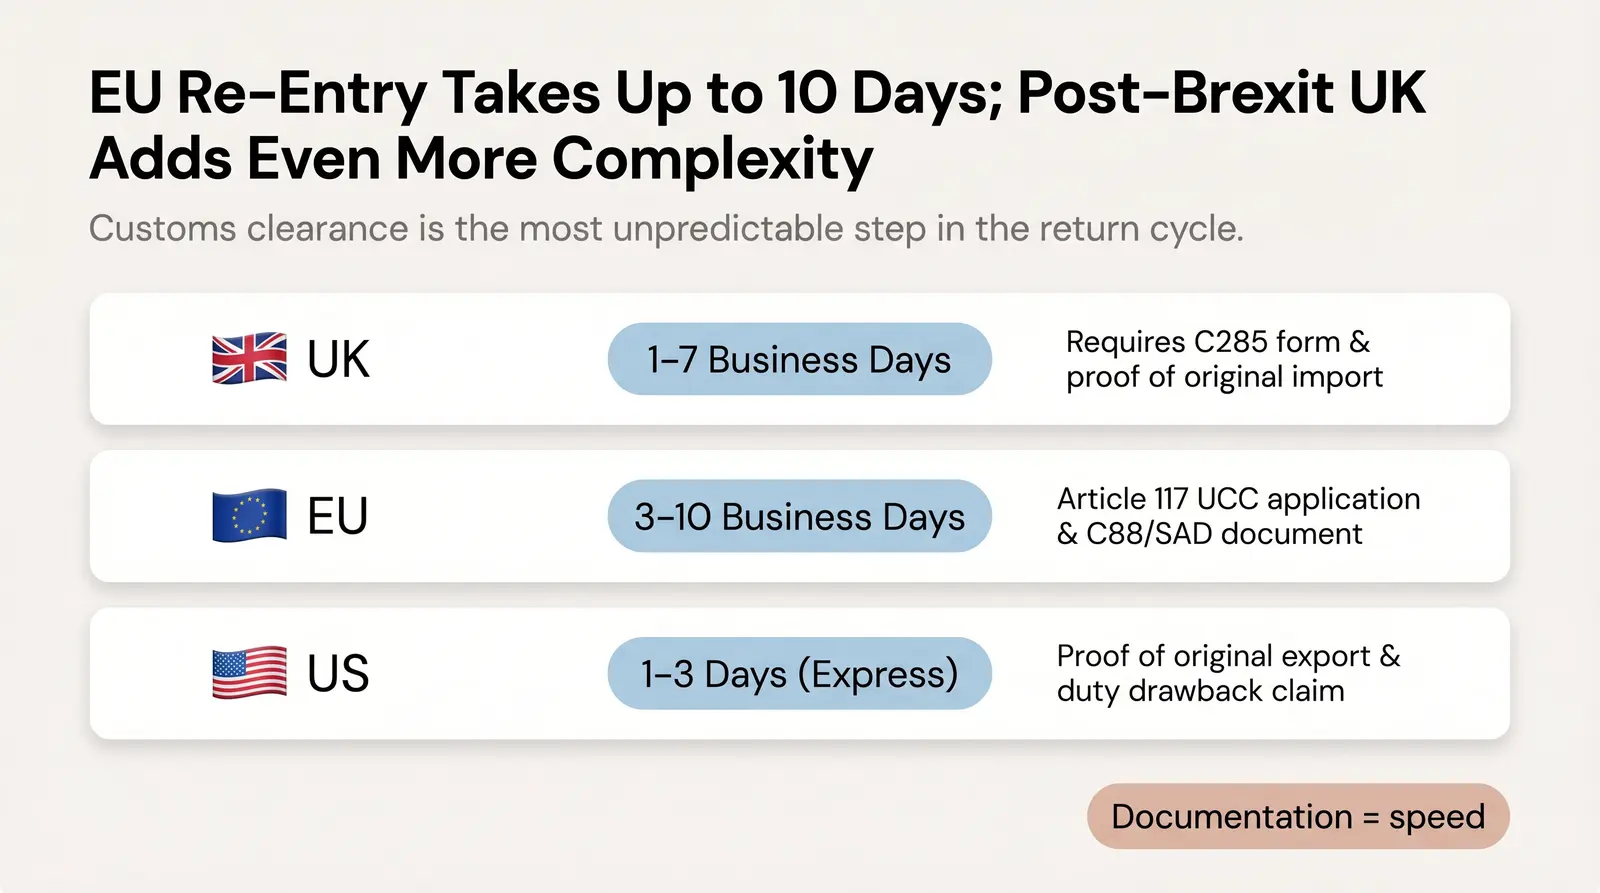
The customs clearance step is the most unpredictable. Returned goods frequently get stuck in customs queues because they require manual inspection or additional documentation to prove they are returned merchandise and not new imports. UK customs clearance for returned goods can take anywhere from a few hours to several weeks depending on documentation quality and inspection volumes [8]. EU re-entry under Article 117 of the Union Customs Code requires proof of original import and re-export, adding paperwork and processing time [5].
This timeline creates a critical friction point. The customer expects their money back by Day 5. By Day 14, they are annoyed. By Day 21, they are convinced they have been scammed.
This window, between when the customer expects the refund and when they actually receive it, is the Danger Zone. It is during this period that the vast majority of negative reviews are written.
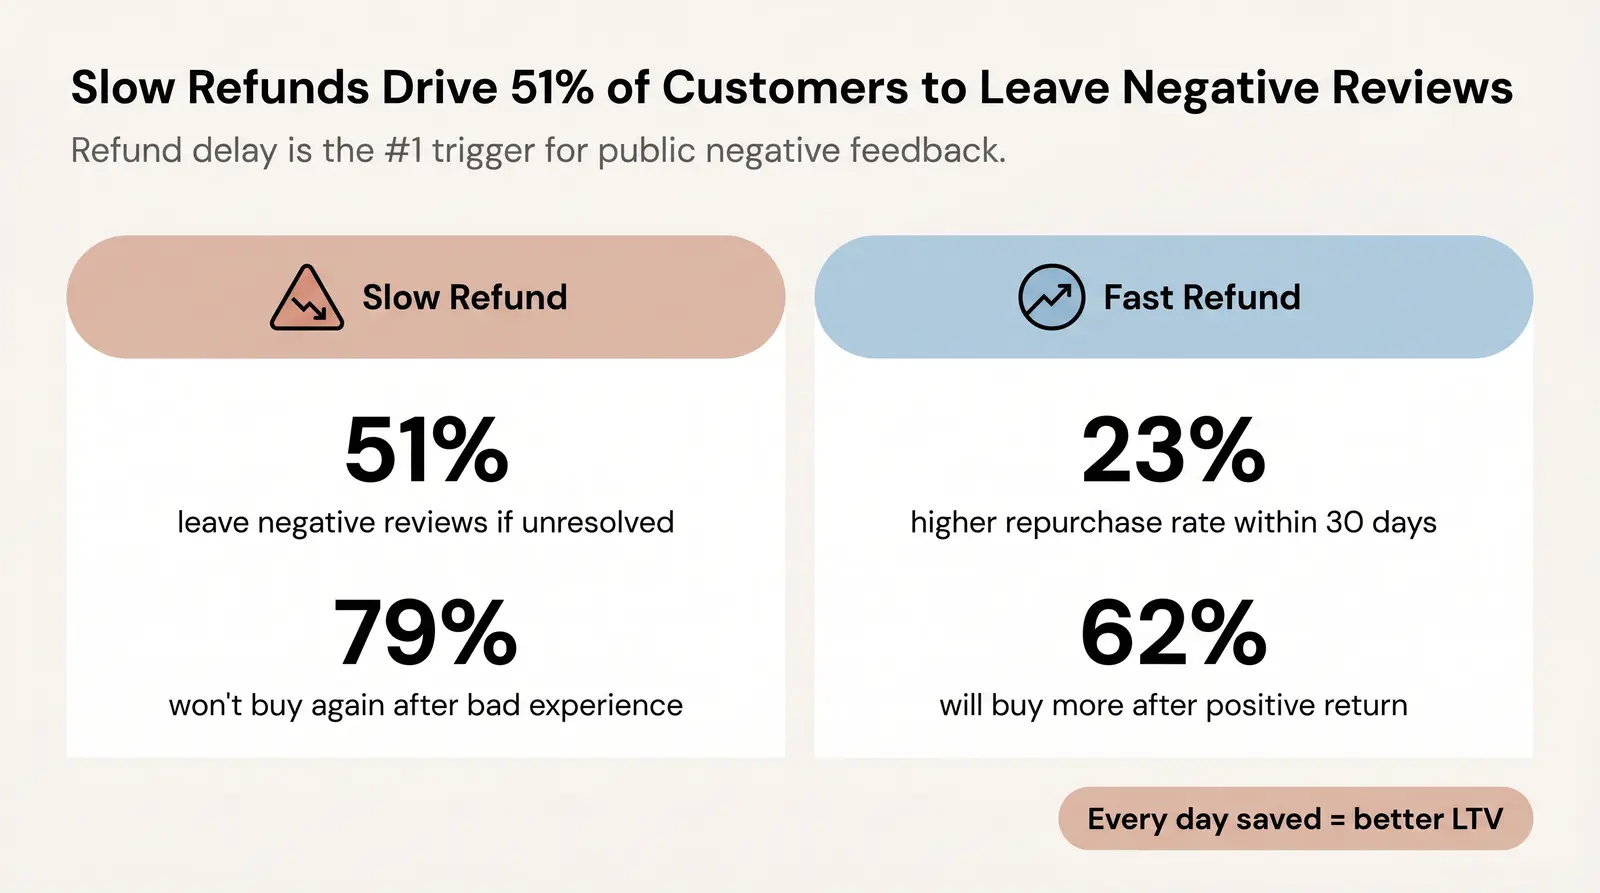
Research from Radial found that 79% of consumers will not purchase again from a brand after a poor post-purchase experience [9]. Of the online shoppers who contact customer service about shipping or delivery issues, 51% say they are likely to leave a negative review if the issue is not resolved quickly [9]. A 2023 study found that over half of UK consumers are less likely to repurchase from a merchant after a slow refund process [7].
The math is brutal. If your cross-border return rate is 25% and your refund cycle runs 30 days, a meaningful percentage of your international customers are sitting in the Danger Zone at any given moment. Each one is a potential 1-star review on Trustpilot, a chargeback dispute, or a social media complaint.
Customers who receive instant refunds, by contrast, have a 23% higher repurchase rate within the following 30 days [7]. The refund experience is not just a cost center. It is a direct driver of customer lifetime value.
Customs clearance on returned goods varies significantly by destination and by how well the original shipment was documented. The table below provides a general benchmark for customs re-entry processing times for returned ecommerce packages.
| Country | Typical Customs Clearance (Returned Goods) | Key Requirements |
|---|---|---|
| United States | 1-3 days (express); up to 15 days (standard) | Proof of original export; duty drawback claim under 19 U.S.C. § 1313(c) for duty recovery [5] |
| United Kingdom | 1-7 business days | C285 form; proof of original import and re-export; HMRC Notice 252 [5] |
| European Union | 3-10 business days | Article 117 UCC application; C88/SAD document; proof of re-export; 12-month return window [5] |
| Canada | 5-10 business days | B2 adjustment request via customs broker; proof of original import [5] |
| Australia | 1-3 days (standard); up to 2 weeks (peak periods) | ABF documentation; goods must match original export declaration [8] |
| Japan | 3-7 business days | Strict documentation requirements; items must be in original condition |
Sources: DutyPilot customs broker analysis [5]; ShipBob customs clearance guide [8].
Post-Brexit UK-EU cross-border returns are particularly complex. Items that once moved freely between the UK and the EU now require full customs documentation in both directions, adding days to the return cycle and creating new opportunities for documentation errors that trigger manual inspections.
There is no single published academic study that draws a direct regression line between refund delay duration and star rating. However, the available evidence strongly supports a causal relationship, and the mechanism is straightforward.
Customers do not write reviews when things go smoothly. They write reviews when they are frustrated or delighted. A delayed refund is a prolonged frustration, one that compounds daily as the customer checks their bank account and finds nothing.
The data points to a clear pattern:
Post-purchase experience is the primary driver of negative reviews. Radial's research found that 51% of consumers who contact customer service about a shipping or delivery issue are likely to leave a negative review if the issue is not resolved [9]. The return and refund process is the most emotionally charged part of the post-purchase experience.
Silence amplifies frustration. When customers receive no communication during a 30-day refund cycle, they assume the worst. A study by eMarketer found that 83% of consumers believe the post-purchase experience could be improved, yet only 18% of retail leaders agree [9]. This disconnect means most brands are not proactively communicating during the Danger Zone.
The timeline of frustration is predictable. Consumer research consistently shows that expectations for refund speed are set within the first 24 to 48 hours of initiating a return. Once those expectations are violated, trust deteriorates rapidly. A 2023 Tink study found that over half of UK consumers are less likely to repurchase after a slow refund, and this sentiment is expressed publicly through reviews [7].
The positive case is equally clear. Customers who experience a fast, frictionless return and refund are significantly more likely to repurchase. Signifyd's 2025 State of Commerce Report found that 62% of consumers say they will buy more from a merchant after a positive returns experience [7]. A smooth return turns a potential detractor into a loyal repeat buyer.
The operational implication is direct: every day you shave off your cross-border refund cycle is a day you keep a customer out of the Danger Zone. That translates into higher review scores, lower chargeback rates, and better customer lifetime value.
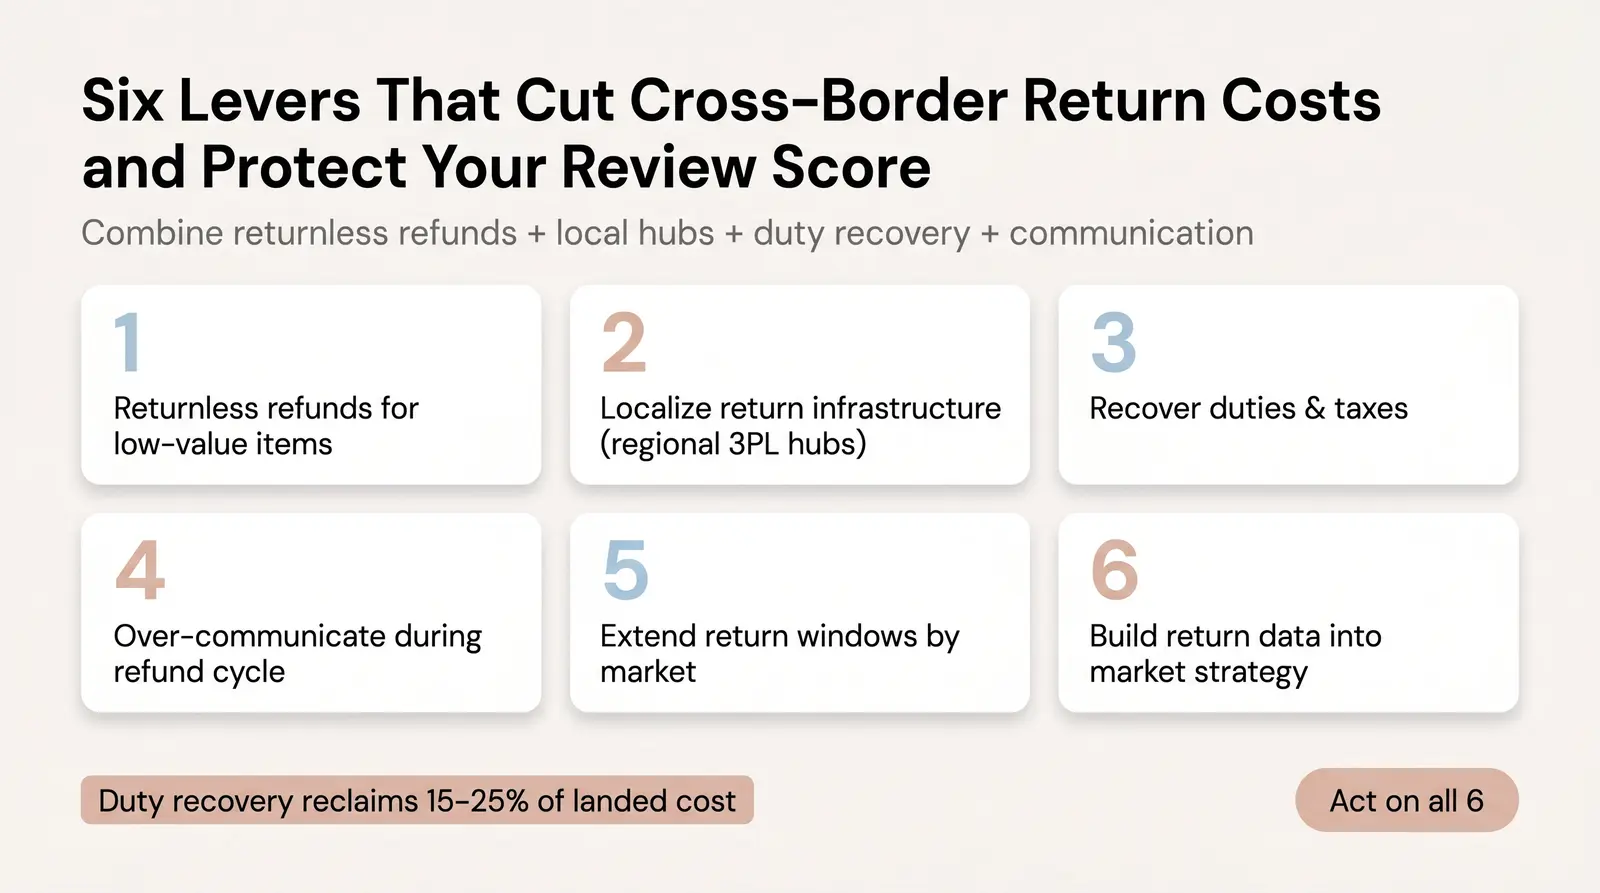
You cannot eliminate cross-border returns. But you can neutralize their impact on your margins and your reputation. Here is how high-performing brands manage the complexity.
Do the math before you ask for a return. If the cost of international return shipping, customs processing, and restocking exceeds the manufacturing cost of the item, do not ask for it back.
For jewelry and accessories brands, this calculation often tips toward the returnless refund. A $30 necklace that costs $35 to ship back internationally, clear customs, inspect, and restock is a net loss even before accounting for the time it takes. Issue an immediate refund, tell the customer to keep or donate the item, and close the loop in 24 hours.
You lose the cost of goods sold, but you eliminate the reverse logistics cost, recover the customer relationship, and prevent a negative review. For brands using a private-label fulfillment model with optimized COGS, this strategy is particularly viable because the margin structure supports it.
Never force an international customer to ship a return back to your home country. It is too expensive, takes too long, and the customs documentation requirements are a minefield.
Instead, partner with a 3PL that operates regional return hubs. A customer in the UK should mail their return to a facility in the UK. That local facility inspects the item, issues the refund immediately (closing the Danger Zone window), and then consolidates returns onto a single freight pallet to be shipped back to your main warehouse once a month. This approach dramatically reduces per-item shipping costs, simplifies customs clearance, and compresses the refund cycle from 30+ days to 5 to 7 days.
Brands like ASOS and Zalando use regional return centers across Europe and North America to keep costs low and inventory moving. For smaller brands, partnering with a 3PL that already has this infrastructure in place is the fastest path to the same capability.
If you are shipping Delivered Duty Paid (DDP), you are legally entitled to recover the duties and taxes paid on returned goods in most jurisdictions. Most brands never claim this money.
In the US, file for duty drawback under 19 U.S.C. § 1313(c). In the EU, apply for repayment under Article 117 of the Union Customs Code. In the UK, complete a C285 form with HMRC. In Canada, file a B2 adjustment request through your customs broker.
For high-volume sellers into Europe, registering for the Import One Stop Shop (IOSS) simplifies VAT collection on outbound orders and makes VAT recovery on returns significantly more straightforward [5]. Work with a customs broker who specializes in duty drawback. The recovery rate on eligible returns can reclaim 15% to 25% of the original landed cost, which on a high-volume operation adds up to real money.
If your cross-border return cycle takes 25 days, tell the customer it will take 25 days before they initiate the return. Set clear expectations upfront, and then communicate at every milestone.
A simple automated sequence works: confirmation when the return is initiated, notification when the package clears customs, notification when it arrives at the warehouse, and confirmation when the refund is issued. Customers who are informed do not write negative reviews. Customers who are left in silence do.
This is the cheapest and fastest lever available to any brand. It costs nothing to send an email, and it can prevent the review that costs you a customer for life.
A 14-day return window is legally sufficient in the EU, but it is operationally inadequate for cross-border orders. By the time a customer in Germany receives an order from a US-based brand, tests it, and decides to return it, they may already be approaching the 14-day window. When they miss it, they file a chargeback instead.
Extend your return window to at least 30 days for cross-border orders, and consider 60 days for markets with long transit times. A longer return window reduces chargebacks, reduces customer service contacts, and signals confidence in your product. The incremental return volume from extending the window is typically smaller than the chargeback reduction [5].
Not all markets are worth the same margin after returns are factored in. Before you expand into a new country, model the expected return rate, the refund cycle cost, and the duty recovery rate into your unit economics.
A market with a 30% return rate and a 45-day refund cycle may still be profitable if your AOV is high, your COGS are low, and you have localized return infrastructure in place. A market with a 15% return rate may be unprofitable if your return shipping costs are high and you are not recovering duties. The ecommerce and boutique store owner who builds this model before entering a market avoids the painful lesson of discovering it after six months of losses.
Q: What is a typical cross-border ecommerce return rate?
A: Cross-border return rates average around 25% across categories, according to IMRG data [2]. However, this varies significantly by country and product type. Germany sees apparel return rates of approximately 50%, while Japan sits at around 8%. The global average for online retail overall is 20% to 30%, compared to 8% to 10% for brick-and-mortar [1].
Q: How long does a cross-border refund typically take?
A: A domestic refund cycle typically takes 5 to 14 days from the time the customer ships the item. A cross-border refund cycle routinely takes 21 to 45 days or longer, depending on international transit time, customs clearance at re-entry (which can add 3 to 10 business days), warehouse processing, and bank posting. The customs clearance step is the most variable and the most likely to cause unexpected delays.
Q: Why do international orders have higher return rates than domestic orders?
A: Several structural factors drive higher cross-border return rates. Sizing standards differ between markets, so fit-related returns are more common. Product descriptions that work well in one market may not translate accurately to another. Surprise customs charges on delivery cause some customers to reject packages outright. And the general uncertainty of buying from a foreign retailer means customers are more likely to order multiple options and return what doesn't work.
Q: Can I recover the duties and taxes I paid on a returned international order?
A: Yes, in most major markets. In the US, you can file for duty drawback under 19 U.S.C. § 1313(c). In the EU, you can apply for repayment under Article 117 of the Union Customs Code. In the UK, you file a C285 form with HMRC. In Canada, you file a B2 adjustment request. The process requires documentation proving the original import and the re-export, and it is typically handled by a customs broker. Despite this, only 18% of cross-border sellers consistently recover these costs [5].
Q: How does a delayed refund affect my review score?
A: The relationship is well-documented. Research shows that 51% of customers who contact customer service about a shipping or delivery issue are likely to leave a negative review if it is not resolved quickly [9]. A 2023 study found that over half of UK consumers are less likely to repurchase after a slow refund [7]. The refund cycle is the most emotionally charged part of the post-purchase experience, and customers who are left waiting without communication are the most likely to express their frustration publicly.
Q: What is a returnless refund and when does it make sense?
A: A returnless refund is when the seller issues a full refund without requiring the customer to ship the item back. It makes financial sense when the cost of processing the return (shipping, customs, inspection, restocking) exceeds the resale value of the item. For low-cost accessories and jewelry, this threshold is reached quickly on international returns. Issuing an immediate returnless refund eliminates the reverse logistics cost, closes the Danger Zone window, and converts a frustrated customer into a loyal one.
Q: What is the cheapest way to manage cross-border returns?
A: The most cost-effective approach combines three strategies. First, use localized return hubs (through a 3PL partner) so customers ship to a local address rather than back to your home country. This dramatically reduces per-item shipping costs. Second, implement returnless refunds for items where the return cost exceeds the resale value. Third, automate duty drawback and tax recovery so you are not leaving 15% to 25% of your landed cost on the table for every eligible return.
[1] ePost Global. "International returns surge as e-commerce merchants face rising logistics hurdles." Yahoo Finance, March 2026. https://finance.yahoo.com/news/international-returns-surge-e-commerce-150000716.html
[2] ReversoLogix. "The Hidden Cost of Cross-Border Returns on E-commerce Profitability." May 2025. https://www.reverselogix.com/industry-updates/the-hidden-cost-of-cross-border-returns-on-e-commerce-profitability/
[3] Prime AI. "Industry Benchmarks for Clothing Return Rates by Product Category and Country." January 2025. https://www.prime-ai.com/en/media/clothing-return-rates-by-category-and-country-csf-a/
[4] GetOrderSyncPro. "The Hidden Cost of Returns Processing for E-commerce." https://getordersyncpro.com/blogs/cost-of-returns-processing
[5] DutyPilot. "Cross-Border Returns and Refunds: Mastering Tax Recovery (2024 Guide)." April 2026. https://dutypilot.org/blog/cross-border-returns-refunds-tax-implications
[6] eMarketer. "Half of Consumers Making Returns Expect Refunds Within 24 Hours." September 2024. https://www.emarketer.com/content/half-consumers-making-returns-expect-refunds
[7] Signifyd. "Instant Refunds: The Key to Increasing Customer Lifetime Value." April 2025. https://www.signifyd.com/blog/instant-refunds-increase-customer-lifetime-value/
[8] ShipBob. "Why Your Packages Get Stuck in Customs and How to Get Them Back." September 2025. https://www.shipbob.com/au/blog/package-stuck-in-customs/
[9] Radial. "Nearly 80% of Consumers Won't Buy Again After a Bad Post-Purchase Experience." https://www.radial.com/insights/nearly-80-percent-of-consumers-wont-buy-again-after-a-bad-post-purchase-experience