TikTok Shop statistics for 2026 reveal $112B projected GMV, top-performing categories, country-level breakdowns, seller distribution data, and conversion benchmarks for ecommerce sellers.
Published:
April 27, 2026
Author:
Yi Cui
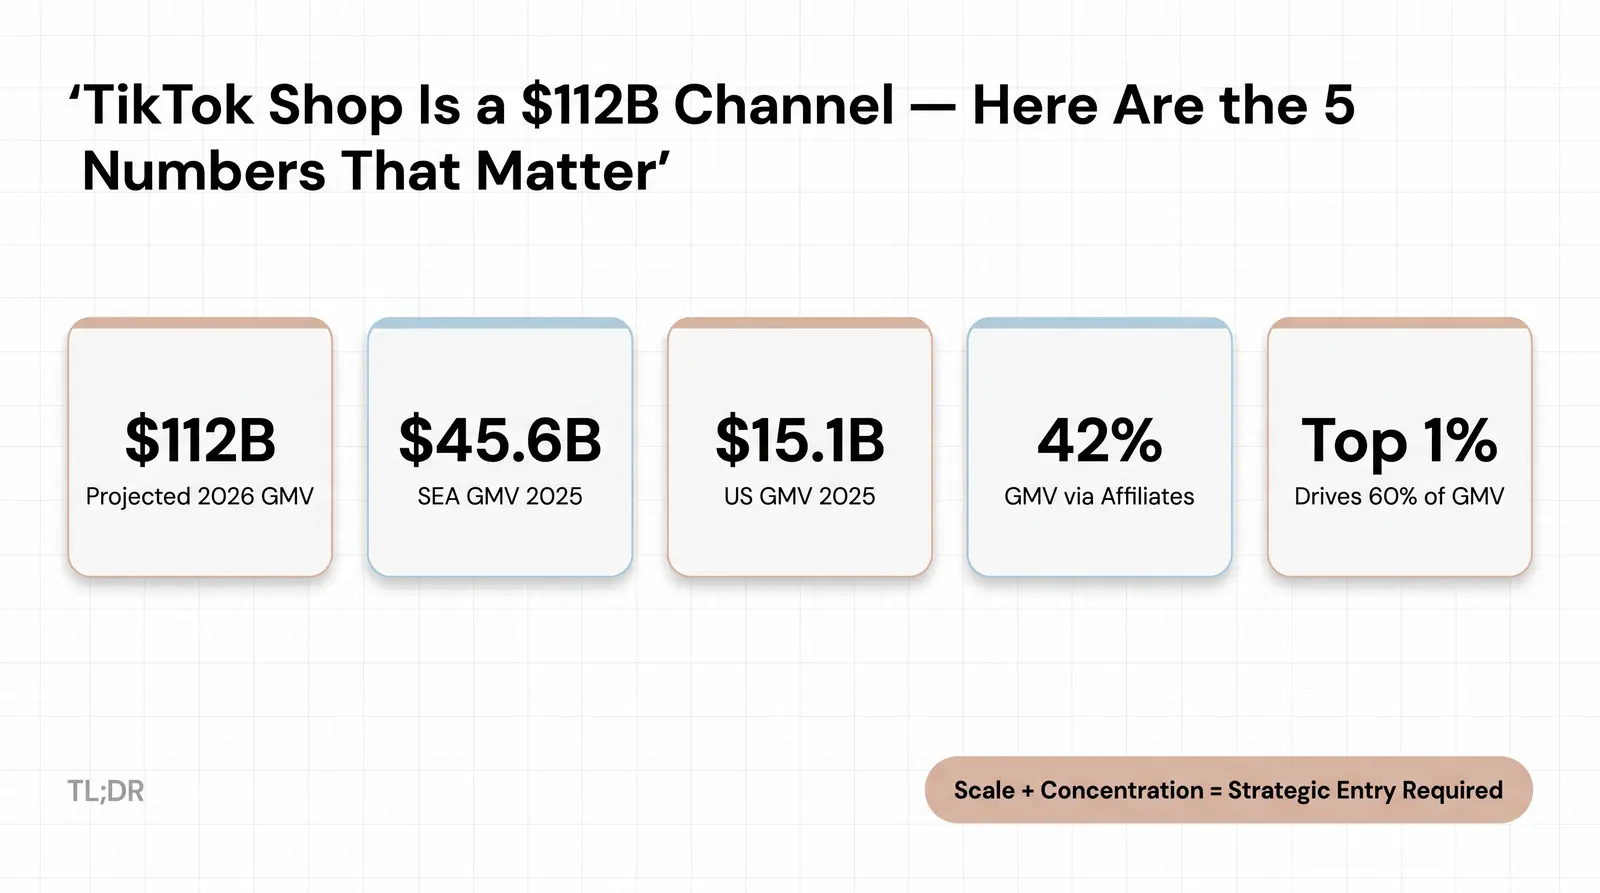
TikTok Shop is no longer just a social commerce experiment. The useful question in 2026 is not whether it is growing, but where the GMV is concentrated, which countries and categories are winning, and what the numbers mean for sellers choosing a channel.
This comprehensive guide breaks down the critical data defining TikTok Shop's scale and performance in 2026. Designed for sellers, brand operators, and ecommerce entrepreneurs evaluating the platform, it provides a data-driven look at gross merchandise value (GMV), seller demographics, category performance, and conversion benchmarks.
| Metric | Value | Source / Year |
|---|---|---|
| Global GMV (2024 actual) | ~$33.2 billion | Momentum Works / Tabcut (2024) [7] |
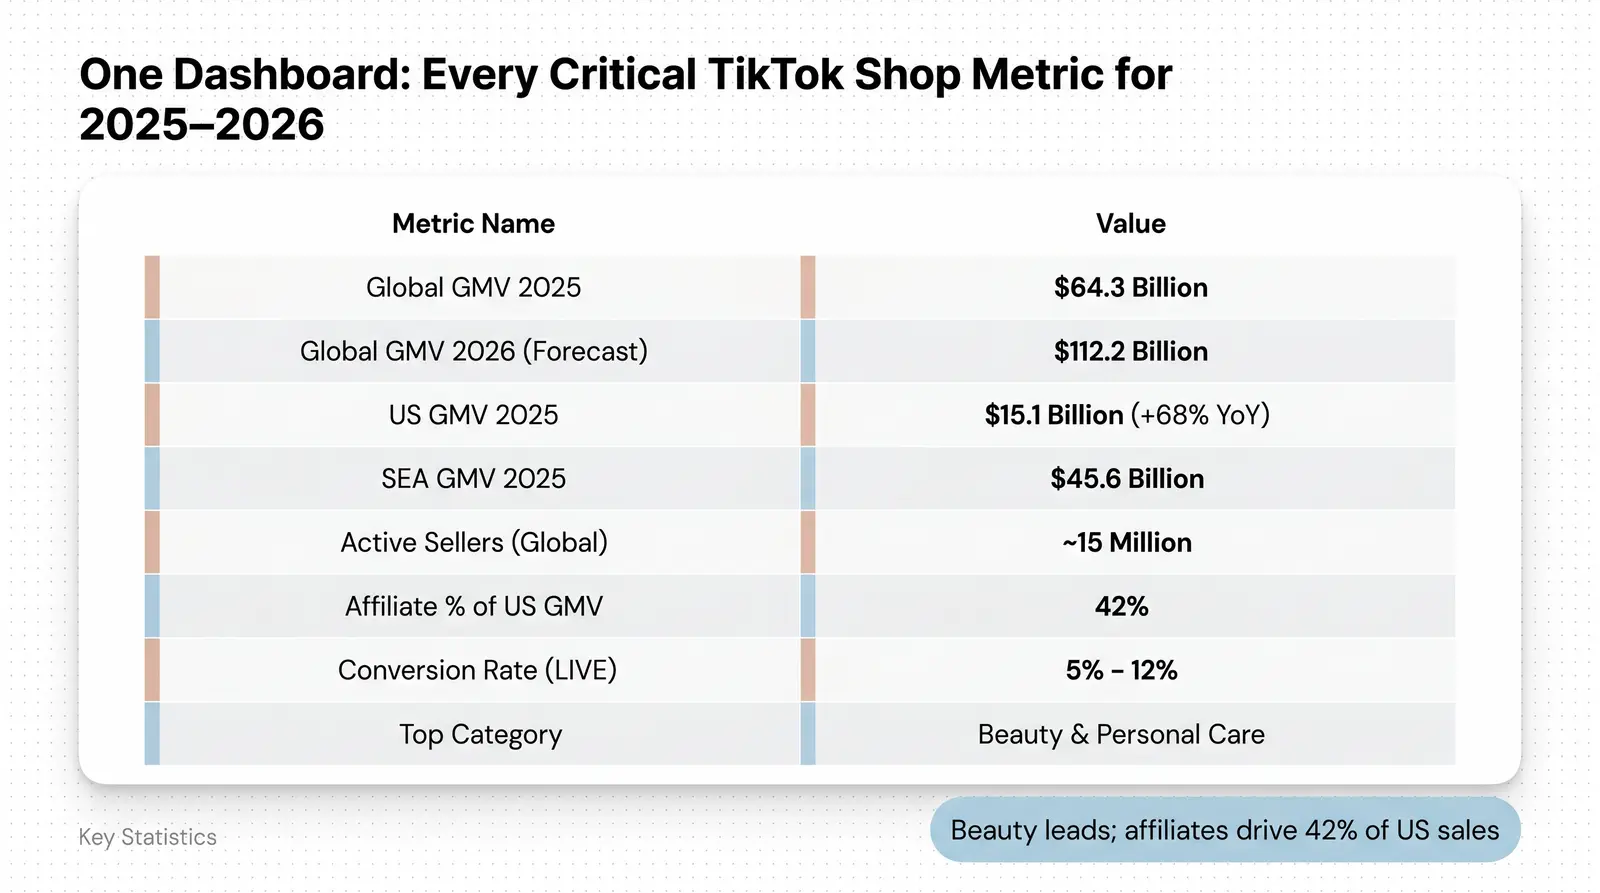
| Global GMV (2025 estimate) | $64.3 billion | Momentum Works / Tabcut (2025) [4] |
| Global GMV (2026 forecast) | $112.2 billion | Ringly.io / Industry Estimates (2026) [2] |
| US GMV (2024) | ~$9.0 billion | Momentum Works (2024) [7] |
| US GMV (2025 estimate) | $15.1 billion | Momentum Works / Tabcut (2025) [4] |
| Southeast Asia GMV (2025) | $45.6 billion | Momentum Works (2025) [3] |
| Indonesia GMV (2025) | $13.1 billion | Momentum Works (2025) [3] |
| Malaysia GMV (2025) | ~$5.0 billion | Momentum Works (2025) [8] |
| Thailand GMV (2025) | $10–12 billion | Digital in Asia (2025) [8] |
| UK GMV (2024) | $603.35 million | AfterShip (2024) [9] |
| Global active sellers | ~15 million | Industry Estimates (2025) [10] |
| US active sellers | 475,000 (registered) / 216,000 (active) | Red Stag Fulfillment (2025) [10] |
| Indonesia active sellers | 54,280 | AfterShip (2024) [9] |
| Top GMV category (#1) | Beauty & Personal Care | Momentum Works / Tabcut (2025) [4] |
| Top GMV category (#2) | Womenswear & Underwear | Momentum Works / Tabcut (2025) [4] |
| Global average order value (AOV) | Varies widely by region ($5 to $59) | Red Stag Fulfillment (2025) [11] |
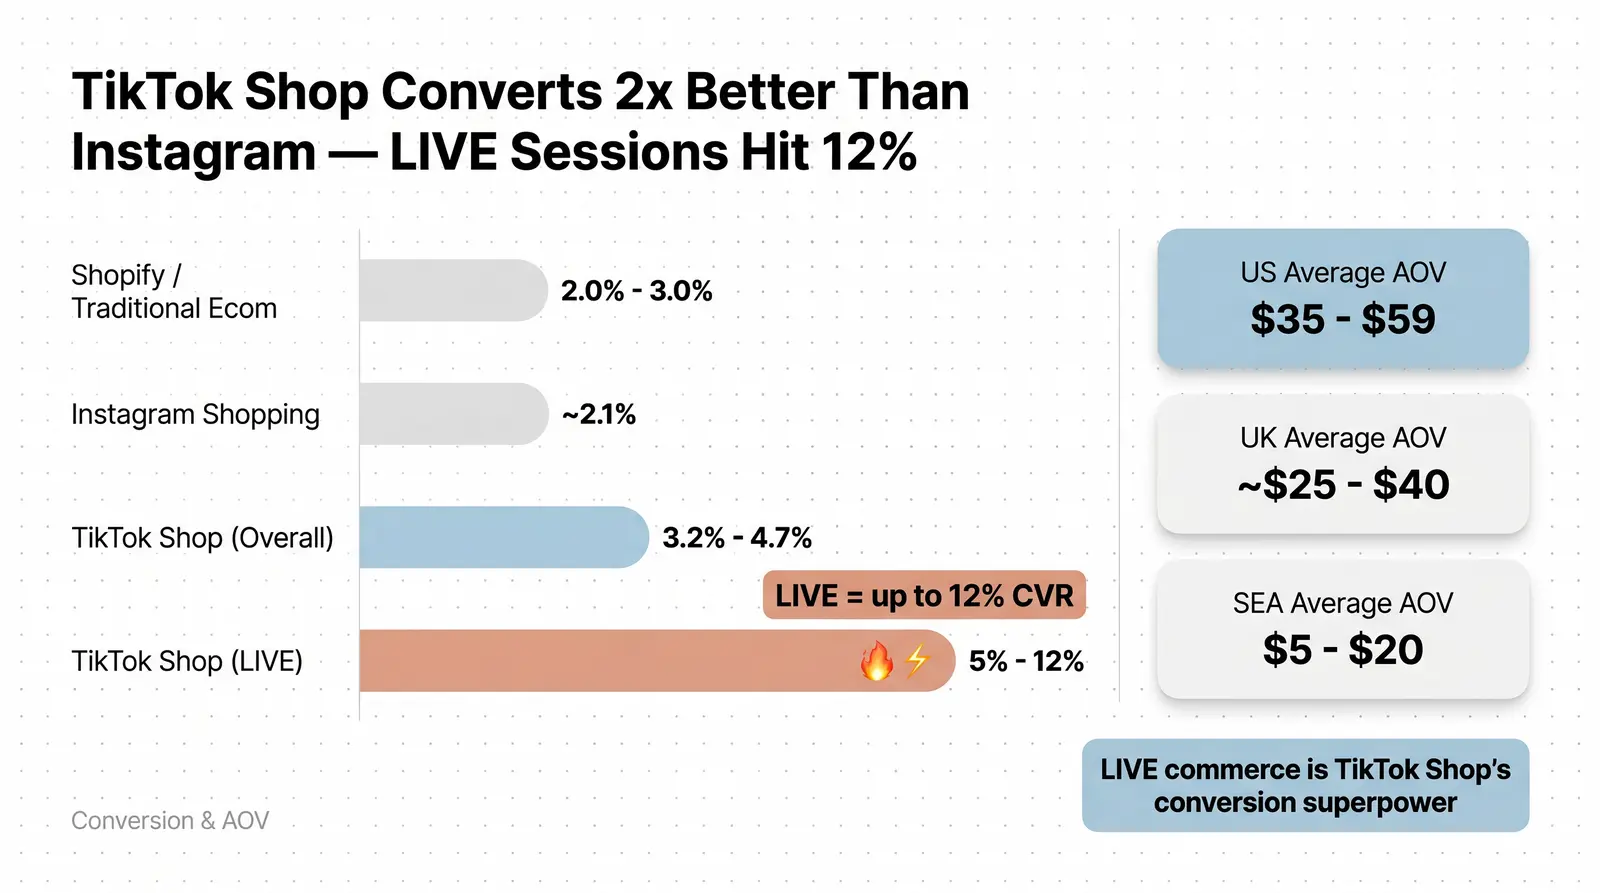
| US average order value (AOV) | $35 - $59 | Red Stag Fulfillment (2025) [11] |
| TikTok Shop conversion rate | 3.2% - 5% (higher for LIVE) | MomentIQ / Dashboardly (2026) [12] [13] |
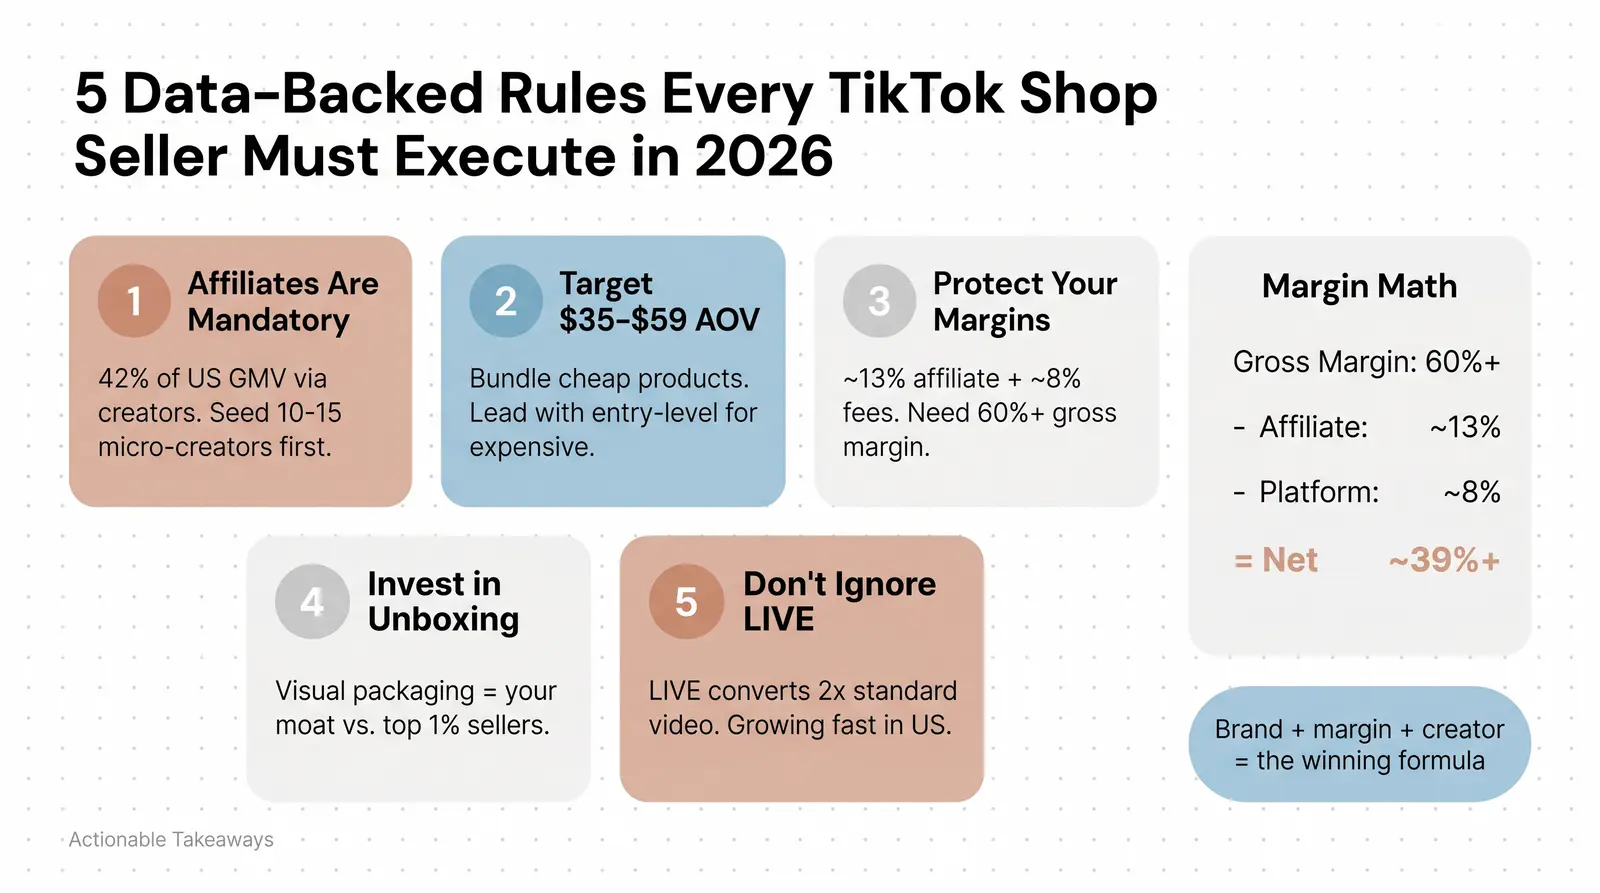
| Affiliate/creator % of GMV | 42% (US market) | Hamster Garage (2026) [6] |
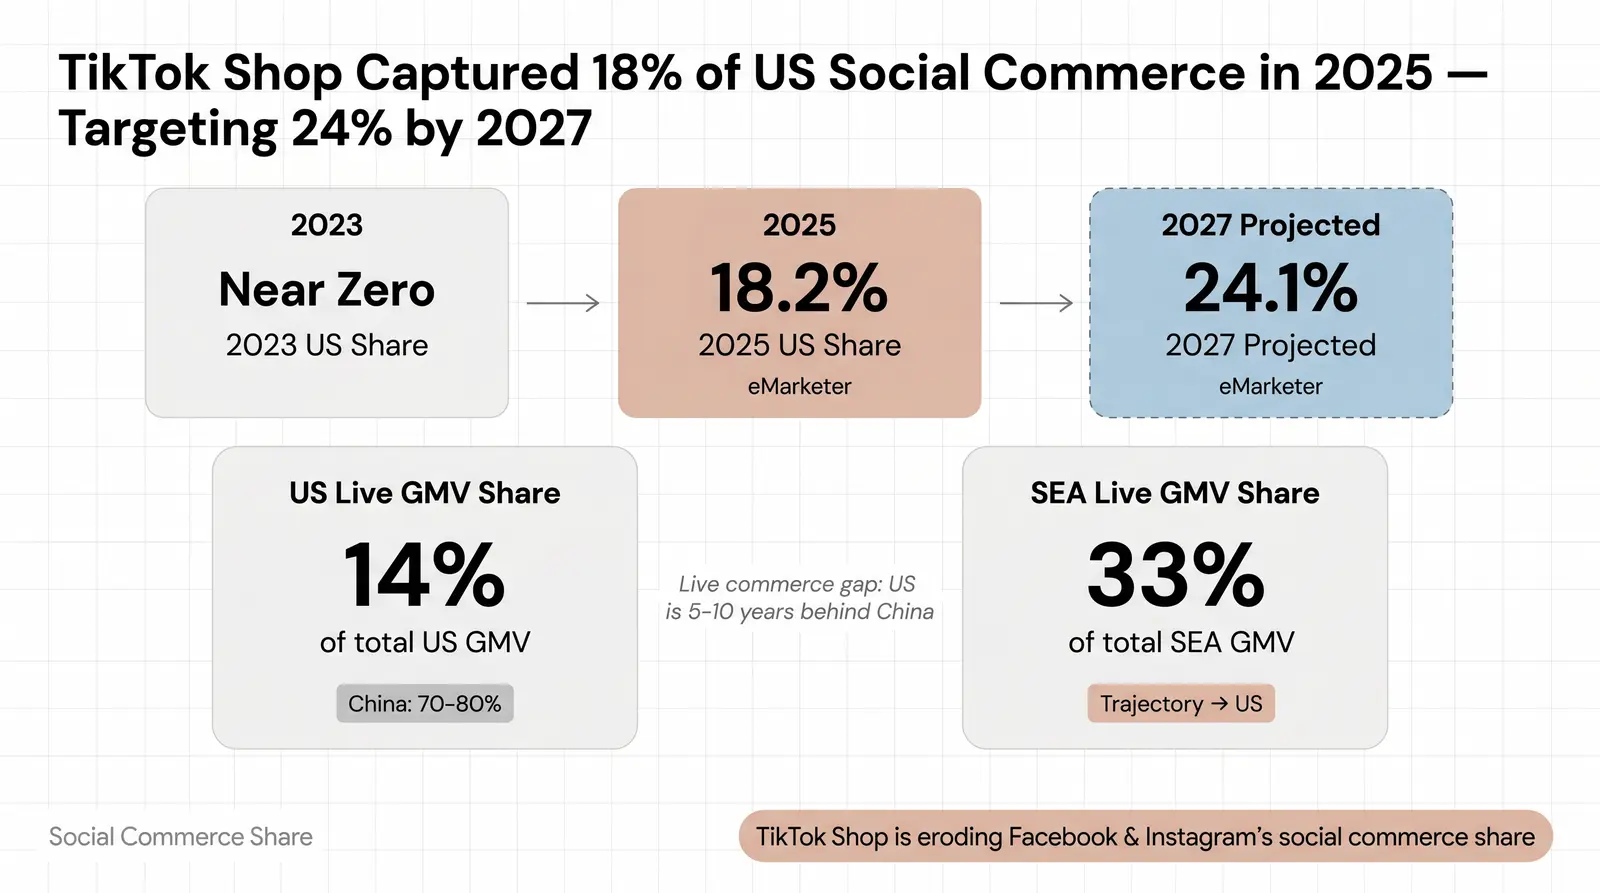
| Live-stream % of GMV | 14% (US) / 33% (SEA) | Momentum Works / Tabcut (2025) [4] |
| TikTok Shop % of global social commerce | 18.2% (US market) | eMarketer (2025) [14] |
Source/Methodology Note: Figures are compiled from leading industry trackers including Momentum Works, Tabcut, eMarketer, and AfterShip. Because TikTok does not publicly report all financial metrics, GMV figures represent gross transaction value estimates (before returns/cancellations) across the stated calendar years.
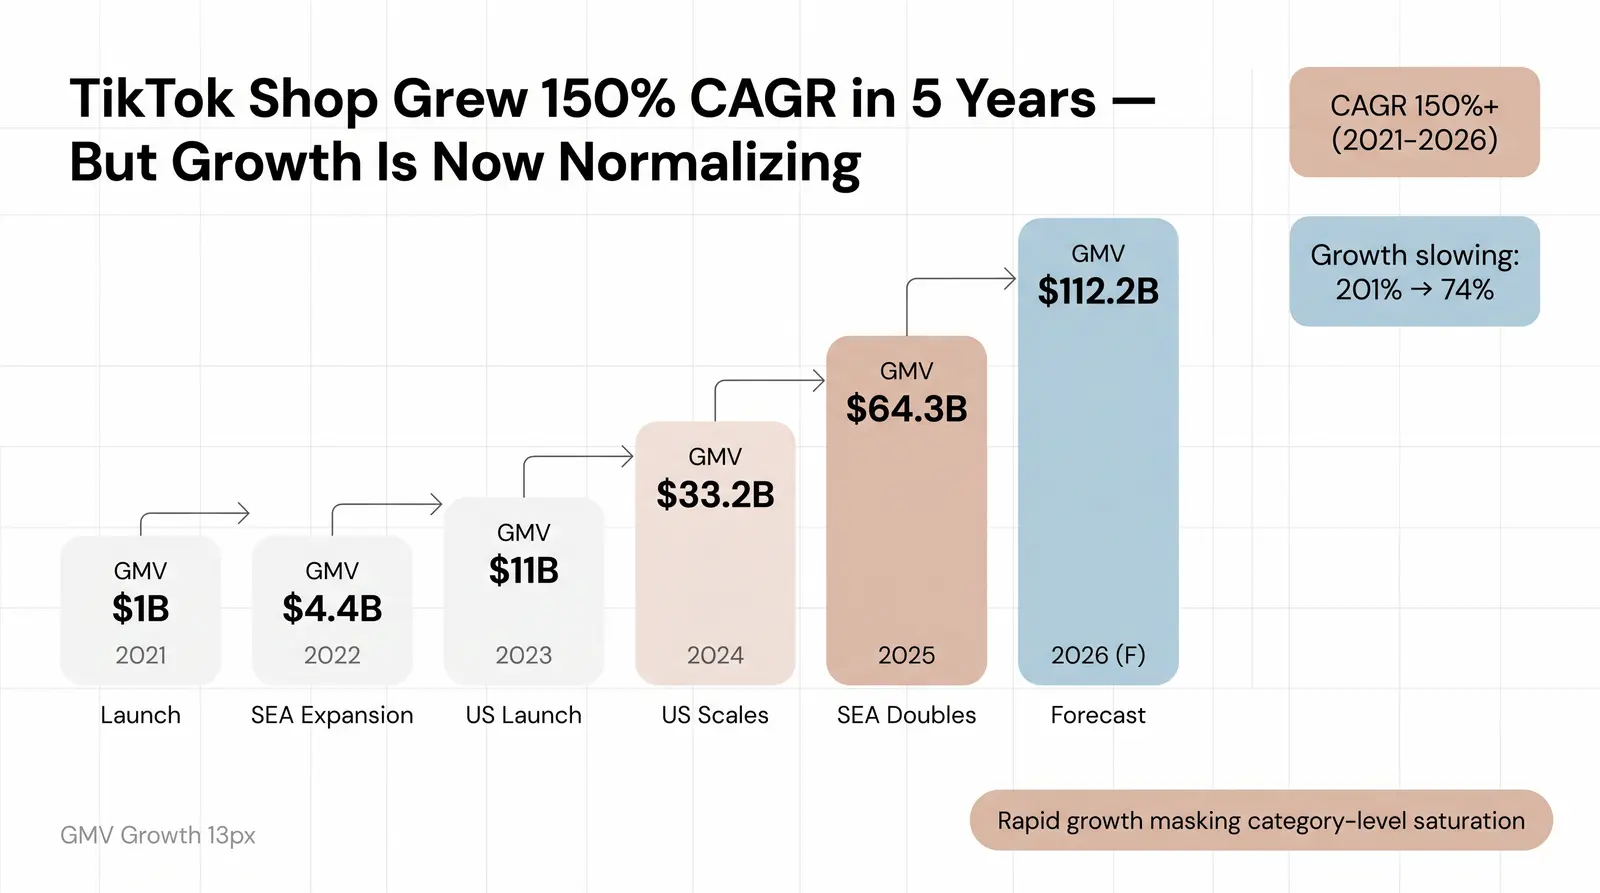
TikTok Shop's trajectory from a novel feature to a dominant ecommerce force has been exceptionally rapid.
| Year | Global GMV | YoY Growth | Key Milestone |
|---|---|---|---|
| 2021 | ~$1 billion | — | Initial platform launch |
| 2022 | ~$4.4 billion | 340% | Southeast Asia expansion |
| 2023 | ~$11 billion | 150% | US market soft launch |
| 2024 | ~$33.2 billion | 201% | US market reaches scale |
| 2025 (est) | $64.3 billion | 94% | SEA doubles, US matures |
| 2026 (forecast) | $112.2 billion | 74% | Projected continued expansion |
This represents a staggering Compound Annual Growth Rate (CAGR) of over 150% from 2021 to 2026. However, raw GMV growth can sometimes obscure the reality for individual sellers. At Branvas, we track GMV growth not just as a headline number but as a signal of category maturity — fast-growing markets often mean higher competition for undifferentiated products, while slowing growth in a category can signal it's stabilizing into a sustainable channel.
Furthermore, platform-subsidized discounts heavily inflated early GMV numbers in markets like the US. As TikTok reduces these subsidies and raises commission rates (averaging around 8% in the US by mid-2024), the focus is shifting from pure volume acquisition to profitable unit economics.
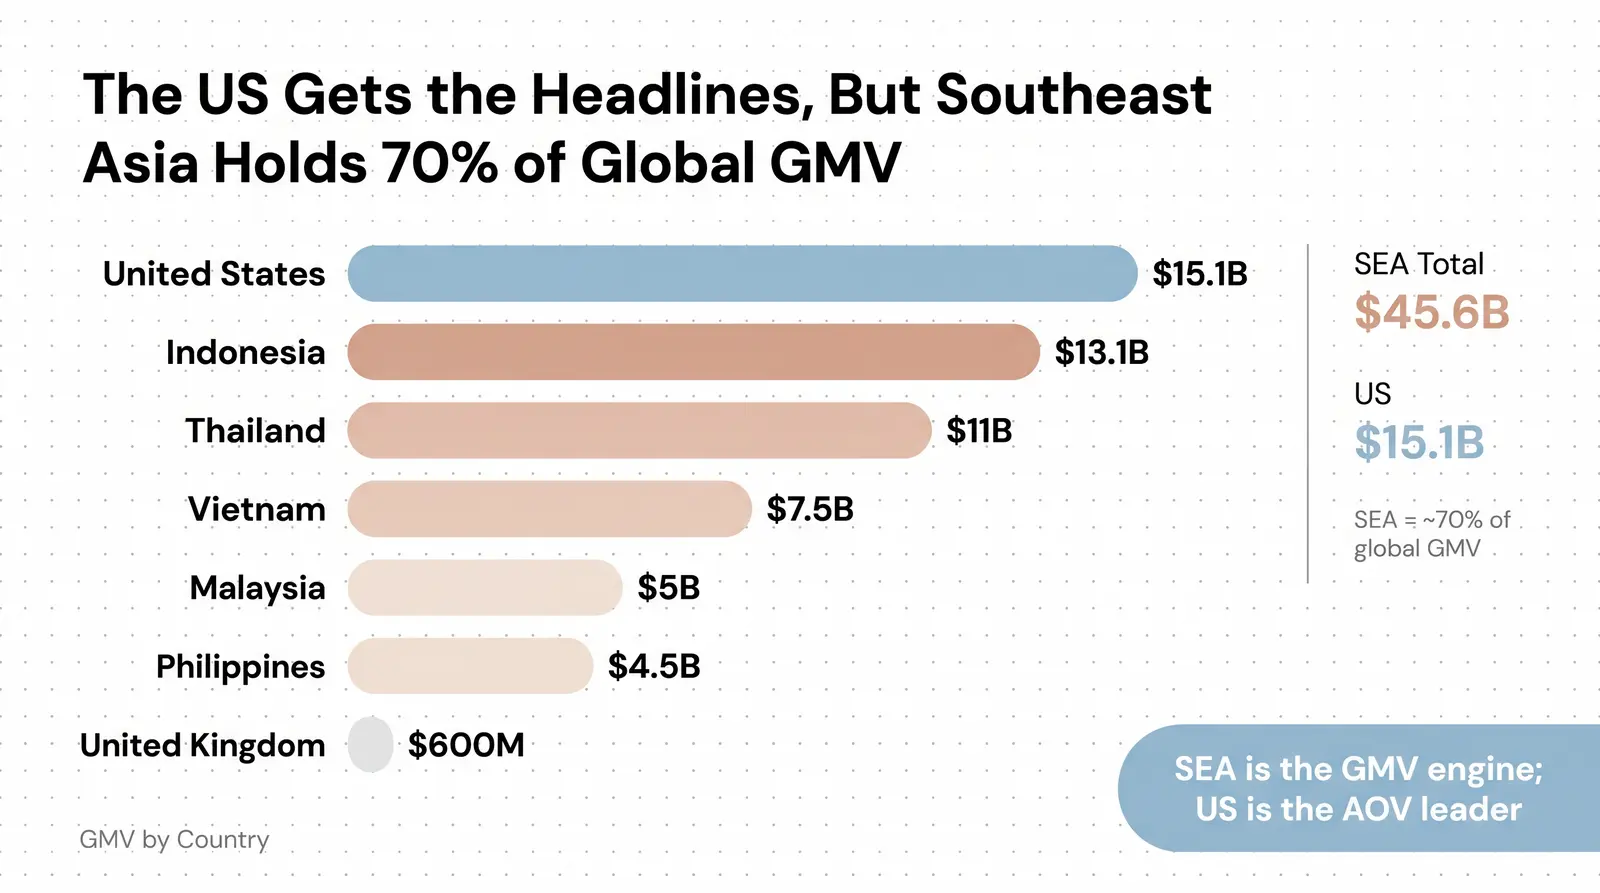
While the US market garners the most media attention, Southeast Asia remains the foundational pillar of TikTok Shop's global operations.
| Country | 2024/2025 GMV Estimate | % of Global GMV (Approx) | Seller Opportunity Note |
|---|---|---|---|
| Indonesia | $13.1B (2025) | ~20% | Largest single market; integrated with Tokopedia; high volume, low AOV. |
| United States | $15.1B (2025) | ~23% | Highest growth market; higher AOV; discovery-led affiliate model dominates. |
| Thailand | $10-12B (2025) | ~17% | Highly mature live commerce market; strong conversion rates. |
| Vietnam | $7-8B (2025) | ~11% | Rapidly growing middle class; strong appetite for beauty and fashion. |
| Malaysia | ~$5B (2025) | ~8% | High seller density relative to population; strong social commerce adoption. |
| Philippines | $4-5B (2025) | ~7% | High mobile penetration; price-sensitive but high-frequency purchasing. |
| United Kingdom | ~$600M (2024) | ~1% | Slower adoption compared to US/SEA; strong focus on established beauty brands. |
Source/Methodology Note: Figures are drawn primarily from Momentum Works' 2025 reporting and Digital in Asia's Southeast Asia analysis. Percentages are approximate based on the $64.3B global total for 2025.
The dynamic between the US and Southeast Asia (SEA) is structural. SEA functions as the established GMV base, where TikTok Shop operates almost as a utility, deeply integrated into daily shopping habits (aided by the Tokopedia acquisition in Indonesia). The US, conversely, is the high-growth, high-AOV market where the affiliate creator model drives discovery.
A non-obvious insight: Malaysia exhibits an outsized seller density relative to its GMV. Despite generating less than half the GMV of Indonesia, it boasts a highly active seller base, indicating intense competition for a smaller overall pie.
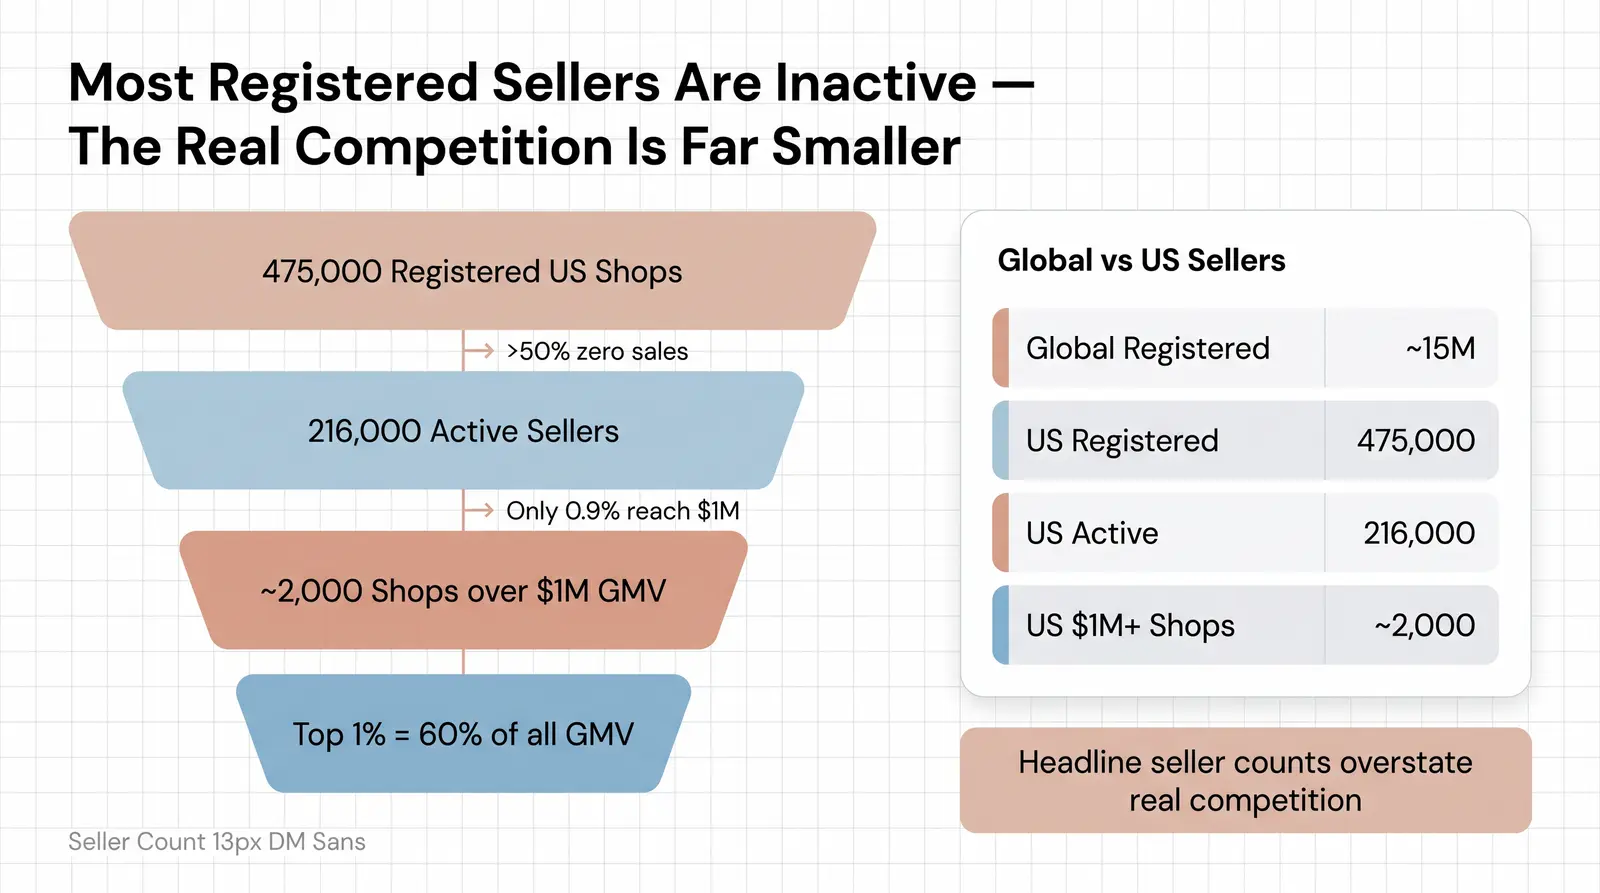
The supply side of TikTok Shop has exploded, but headline numbers often conflate registered accounts with active, revenue-generating businesses.
| Region / Country | Total Registered Shops | Active/Meaningful Sellers |
|---|---|---|
| Global | ~15 Million (2025) | Unknown |
| United States | 475,000 (mid-2025) | 216,000 active (Dec 2024) |
| Indonesia | 54,280 (2024) | — |
| Thailand | 48,370 (2024) | — |
| Vietnam | 46,380 (2024) | — |
| Malaysia | 34,230 (2024) | — |
| United Kingdom | 200,000 (late 2024) | — |
Note: US and Global figures from Red Stag Fulfillment (2025) [10]; SEA figures from AfterShip (2024) [9].
The distinction between registered and active sellers is critical. For example, while the US boasts over 475,000 registered shops, data from 2025 indicates that more than half of these stores recorded zero sales [4].
If TikTok Shop US has approximately 475,000 registered sellers but industry estimates suggest only a fraction generate meaningful GMV, the real competitive set for a new entrant is a meaningfully smaller number than headlines suggest. In fact, only about 2,000 stores in the US exceeded $1 million in GMV in 2025 [4].
We often see founders at Branvas assume TikTok Shop is impossibly crowded — the seller count headline is misleading because GMV is highly concentrated. The real question is whether your category and price point sit in a defensible niche.
TikTok Shop's algorithmic feed favors products that are highly visual, easily demonstrable, and priced for impulse purchasing.
| Category | US GMV Share (Est) | Typical AOV | Competition | Seller Fit Note |
|---|---|---|---|---|
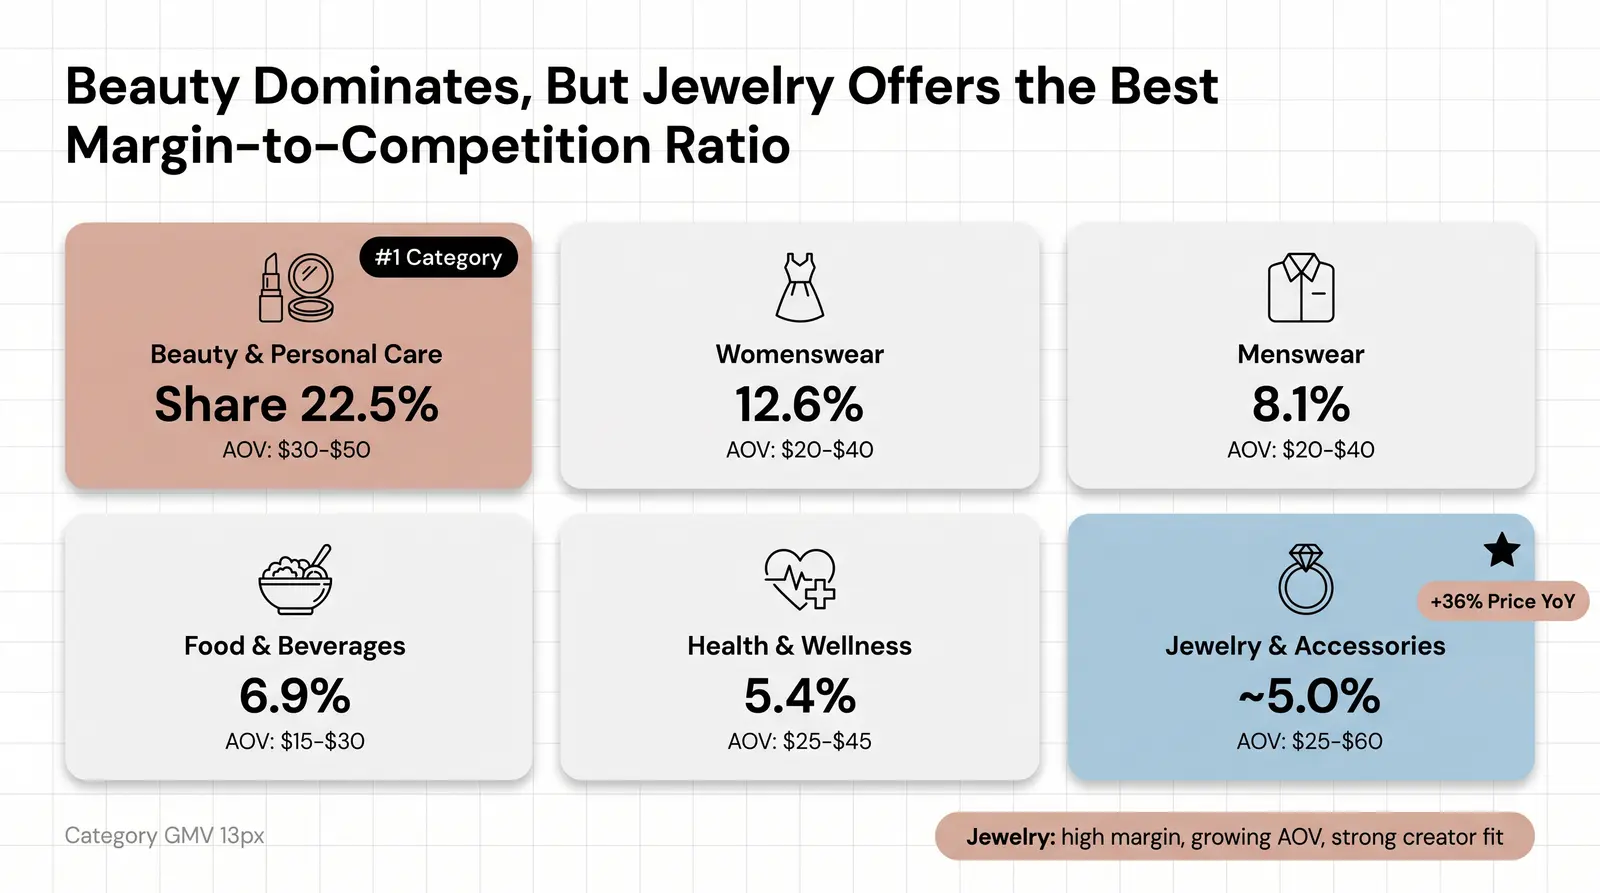
| Beauty & Personal Care | 22.5% | $30 - $50 | High | Requires strong creator seeding and before/after demonstrations. |
| Womenswear & Underwear | 12.6% | $20 - $40 | High | High return rates; requires clear sizing and trend alignment. |
| Menswear & Underwear | 8.1% | $20 - $40 | Medium | Growing segment; focus on basics and comfort. |
| Food & Beverages | 6.9% | $15 - $30 | Medium | Excellent for impulse buys and bundle offers. |
| Health & Wellness | 5.4% | $25 - $45 | High | Strong performance for supplements with clear benefits. |
| Jewelry & Accessories | ~5.0% | $25 - $60 | Medium | High margin; benefits greatly from aesthetic unboxing content. |
Source/Methodology Note: Category share estimates based on Tabcut/AfterShip data for the US market (2024/2025) [9]. AOVs are directional ranges based on industry reporting.
Beauty and Personal Care is the undisputed king of TikTok Shop, driven by the platform's demographic skew and the effectiveness of tutorial and review content.
However, Jewelry & Accessories represents a particularly compelling opportunity. In 2025, while many categories saw average transaction prices decline, the jewelry and accessories category experienced a 36% year-over-year price increase [4]. This category benefits from higher AOVs, gift-driven repeat purchase behavior, and the aesthetic appeal necessary for viral unboxing videos. Furthermore, the high margins in jewelry provide the buffer needed to absorb affiliate commissions and platform fees.
If you're evaluating jewelry or accessories as your TikTok Shop category, Branvas's private-label catalog includes TikTok-Shop-ready products with branded packaging and blind fulfillment — worth exploring before you source.
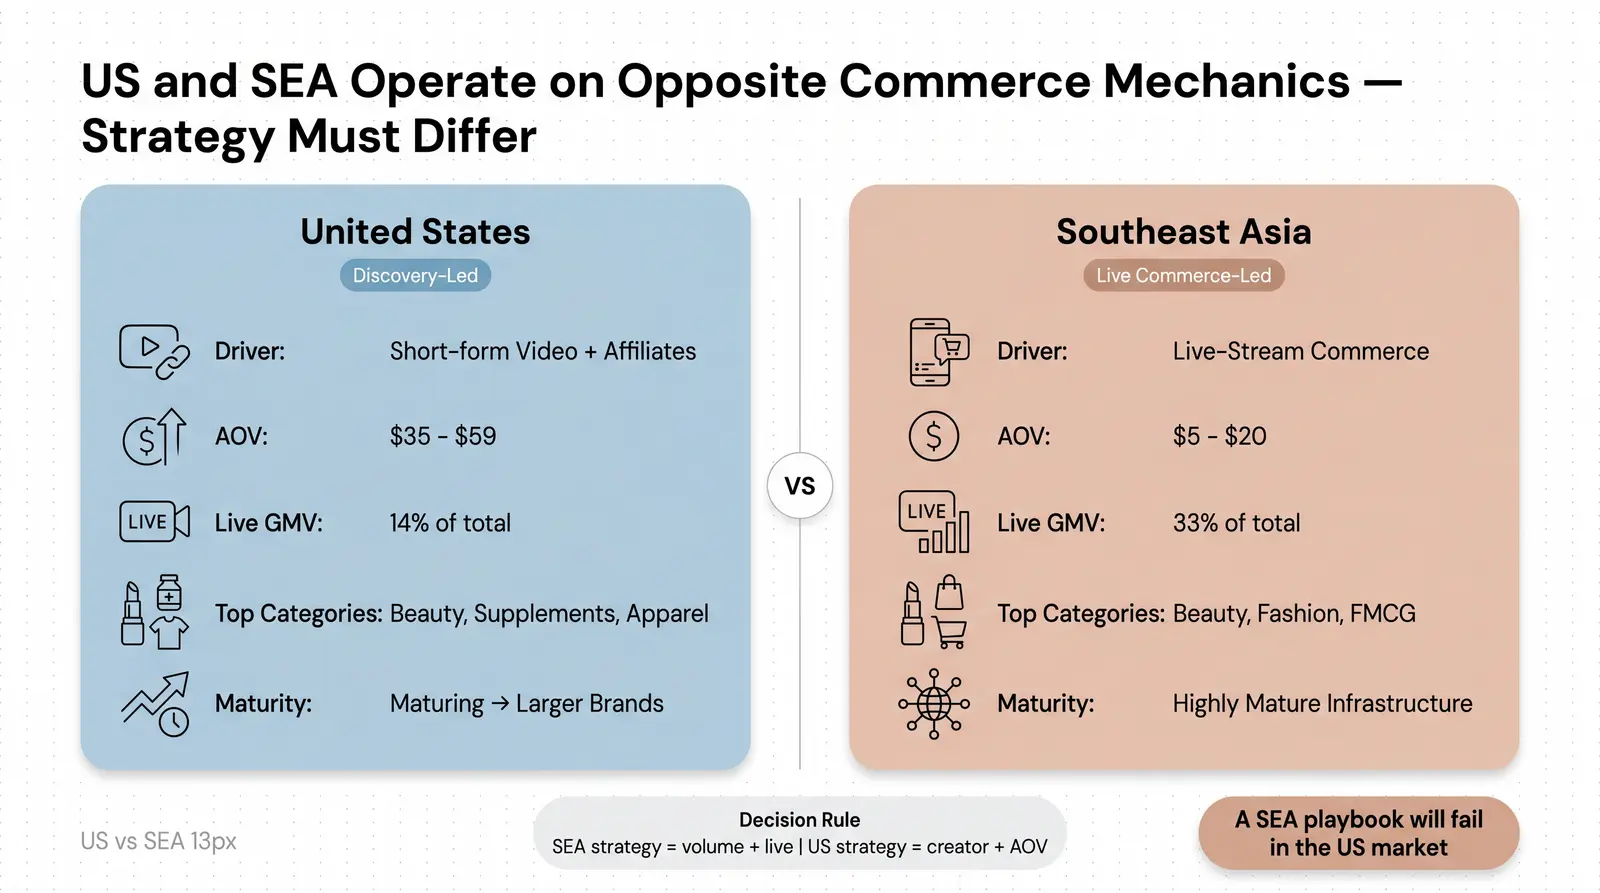
Treating TikTok Shop as a monolith is a mistake. The US and Southeast Asian markets operate on fundamentally different mechanics.
| Feature | United States | Southeast Asia |
|---|---|---|
| Primary Driver | Short-form Video & Affiliates (50% Video GMV) | Live Commerce (33% Live GMV) |
| Average Order Value | $35 - $59 | $5 - $20 |
| Top Categories | Beauty, Supplements, Apparel | Beauty, Fashion, FMCG, Electronics |
| Ecosystem Maturity | Maturing; shift toward larger brands | Highly mature; deeply integrated infrastructure |
| Regulatory Environment | High scrutiny; potential divestment risks | Stabilized (post-Indonesia restructuring) |
The US market is discovery-led. Consumers scroll their "For You" page, encounter an affiliate creator's video, and make an impulse purchase. The AOV is higher, and the affiliate network is the primary distribution channel.
In contrast, Southeast Asia is heavily driven by live-stream commerce. In markets like Thailand and Indonesia, users actively tune into hours-long live sessions to hunt for deals. The logistics infrastructure is highly developed, supporting massive volumes of low-AOV transactions.
A seller optimized for SEA's high-volume, low-margin live streams will likely struggle in the US, where success requires higher-quality video production, larger affiliate payouts, and products that can support a $40+ AOV.
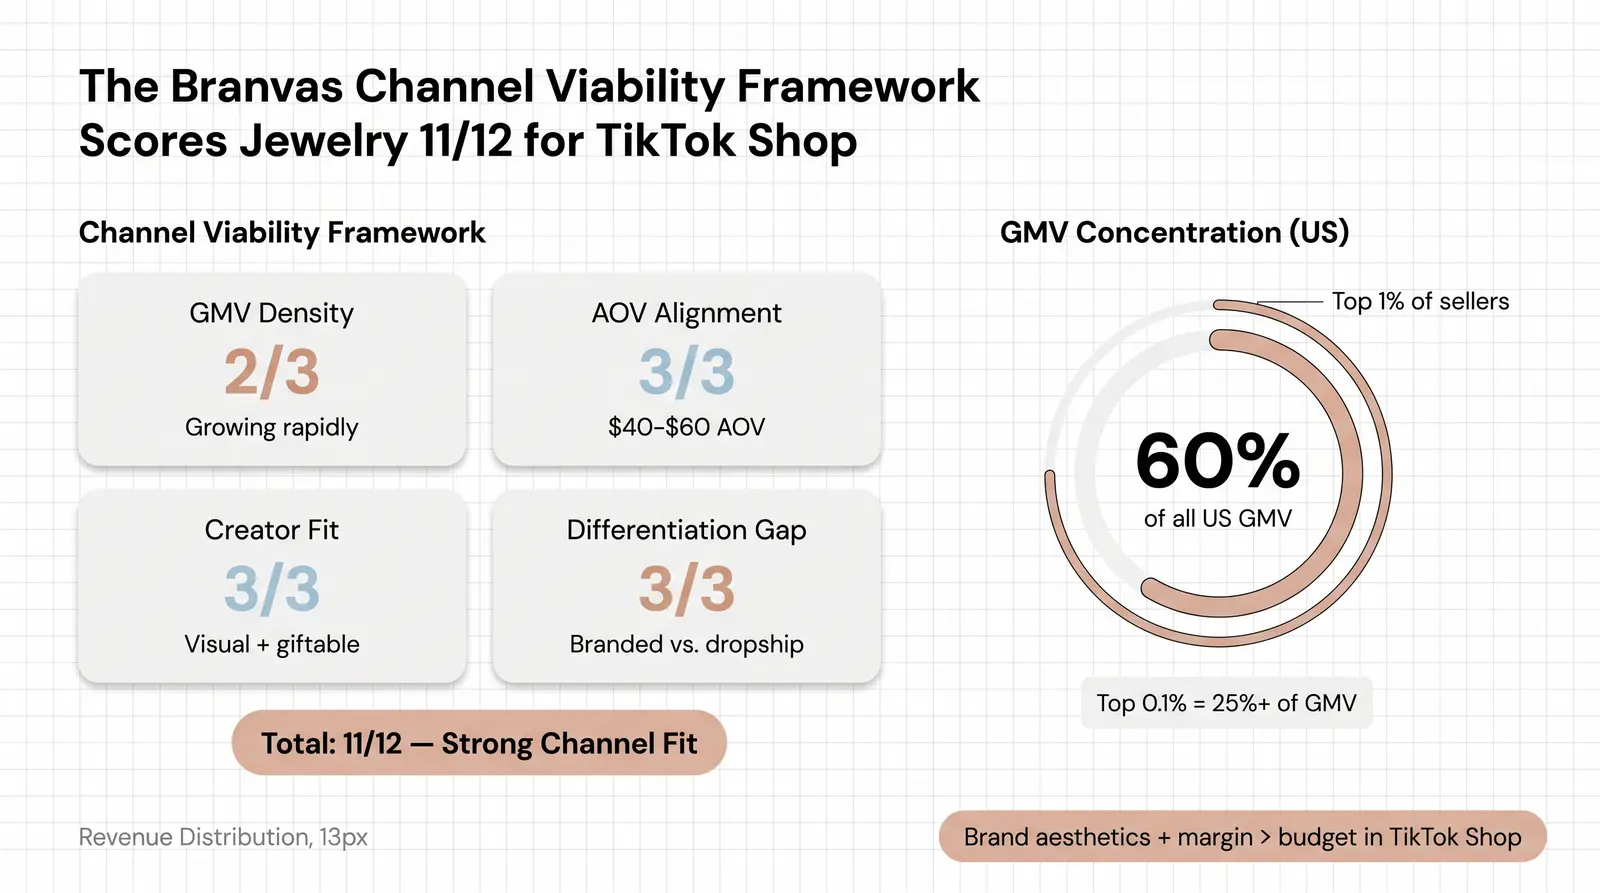
To evaluate a category's true potential, we utilize the Branvas Channel Viability Framework™. This matrix scores opportunities across four dimensions (1-3 scale):
Worked Example: Jewelry & Accessories on TikTok Shop US
This framework is crucial because GMV on TikTok Shop is fiercely concentrated. Data from Marketplace Pulse reveals that the top 1% of US sellers drive approximately 60% of all GMV, and the top 0.1% account for over a quarter of it [5]. The "democratization of commerce" narrative masks a highly unequal distribution of revenue.
In our experience at Branvas, the sellers who scale fastest on TikTok Shop aren't the ones with the biggest budgets — they're the ones with a defensible brand aesthetic that photographs and unboxes well, and a product margin that can absorb a 10–20% affiliate commission without going underwater.
Ready to launch a branded product line built for TikTok Shop? See how Branvas works → — private-label jewelry and accessories with branded packaging, blind fulfillment, and no minimum order requirements.
TikTok Shop's conversion metrics highlight its strength as an impulse-driven platform.
| Platform / Channel | Average Conversion Rate |
|---|---|
| Traditional Ecommerce (Shopify) | 2.0% - 3.0% |
| Instagram Shopping | ~2.1% |
| TikTok Shop (Overall) | 3.2% - 4.7% |
| TikTok Shop (LIVE Sessions) | 5.0% - 12.0% |
Sources: Triple Whale, 10xCrew, Dashboardly [12] [13]
TikTok Shop's conversion rates consistently outperform traditional social commerce channels like Instagram. This is driven by the seamless in-app checkout and the authentic, urgency-driven nature of creator content. LIVE sessions, in particular, generate massive conversion spikes (up to 12%) due to scarcity tactics and host persuasion [13].
AOV Benchmarks:
Note: Conversion rate on TikTok Shop is often measured differently than on Shopify (session-based vs. impression-based) — a methodological caveat that sellers must account for when comparing dashboards.
TikTok Shop is rapidly consuming the broader social commerce market. In the US, it captured 18.2% of all social commerce sales in 2025, up from negligible figures just two years prior [14]. eMarketer projects this share will grow to 24.1% by 2027, steadily eroding the dominance of Facebook Marketplace and Instagram Shopping.
Globally, TikTok is moving toward the model established by WeChat and Taobao Live in China, where social commerce is not a niche channel but the primary mode of digital retail. In China, 70-80% of social commerce sales occur during live streams; while the US is currently at 14% live-stream GMV, the trajectory points toward deeper integration of entertainment and purchasing.
If you're an ecommerce seller or boutique owner evaluating TikTok Shop as a channel, Branvas's ecommerce solutions page covers how private-label products can be positioned for social commerce.
1. What is TikTok Shop's total GMV in 2025?
TikTok Shop's global GMV reached an estimated $64.3 billion in 2025, nearly doubling its 2024 performance. The US market contributed approximately $15.1 billion to this total.
2. How many sellers are on TikTok Shop in the US?
As of mid-2025, there were over 475,000 registered shops in the US. However, active seller counts are lower, with data indicating around 216,000 shops had active sales, and only a small fraction drive the majority of GMV.
3. What are the top-selling categories on TikTok Shop?
Beauty & Personal Care is the dominant category globally, accounting for over 22% of US GMV. Womenswear, Menswear, and Food & Beverages follow closely behind.
4. What is the average order value on TikTok Shop?
In the US, the average order value ranges from $35 to $59 per purchase. In Southeast Asian markets, the AOV is significantly lower, typically between $5 and $20.
5. How does TikTok Shop conversion rate compare to other platforms?
TikTok Shop generally sees higher conversion rates (3.2% - 4.7%) compared to traditional ecommerce (2-3%) and Instagram Shopping (~2.1%). LIVE shopping sessions on TikTok convert even higher, often between 5% and 12%.
[1] TikTok’s Southeast Asia doubles GMV year-on-year to $45.6B in 2025 (TechNode Global, 2026)
[2] 47 TikTok Shop statistics you need to know in 2026 (Ringly.io, 2026)
[3] How Did TikTok Shop Grow in Southeast Asia? A 2026 Analysis of GMV From $4.4B to $45.6B (Digital in Asia, 2026)
[4] [New report] TikTok Shop U.S. GMV grew 68% to reach US$15.1B in 2025 (Momentum Works, 2026)
[5] On TikTok Shop, 1% of Sellers Drive 60% of GMV (Marketplace Pulse, 2026)
[6] TikTok Shop Affiliate Statistics 2026: Benchmarks & ROI (Hamster Garage, 2026)
[7] TikTok Shop GMV in 2024 surpassed US$30 billion (Momentum Works, 2025)
[8] EP-146: TikTok Shop Doubles Down on Asia as Global GMV Soars (Hyphen Partners, 2025)
[9] TikTok Shop Statistics in 2026 (AfterShip, 2026)
[10] How Many TikTok Shop Sellers Are There? (2026 Statistics) (Red Stag Fulfillment, 2026)
[11] What Is the Average TikTok Shop Order Value? (2026 Data) (Red Stag Fulfillment, 2026)
[12] TikTok Shop Growth vs Other Social Commerce Platforms (10xCrew, 2026)
[13] TikTok Shop LIVE Shopping Statistics & Benchmarks (2026) (Dashboardly, 2026)
[14] TikTok Shop Makes Up Nearly 20% of Social Commerce in 2025 (eMarketer, 2025)