Use a 4-layer signal framework and 7 research tools to find winning dropshipping products before competitors saturate the market.
Published:
May 11, 2026
Author:
Yi Cui
Most "find winning products" guides teach you to copy whatever's hot on AutoDS, which is why your competitors are running identical stores. Here's the research process that finds products before they hit the trending feeds.
If you are frustrated by saturated advice, you are not alone. The standard playbook of scrolling trending feeds and copying the top-performing ads is a race to the bottom. This guide is different. It gives you a repeatable, signal-based research methodology, not a list of hot products. We will cover seven essential tools with step-by-step usage instructions, a scoring framework to evaluate any product, and a full worked example using a real jewelry category. By the end, you will have a system you can run every week to find winning products for dropshipping before the market floods.
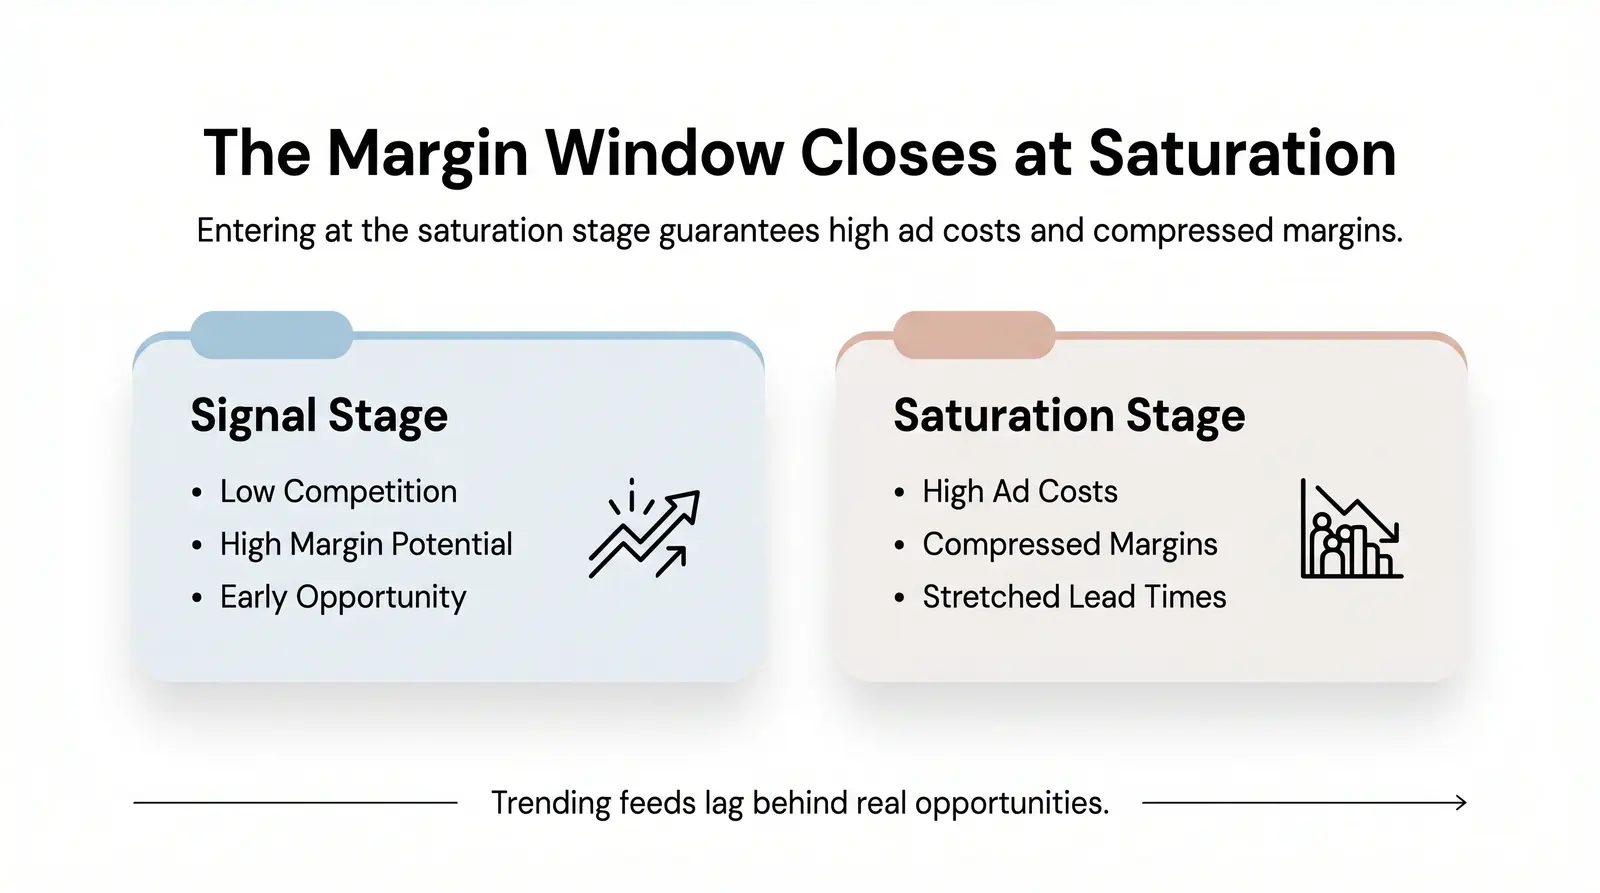
The core problem with trending feeds is the lag. By the time a product appears on AutoDS, Minea's top picks, or a viral TikTok feed, hundreds of stores are already running it. You are not entering the market early. You are entering at the saturation stage.
The most dangerous time to launch a winning product is when everyone agrees it is winning. The real opportunity is in the signal stage, not the saturation stage. When a product reaches saturation, ad costs rise sharply as more advertisers compete for the same audience. Supplier lead times stretch under high demand. Customer acquisition costs compress margins until the economics no longer work. In saturated niches, ad costs spike as the algorithm recognizes that your creative is competing with hundreds of similar products [1].
At Branvas, we consistently see founders enter a product category 6 to 8 weeks too late. The product is real, the demand is real, but the margin window has already closed.
The solution is not to find better trending feeds. It is to move upstream and read the signals that precede those feeds.
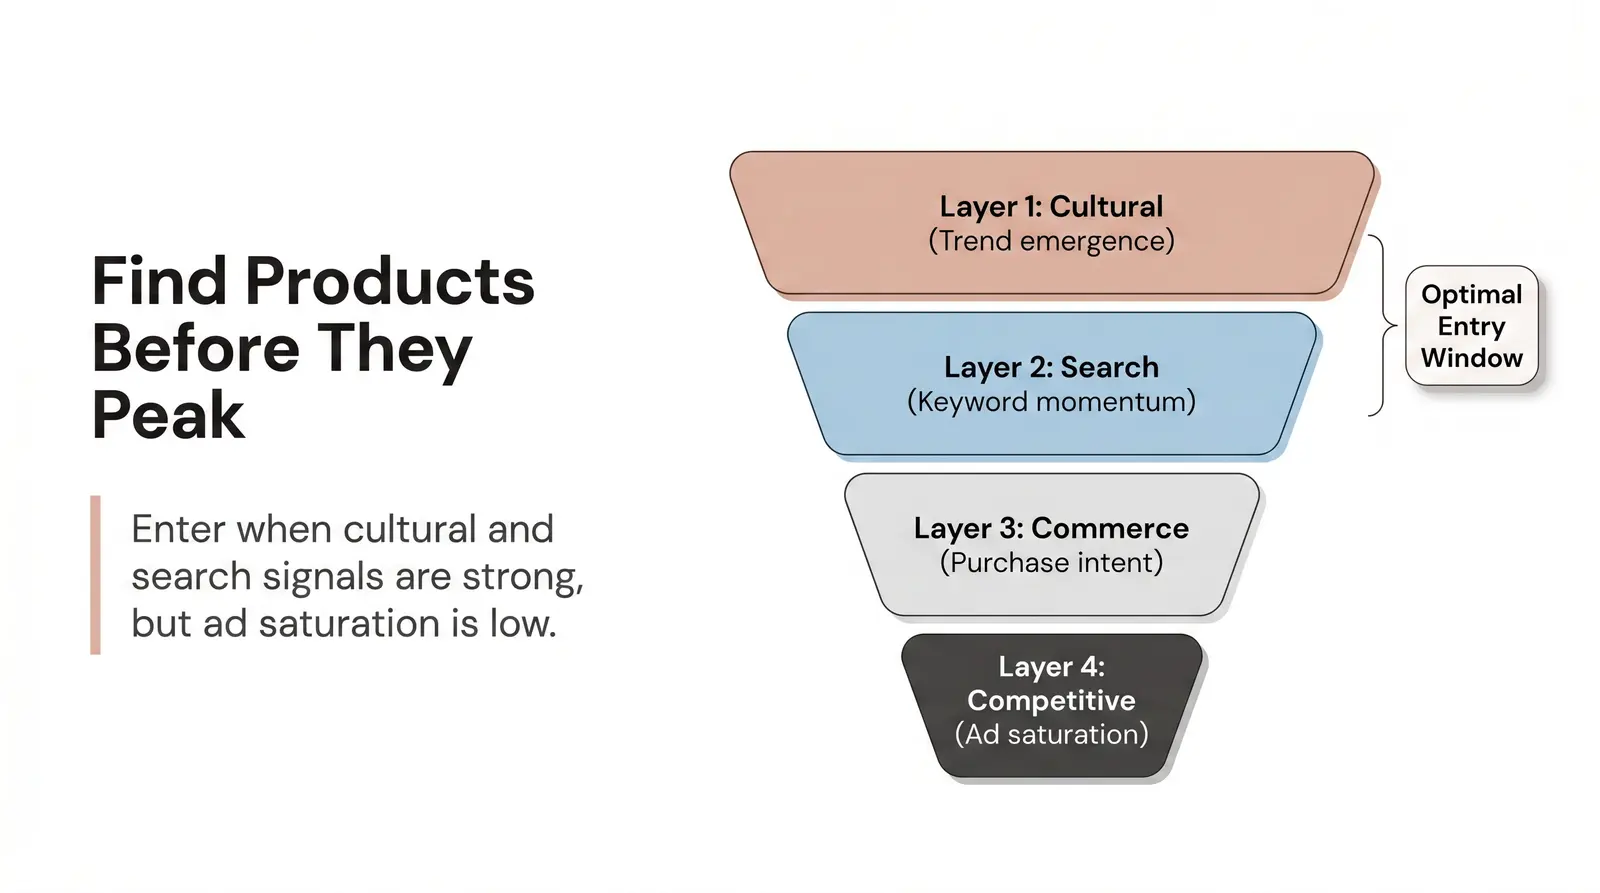
To find products consistently at the signal stage, you need a structured process. We call ours The Branvas 4-Layer Product Signal Funnel™. It is the methodology Branvas uses internally and recommends to brand partners for identifying products before saturation.
The four layers represent a natural progression from early cultural shifts to late-stage ad saturation. A product showing strong signals in Layers 1 and 2, but weak signals in Layers 3 and 4, is a pre-peak opportunity. A product strong across all four layers is likely at or past peak for new entrants.
| Layer | Signal Type | Primary Tool(s) | What You're Looking For | Risk If You Wait |
|---|---|---|---|---|
| 1 – Cultural | Trend emergence | Pinterest Trends, TikTok Search | Aesthetic or style gaining saves and shares | Months before peak |
| 2 – Search | Keyword momentum | Google Trends, Exploding Topics | Rising search curve, not yet flat | Weeks before peak |
| 3 – Commerce | Purchase intent | Amazon Movers & Shakers, TikTok Shop | Bestseller movement, shop GMV data | At or near peak |
| 4 – Competitive | Ad saturation | Meta Ads Library, Minea | Number of active ads, creative volume | Past peak for new entrants |
The goal is to enter a product category when you see clear Layer 1 and Layer 2 signals, but before the Layer 3 and Layer 4 signals become crowded. That is your window.
Google Trends is your primary tool for validating search momentum. It confirms that a cultural signal is translating into active consumer interest, and it helps you compare product variants to find the specific angle that is ascending.
First, use the "rising" filter under "related queries" rather than just looking at overall volume. Rising queries show you breakout terms gaining sudden momentum, which is exactly what you want to spot early.
Second, compare product variants directly. Enter two or more descriptors side by side, for example "chunky gold necklace" versus "layered gold necklace," to see which aesthetic is gaining faster. This helps you position your product around the winning angle.
Third, apply geographic filters. Filter by the US or UK to find localized momentum before a trend spreads globally. A trend rising in one market often signals where the broader market is heading.
Finally, always use a 90-day window. A single spike often reflects a viral moment that fades quickly. A consistent upward slope over 90 days indicates genuine, sustained demand.
TikTok Shop generated $34 billion in GMV in 2024 and is projected to grow significantly in 2025, making it one of the most important signals for emerging product demand [2]. The Creative Center is a free intelligence tool available at ads.tiktok.com/business/creativecenter, and it requires no TikTok account to access.
Start with the "Top Products" tab. This shows which product categories have the most active ads, ranked by spend, click-through rate, and conversion rate. Set your region to your target market and sort by CVR to find products people are actually buying, not just clicking on.
Next, use the "Top Ads" section. Filter by your product category and watch the highest-performing ads, specifically those that have been running for 30 or more days. Look for patterns in how the product is demonstrated, what hook is used in the first three seconds, and what price points are featured.
Finally, use "Trending Hashtags" to reverse-engineer which products are driving organic viral videos. If a hashtag related to a product style is growing rapidly, that is a Layer 1 cultural signal before it becomes a Layer 4 ad competition problem.
Amazon Movers & Shakers tracks products experiencing the biggest uptick in sales rank over the past 24 hours. The list updates every hour, giving you near-real-time data on what consumers are actively buying [3]. This makes it a strong Layer 3 commerce confirmation tool.
The key is to use it for confirmation, not discovery. If you are already tracking a product through Layers 1 and 2, seeing it climb Movers & Shakers confirms that purchase intent is real.
Always filter by subcategory. Do not look at the general list. Navigate to specific subcategories like "Fashion Jewelry" or "Body Jewelry" to find relevant movements in your niche.
The most valuable signal is the cross-reference check. If a product is climbing Amazon Movers & Shakers but shows low ad volume in the Meta Ads Library, you have found a window where demand is confirmed but competitive ad pressure is still low. That is the window you want to move in.
Pinterest is a leading indicator for aesthetic and lifestyle trends, particularly in categories like jewelry, fashion, and home decor. Research shows that 85% of weekly Pinterest users have made a purchase based on a Pin they saw from a brand [4]. Users come to Pinterest in a planning mindset, which means they are often months ahead of where their actual purchases will land.
Use pinterest.com/trends to track visual category trends. Search style keywords relevant to your niche and examine the monthly trend curve. A keyword showing consistent growth over three to six months is a strong Layer 1 signal.
For jewelry and accessories specifically, Pinterest is particularly powerful. Users actively build mood boards around aesthetics, which means you can see a style gaining traction long before it shows up in search volume or ad spend.
The Meta Ads Library is your primary tool for assessing competitive saturation. It is free, requires no account, and shows you every active ad running on Facebook and Instagram.
Search by product keyword and filter to show only active ads. Then look at how long each ad has been running. Ads that have been active for 30 or more days are almost certainly profitable, which tells you the product works but also that competition is established.
To spot a saturating product, look for dozens of similar creatives from multiple large accounts. When you see the same product angle repeated across many advertisers, the market is crowded.
To spot an emerging opportunity, look for one to three creatives, recently launched, from small or mid-sized accounts. This is the early ad signal that a product is gaining traction before the big players pile in.
Exploding Topics uses AI to scan millions of data points across the internet and surface trends 6 to 18 months before they hit the mainstream [5]. It is one of the few tools that genuinely operates at Layer 1 and Layer 2 simultaneously.
Use the category filters to focus on ecommerce, fashion, beauty, or lifestyle. When a topic appears in Exploding Topics with strong momentum, take it immediately to Google Trends to confirm the search curve and understand the specific keywords driving interest.
Pro plans start at $39 per month billed annually, and a two-week trial is available for $1. For serious winning product research, the ability to search the full trend database by keyword is worth the investment.
Minea is a comprehensive ad spy tool that tracks over 921 million ads across Facebook, TikTok, and Pinterest, updating its database eight times daily [6]. It goes significantly deeper than the free Meta Ads Library.
Use Minea to analyze cross-platform ad performance. A product that is working on Facebook but not yet on TikTok may represent an opportunity to be first on a new channel. Filter ads by engagement, run time, and category to find proven performers.
Most importantly, use Minea to validate your Layer 4 assessment. Its Success Radar scores products based on engagement and trend data, giving you a quick signal on whether a product is genuinely emerging or already past peak.
Once you have a shortlist of products from your research, you need an objective way to evaluate them before committing to sourcing. We use the Branvas Product Viability Matrix™, the same rubric we use when evaluating products for Branvas brand partners.
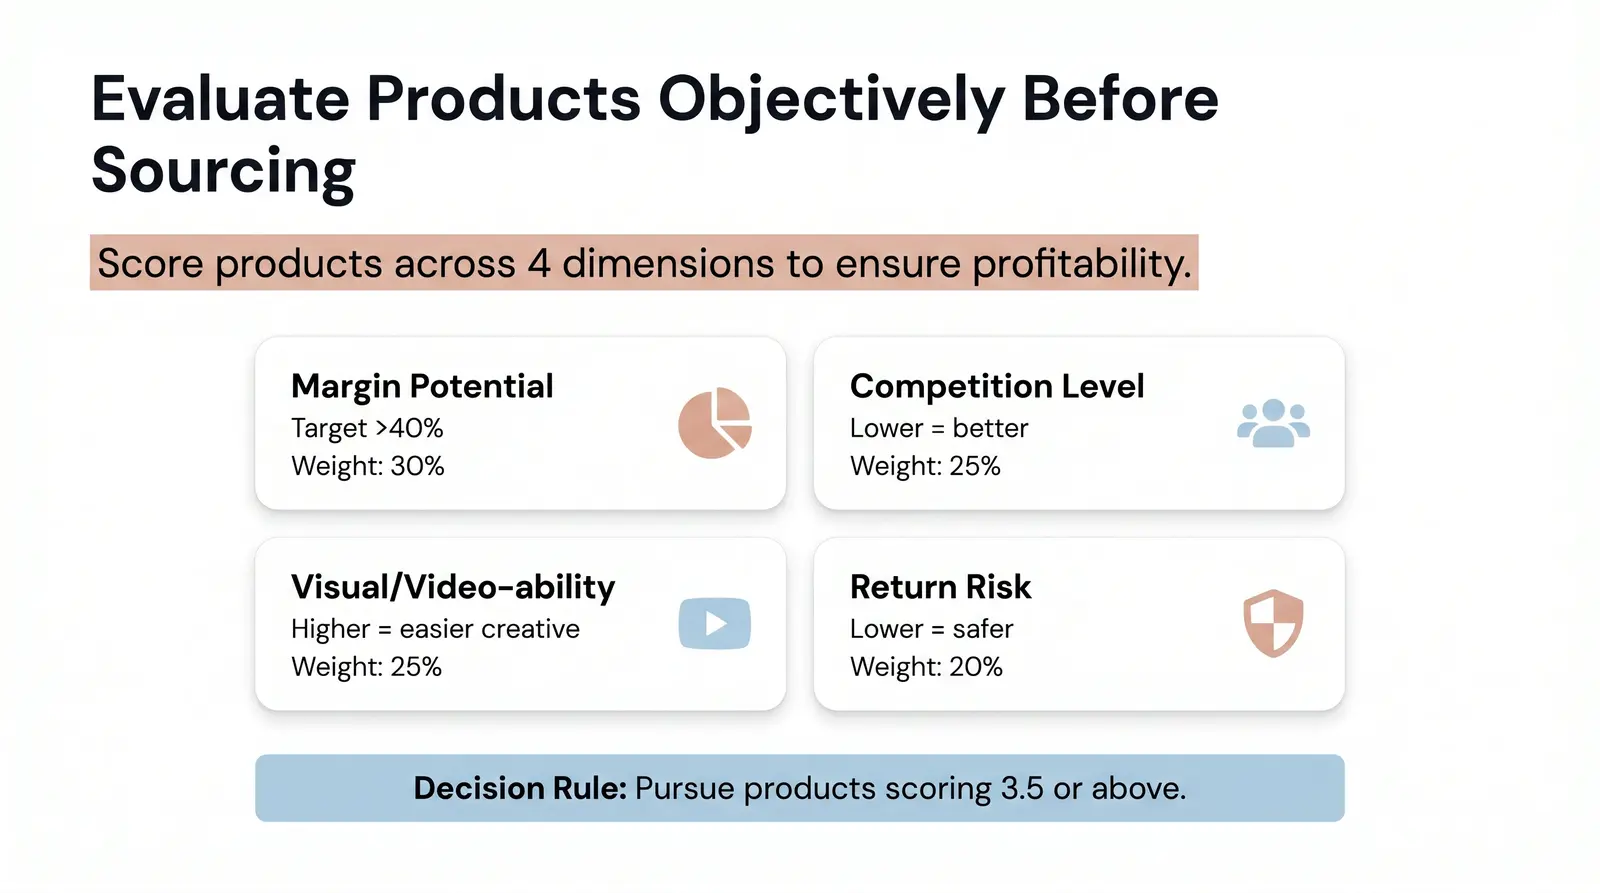
The matrix scores any product across four dimensions.
Margin Potential asks whether the product can realistically achieve 40% or more in net margin after COGS, shipping, and ad spend. Consider supplier pricing, perceived value, and whether the product can be price-anchored against a higher-end alternative.
Competition Level measures how many active ads, stores, and SKU variants already exist. Use your Layer 4 signals to assess this. A lower score means more competition.
Visual/Video-ability asks whether the product lends itself to compelling short-form video. Can it be shown in a transformation, unboxing, or styling context? This is critical for organic and paid performance on TikTok and Instagram.
Return Risk considers whether the product is size-dependent, fragile, or heavily subjective in terms of fit or color accuracy. High return rates destroy dropshipping economics faster than almost anything else.
| Dimension | Weight | Score (1–5) | Notes |
|---|---|---|---|
| Margin Potential | 30% | — | Target: 40% or more net margin |
| Competition Level | 25% | — | Lower score = more competition |
| Visual/Video-ability | 25% | — | Higher = easier organic and paid creative |
| Return Risk | 20% | — | Lower score = higher return risk |
| Weighted Total | 100% | — | 3.5 or above = pursue; below 2.5 = skip |
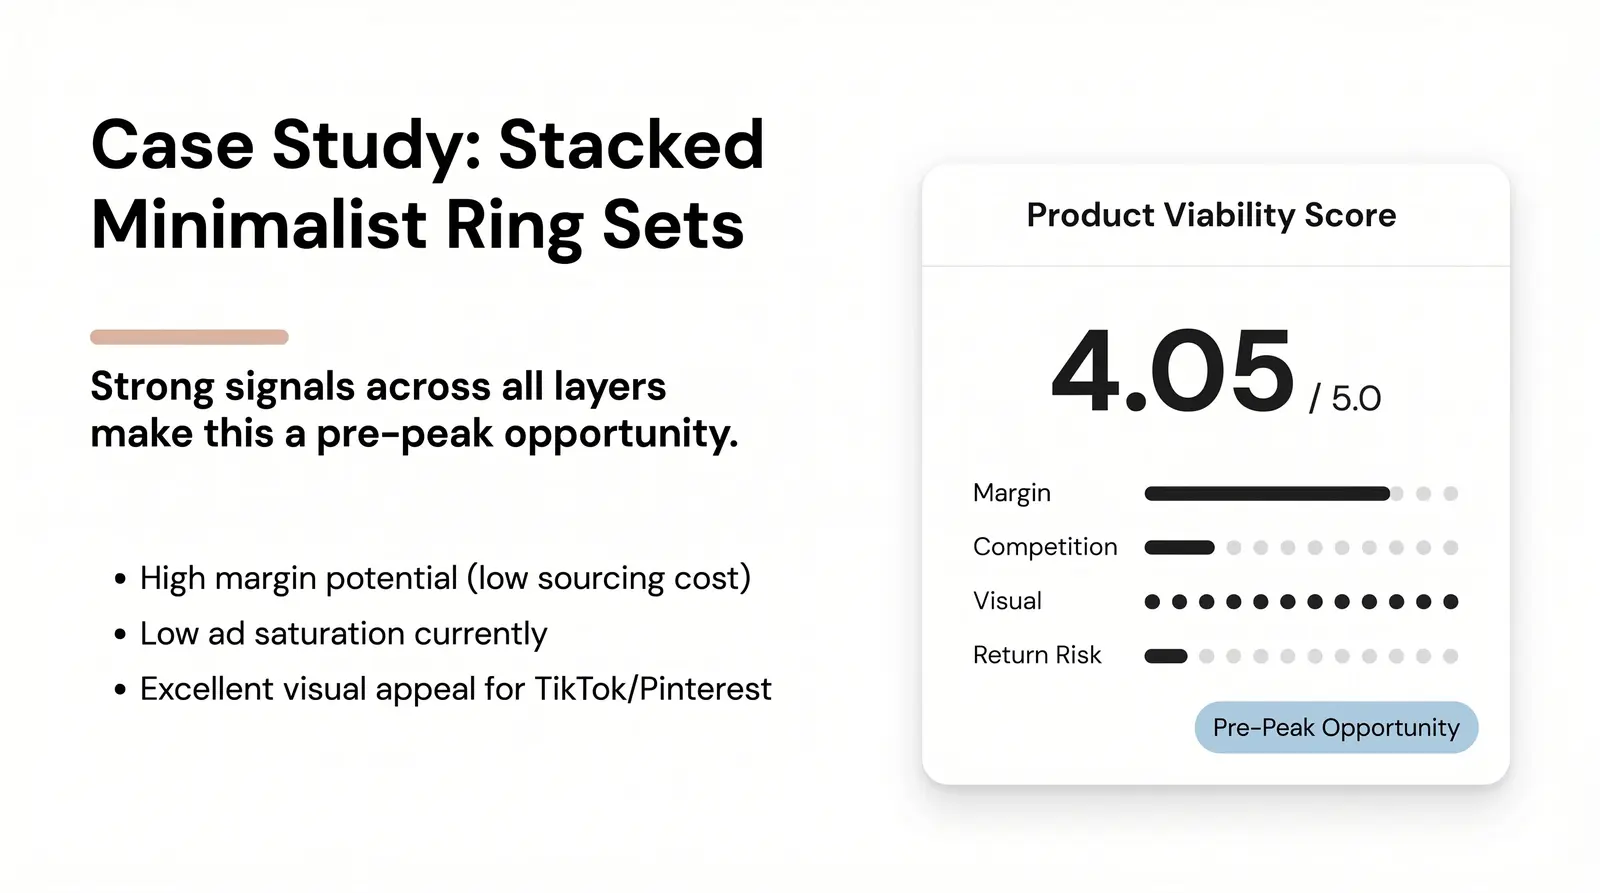
Let's apply the full framework to a currently trending category: stacked minimalist ring sets.
Layer 1 (Cultural): Pinterest Trends shows a steady six-month rise in saves for "minimalist ring stacks" and "everyday gold jewelry." TikTok search shows growing organic content from micro-influencers featuring ring stacking in GRWM videos.
Layer 2 (Search): Google Trends shows a consistent 90-day upward slope for "stackable rings" in the US and UK. Exploding Topics has flagged "minimalist jewelry" as a rising trend in the lifestyle category.
Layer 3 (Commerce): Amazon Movers & Shakers in the "Fashion Jewelry" subcategory shows several multi-pack ring sets climbing the rankings over the past week.
Layer 4 (Competitive): Meta Ads Library shows a handful of brands running ads, but creative volume is low and most ads are under 14 days old. Minea confirms low TikTok ad saturation for this specific style.
Scoring:
| Dimension | Weight | Score (1–5) | Notes |
|---|---|---|---|
| Margin Potential | 30% | 4 | High perceived value as a set; low sourcing cost for stainless steel or brass |
| Competition Level | 25% | 4 | Demand rising, ad saturation still low |
| Visual/Video-ability | 25% | 5 | Excellent for GRWM styling, close-up aesthetic shots, ASMR unboxing |
| Return Risk | 20% | 3 | Sizing introduces some risk; adjustable rings or size guides mitigate this |
| Weighted Total | 100% | 4.05 | Pursue |
Verdict: This is a strong pre-peak opportunity. The signals are clear across all four layers, and the product scores well on the viability matrix. A seller should position this not just as jewelry, but as an effortless way to elevate an everyday aesthetic, targeting the minimalist or "clean girl" lifestyle niches on TikTok and Pinterest.
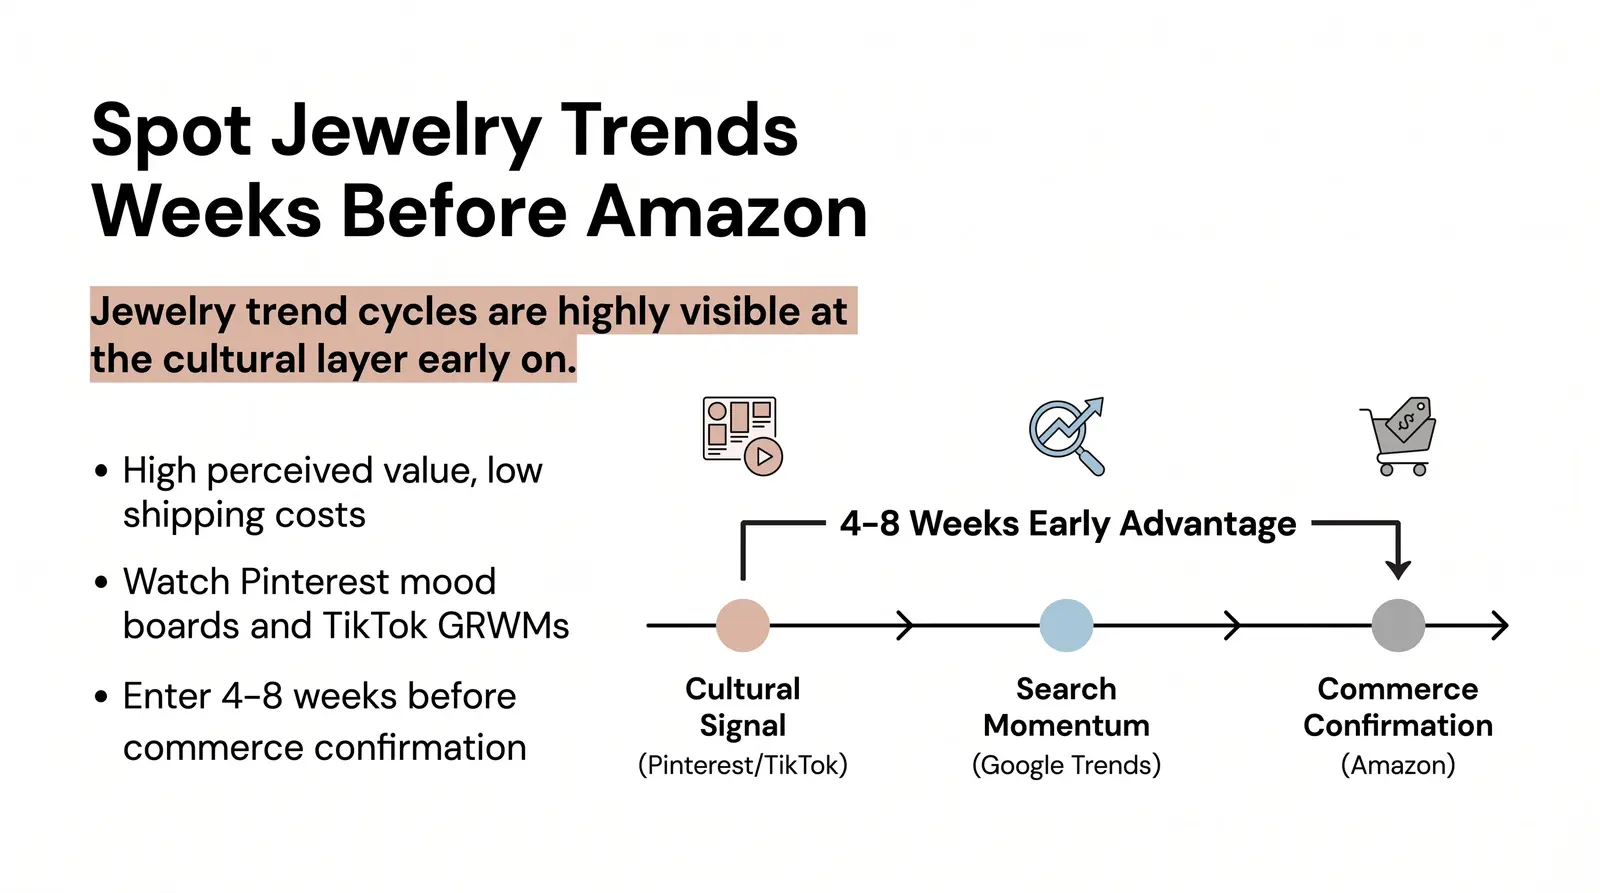
Jewelry is one of the highest-reward categories for early-trend identification. It offers high perceived value, low weight and shipping costs, strong visual and video appeal, and excellent organic performance on Pinterest and TikTok. The US jewelry market alone is projected to grow from $105.2 billion in 2024 to $159.6 billion by 2033 [7].
The key advantage in jewelry is that trend cycles are highly visible at the cultural layer before they translate into commerce signals. A new aesthetic style will appear in micro-influencer content, Pinterest mood boards, and editorial fashion features weeks or months before it drives search volume or Amazon sales rank movement.
The specific signals to watch for at Layer 1 and Layer 2 include Pinterest saves on aesthetic mood boards, TikTok "get ready with me" styling videos featuring a specific look, and micro-influencer content built around a particular aesthetic keyword. When you see these signals growing, you are likely 4 to 8 weeks ahead of the commerce confirmation stage.
The typical jewelry trend timeline moves from cultural signal to search momentum, then commerce confirmation, and finally saturation. Entering at Layer 1 or 2 is your primary advantage. By the time a jewelry style hits Amazon Movers & Shakers, the window for the best margins is often closing.
In our Brand Studio workflow at Branvas, we track a list of aesthetic and style keywords weekly across Pinterest and TikTok — not for ad research, but purely as early cultural sensors. By the time a style hits Amazon Movers & Shakers in jewelry, we've usually been watching it for 4 to 6 weeks.
If you've identified a jewelry or accessories trend you want to move on quickly, Branvas's Brand Studio can take you from trend insight to a branded, shippable product line faster than traditional sourcing. See how it works →
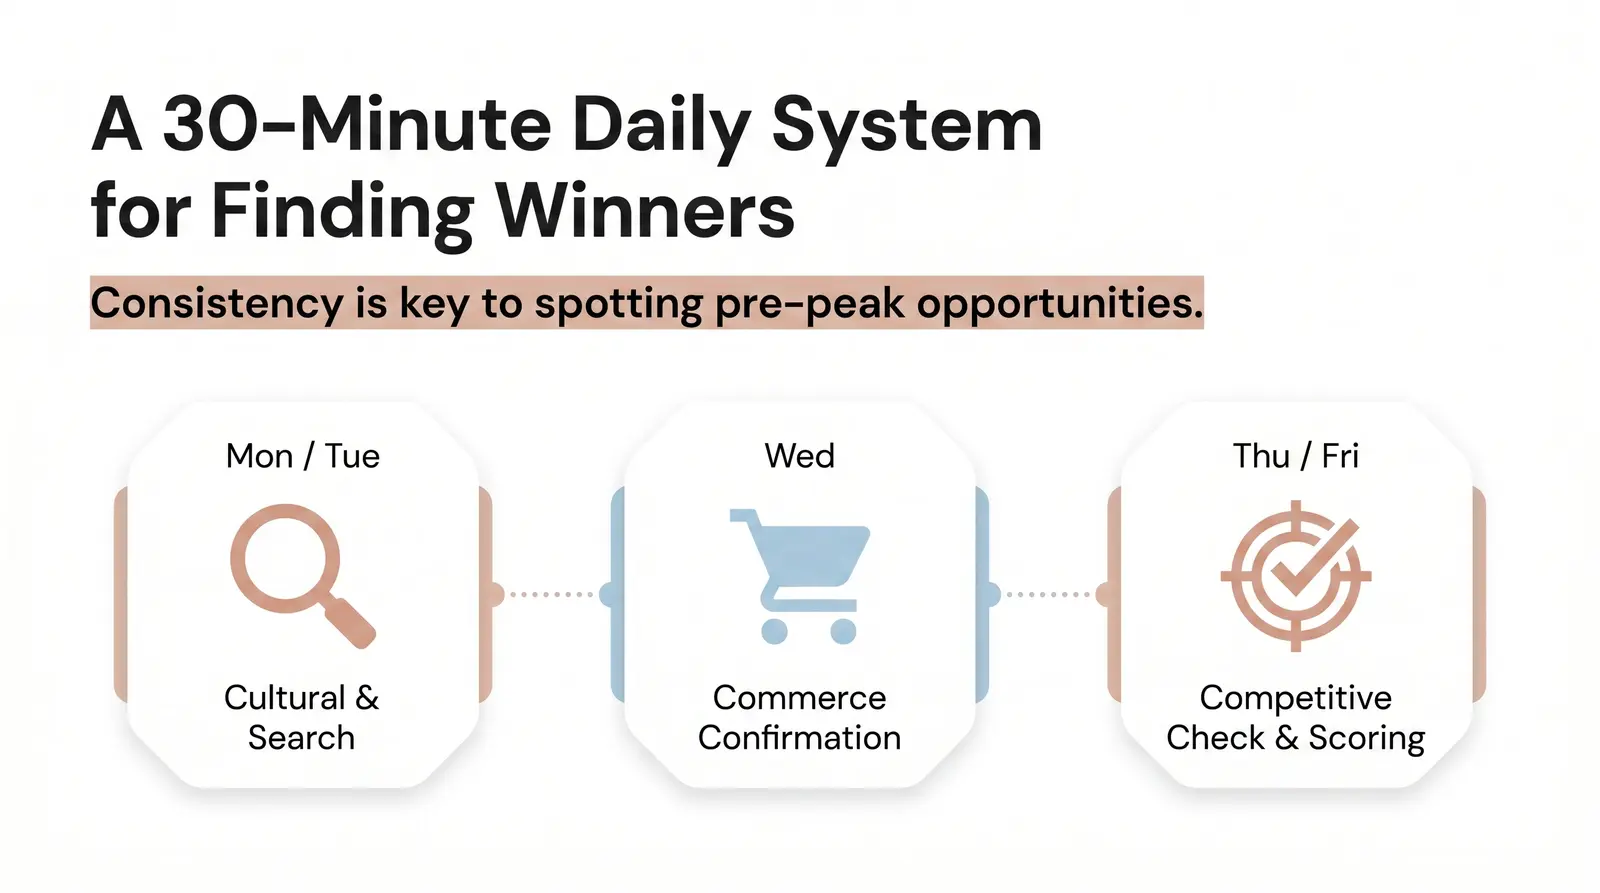
The methodology only works if you run it consistently. Here is a practical weekly workflow that takes roughly 30 to 60 minutes per day.
Monday: Check Pinterest Trends and TikTok Creative Center for new aesthetic signals (Layer 1). Note any styles or categories gaining saves, shares, or ad spend.
Tuesday: Run Google Trends and Exploding Topics on any new signals from Monday. Look for a rising search curve over 90 days to confirm momentum (Layer 2).
Wednesday: Scan Amazon Movers & Shakers in your relevant subcategories and check TikTok Shop trending products for commerce confirmation (Layer 3).
Thursday: Run the Meta Ads Library and Minea for any products that passed Layers 1 through 3. Check for ad saturation and creative volume (Layer 4).
Friday: Score any shortlisted products using the Branvas Product Viability Matrix. Advance products scoring 3.5 or above to the sourcing and testing phase.
Ready to turn your product research into a launched brand? Branvas handles private-label sourcing, branded packaging, and blind fulfillment — so you can move from trend insight to live store without the supply chain headache. Explore Branvas for Ecommerce Sellers →
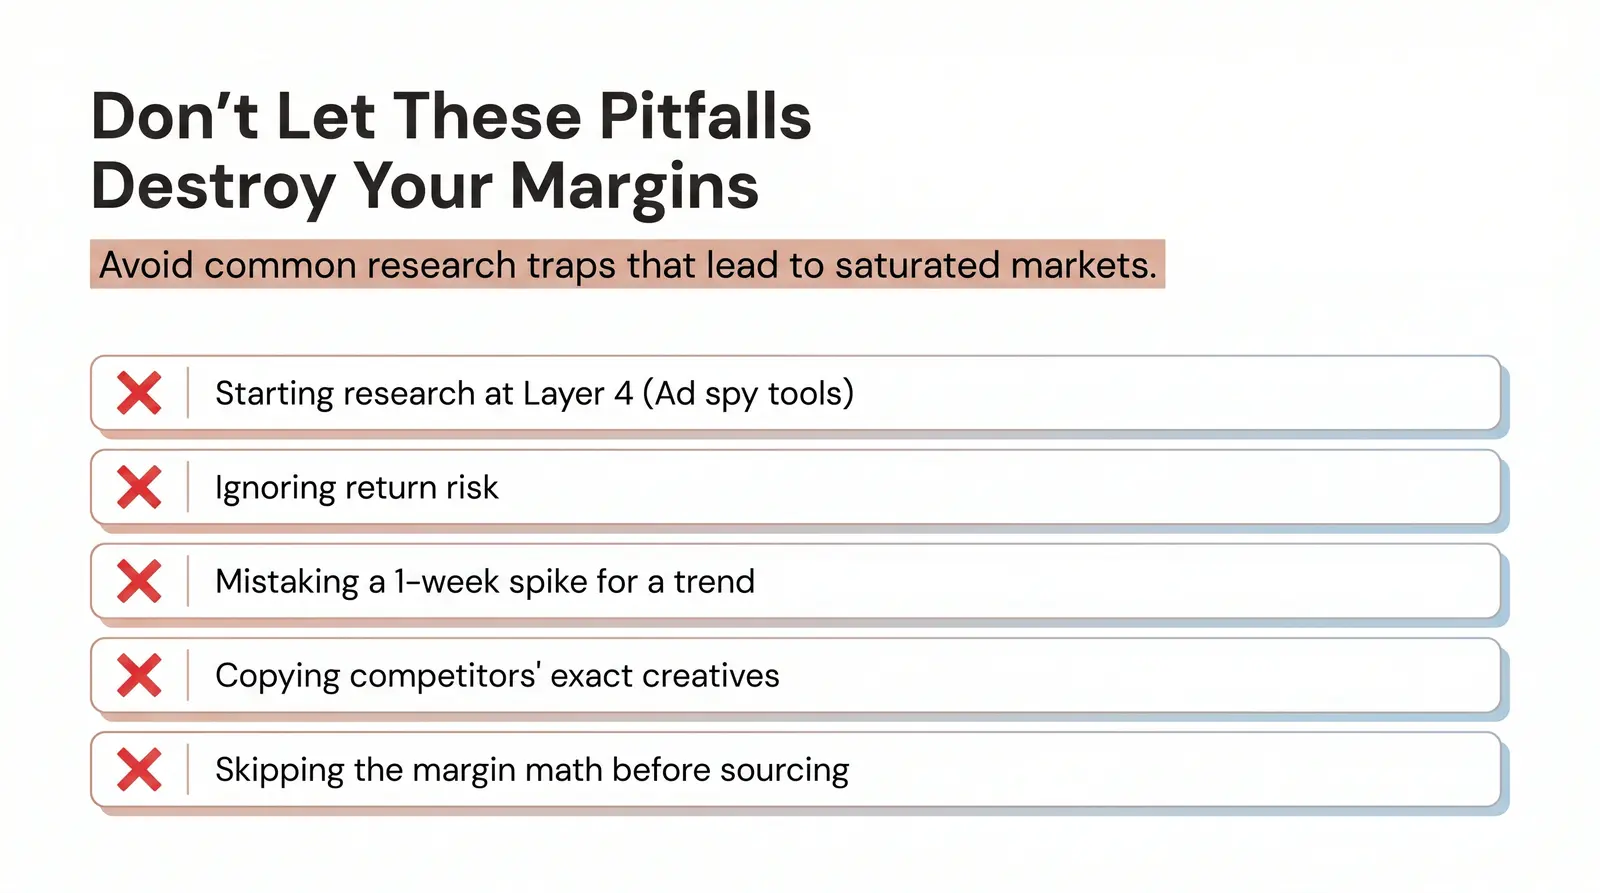
Researching only in Layer 3 and Layer 4 tools. If your entire research process starts with ad spy tools or Amazon bestsellers, you are already behind. By the time a product appears in those feeds, the margin window is often closing.
Ignoring return risk in the scoring process. A product with great gross margins on paper will fail if a significant portion of customers return it due to sizing, quality, or color accuracy issues. Always factor return risk into your evaluation.
Mistaking a one-week spike for a trend. Always use 90-day Google Trends windows. A single viral moment can create a spike that disappears within two weeks. Sustained demand looks different from a flash of attention.
Copying competitors' exact creative angles. Copying an ad creative is not a strategy. Find a differentiated positioning, a different target demographic, or a different use case for the same product.
Skipping the margin math before sourcing. A winning product with a 15% net margin after ad spend is not a winning business. Always calculate your true costs, including COGS, shipping, platform fees, and realistic ad spend, before committing to a product.
What is the best tool for finding winning dropshipping products?
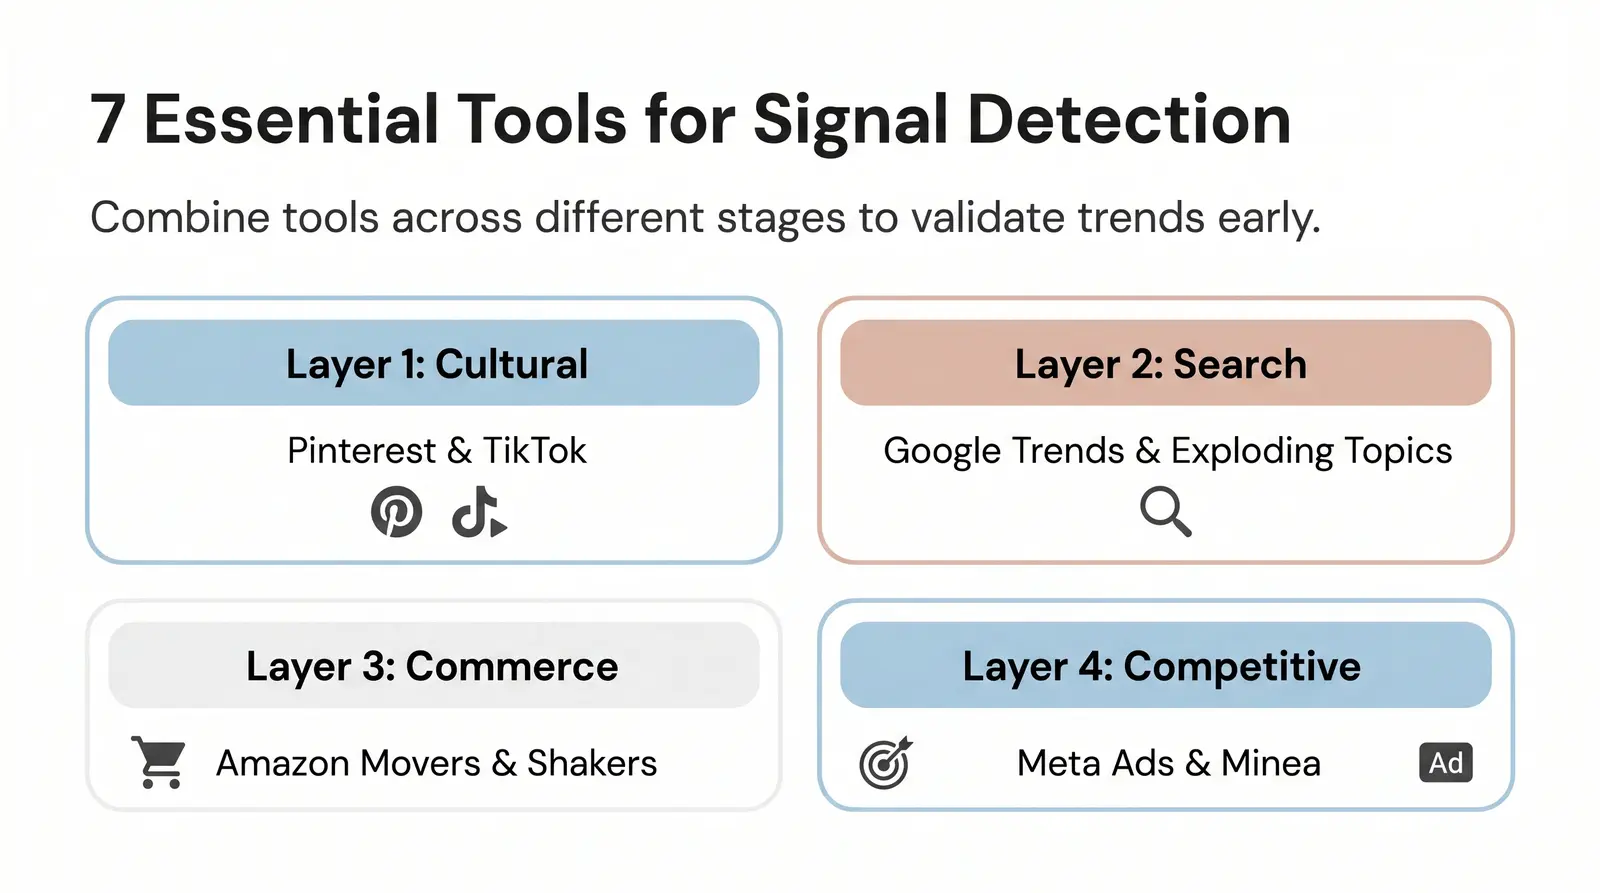
There is no single best tool. The most effective approach combines tools across different stages of a trend. Pinterest Trends and Exploding Topics are excellent for early discovery at Layer 1. Google Trends validates search momentum at Layer 2. Amazon Movers & Shakers confirms purchase intent at Layer 3. The Meta Ads Library and Minea check competitive saturation at Layer 4. Using all of them together is what separates a rigorous winning product research process from guesswork.
How do I know if a product is too saturated to dropship?
A product is likely saturated if you see dozens of similar ad creatives in the Meta Ads Library, especially from large, established accounts with ads running for 60 or more days. High CPMs in a niche are another signal: when many advertisers are competing for the same audience, the cost per thousand impressions rises sharply, compressing margins for everyone entering the market.
How do I find trending products before they go viral?
Focus on Layer 1 cultural signals. Monitor Pinterest for rising aesthetic saves and watch TikTok for emerging styles among micro-influencers. The goal is to spot an aesthetic shift before it translates into massive search volume or ad spend. By the time something is "going viral," you are already at or past the optimal entry point.
Is jewelry a good niche for dropshipping?
Yes, jewelry is one of the strongest niches for dropshipping when approached with the right research process. It offers high perceived value, low shipping costs, and strong visual appeal for social media. The key is identifying trends early and building a branded aesthetic rather than competing on generic pieces. For ecommerce and boutique store owners, the combination of early trend identification and a private-label approach is particularly powerful.
How long does it take to find a winning product?
Finding a winning product is an ongoing process, not a one-time event. By running the weekly research ritual consistently, you should identify and score several high-potential products each month. The first few weeks involve building your baseline knowledge of what signals look like in your niche. After that, the process becomes faster and more intuitive.