A cross-category margin analysis reveals owned-store sellers consistently outperform Amazon sellers in net margins, AOV, and customer lifetime value across jewelry, beauty, apparel, home goods, and electronics.
Published:
October 2, 2026
Author:
Yi Cui
Owned-store sellers earn meaningfully higher net margins than Amazon sellers across nearly every product category — a finding supported by Branvas's cross-category margin analysis and corroborated by publicly available seller data.
In our experience at Branvas, most founders are surprised by how dramatically the margin picture changes once you account for Amazon's full fee stack — not just the referral fee, but FBA, storage, PPC, and returns. This article provides a rigorous, category-by-category margin comparison across jewelry, apparel, home goods, electronics, and beauty. We examine Amazon versus owned-store channels, factoring in net margin, average order value (AOV), return rates, and customer lifetime value (LTV).
To help founders model their own economics, we have embedded the Branvas Channel Margin Index below, a downloadable data table comparing true profitability across sales channels.
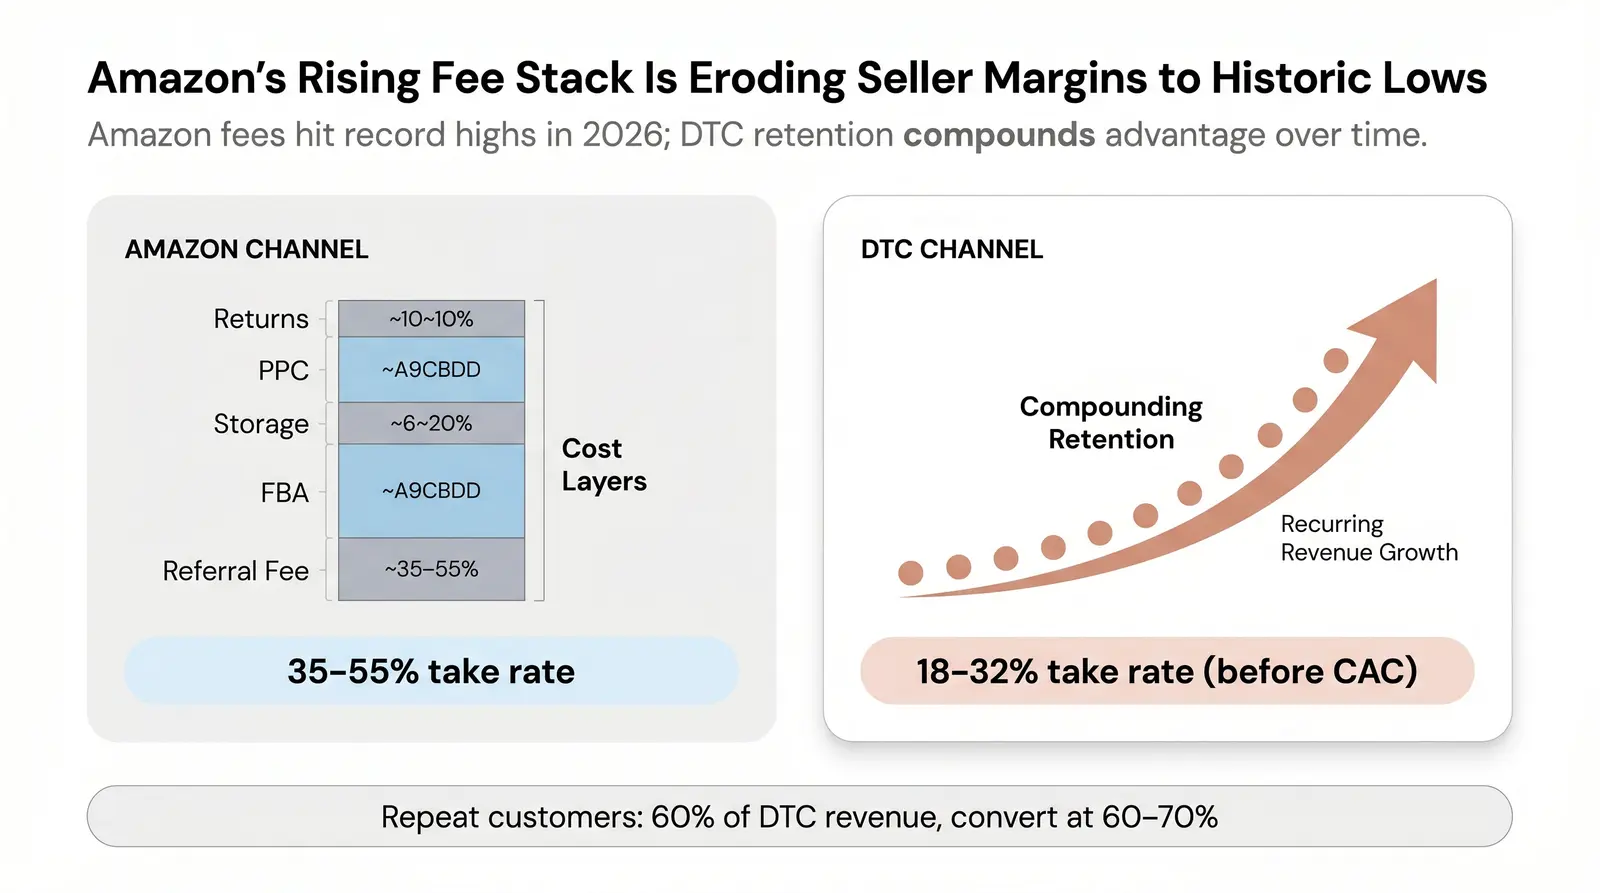
The ecommerce landscape is shifting. Following consecutive years of Amazon fee increases — including new inbound placement fees and a 2026 fuel and logistics surcharge — the cost of selling on the marketplace has reached historic highs [1] [2]. Simultaneously, the direct-to-consumer (DTC) model has matured, offering sophisticated logistics and retention tools that were once exclusive to enterprise brands. This has accelerated the movement of sellers toward owned-store models to protect their margins.
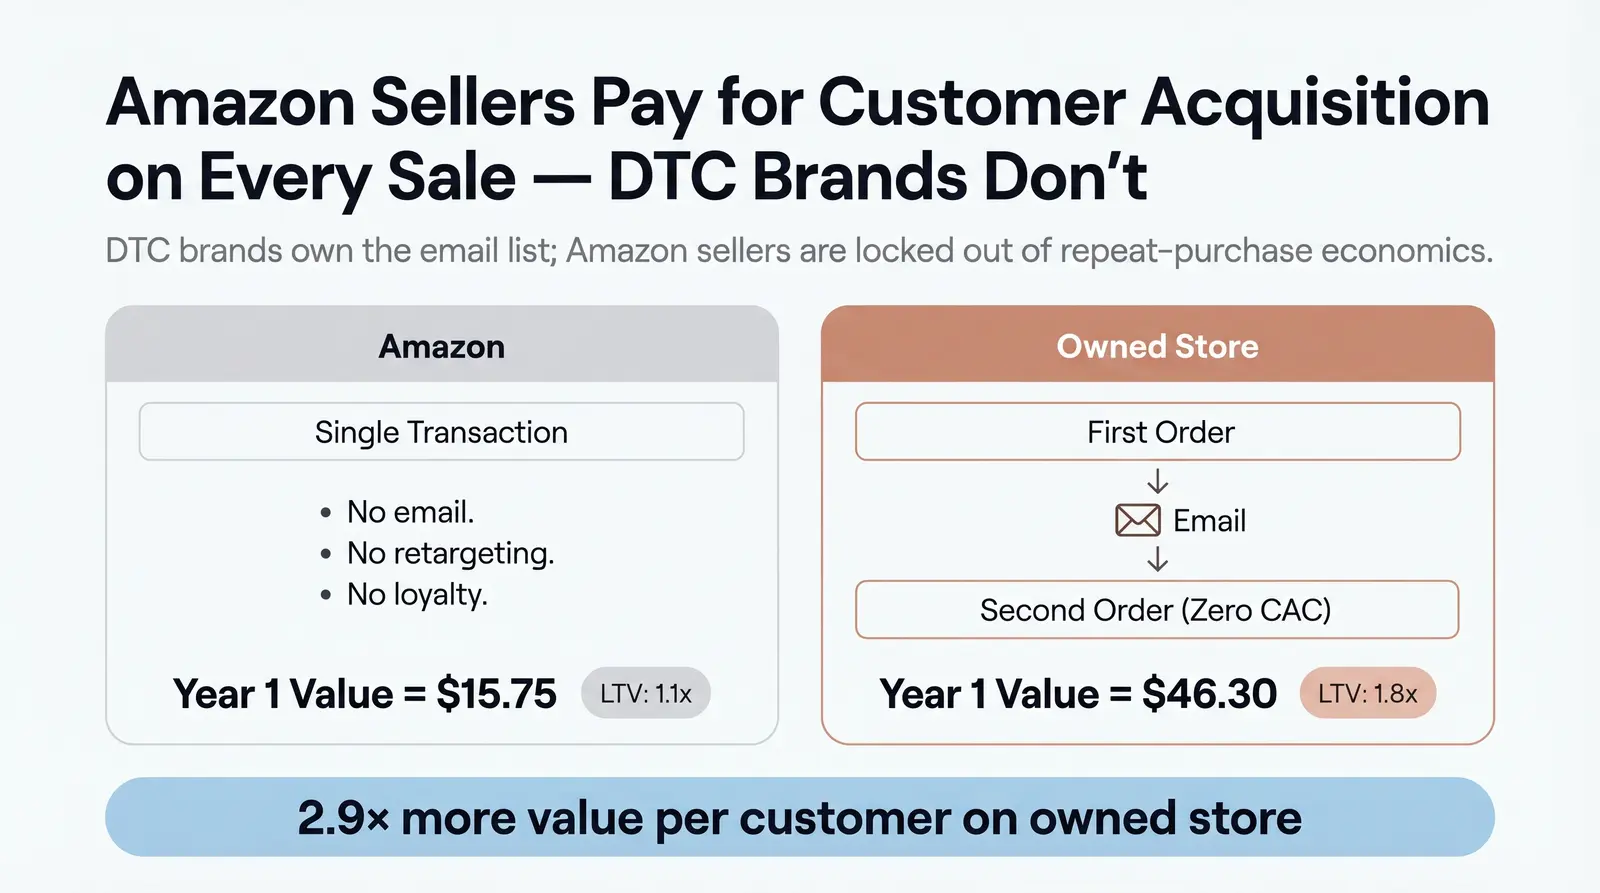
Amazon's scale advantage is real, but it compounds a customer acquisition cost (CAC) problem that never gets cheaper. On an owned store, every repeat customer becomes nearly free to acquire. On Amazon, they are a stranger every time. Data shows that returning customers generate 60% of DTC brand revenue, and these loyal shoppers convert at 60% to 70%, compared to just 5% to 20% for new prospects [3]. Amazon sellers, who cannot market directly to past buyers, miss out entirely on this compounding retention advantage.
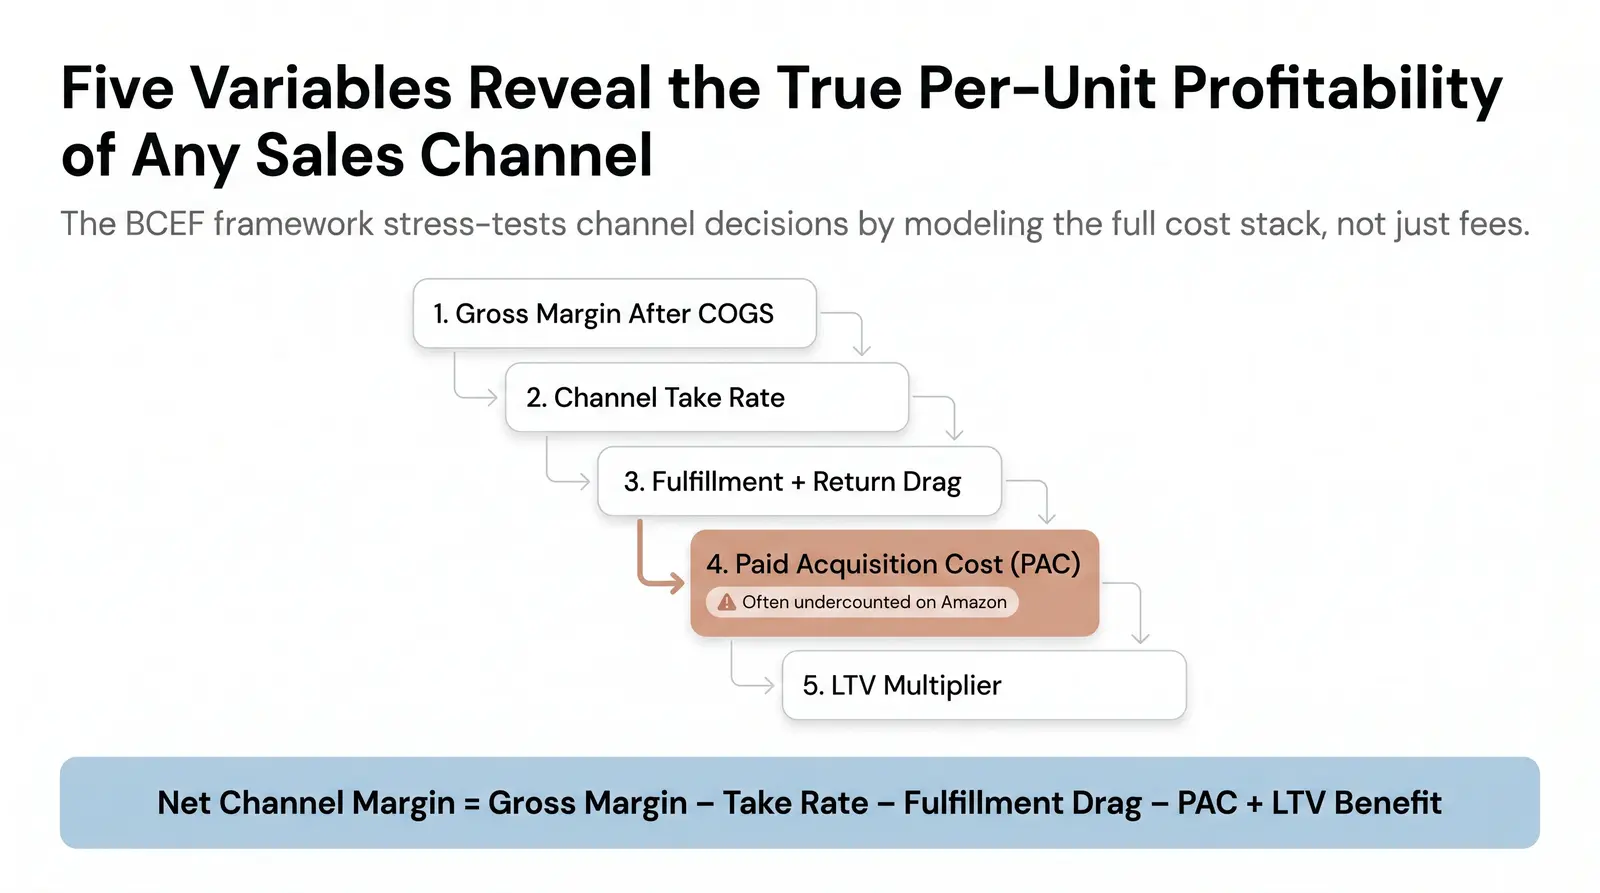
To evaluate true per-unit profitability across sales channels, we use the Branvas Channel Economics Framework (BCEF). This five-variable model helps brand founders stress-test channel decisions before launch, ensuring they understand the full cost stack.
The five variables are:
The formula is straightforward:
Net Channel Margin = Gross Margin − Channel Take Rate − Fulfillment + Return Drag − PAC + (LTV Multiplier Benefit)
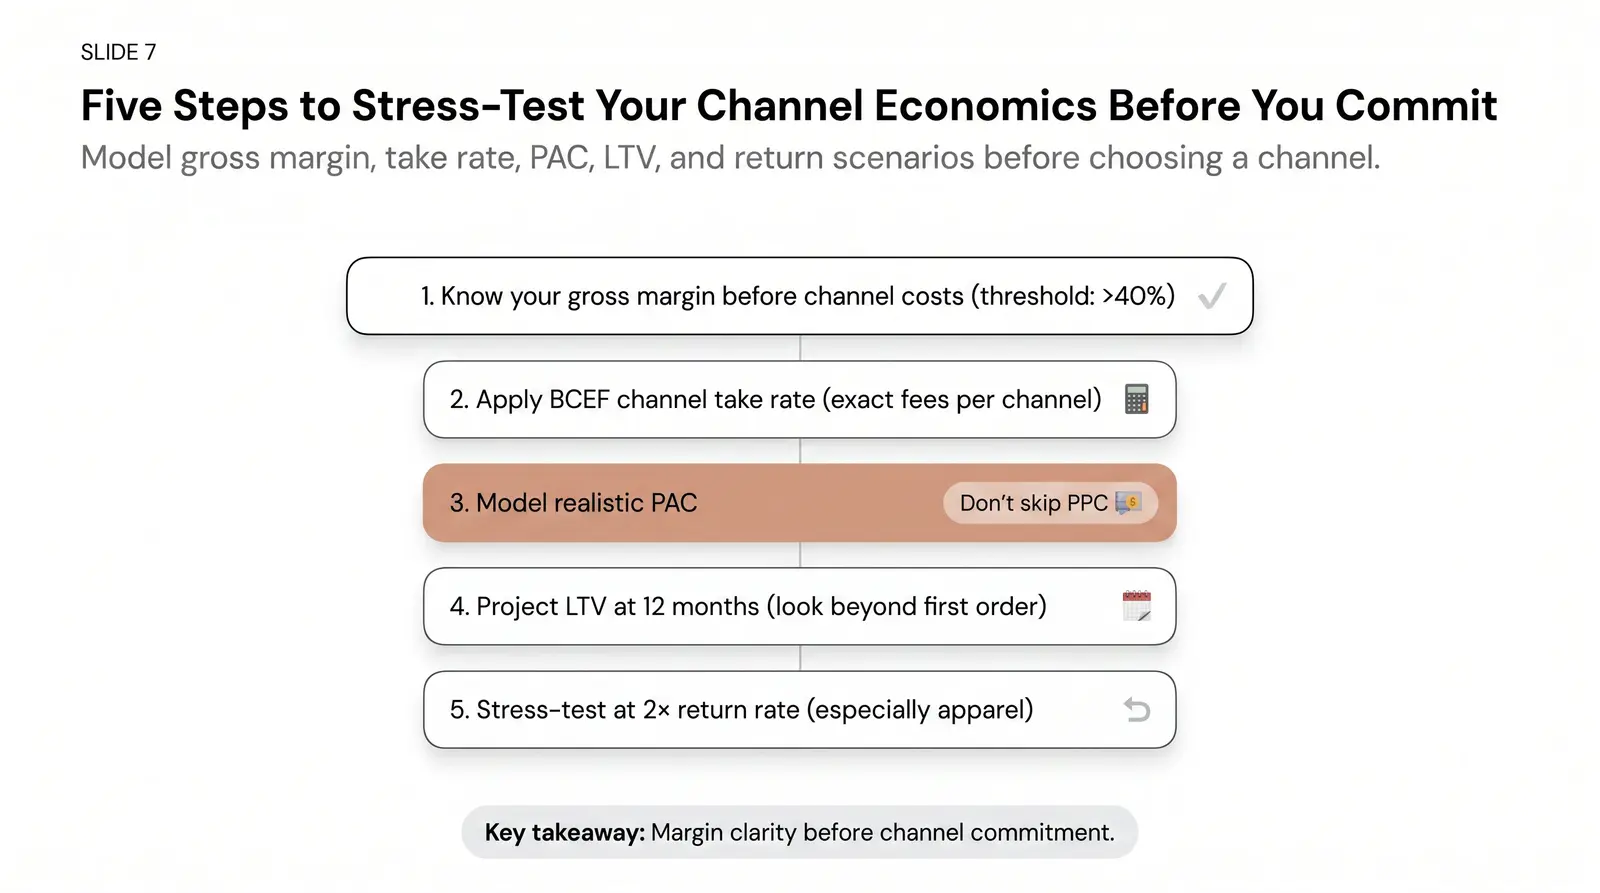
We often see founders struggle with step four. They undercount PAC on Amazon because PPC feels "optional." It isn't. Without it, most new ASINs are invisible.
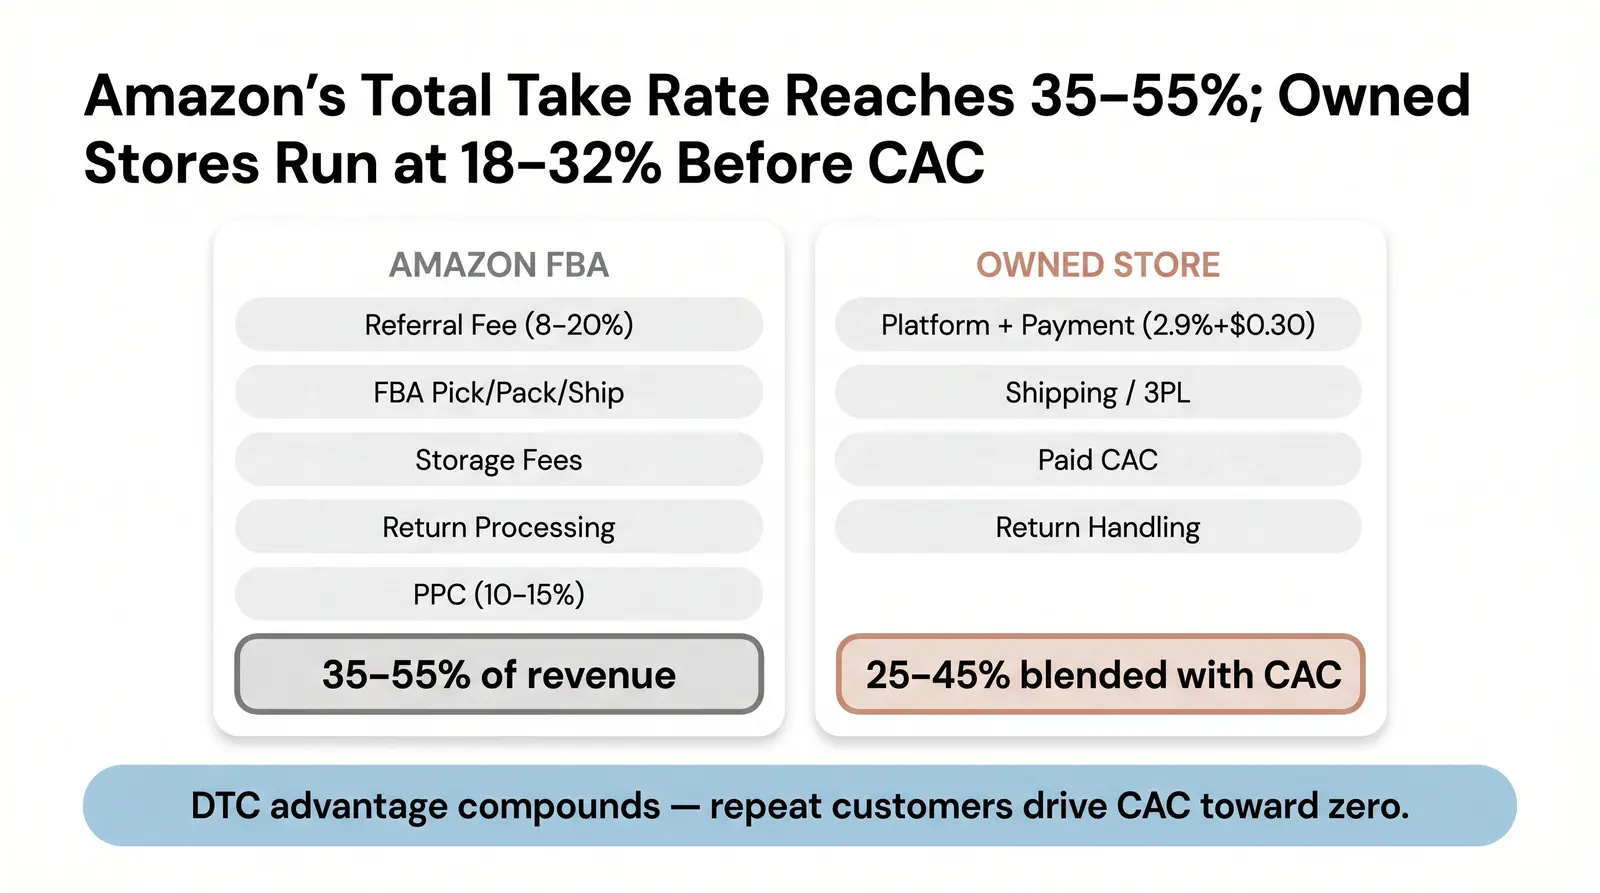
Comparing Amazon to an owned store requires looking past the top-line fees to understand the real cost layers each channel demands.
Amazon (FBA model):
Amazon's fee structure is comprehensive. Sellers pay a referral fee by category, which ranges from 8% for electronics to 20% for jewelry up to $250 [4]. Beyond this, sellers incur FBA pick, pack, and ship fees, monthly and long-term storage fees, and return processing fees. Furthermore, Amazon PPC advertising is effectively mandatory for visibility, often consuming 10% to 15% of revenue. The total typical take rate on Amazon ranges from 35% to 55% of revenue, depending on the category and ad spend [5].
Owned Store (Shopify + 3PL or self-fulfillment):
An owned store carries a different cost profile. Sellers pay a platform subscription fee and payment processing fees (typically 2.9% + $0.30). They must also cover shipping and fulfillment costs, paid social or email CAC, and return handling. The total typical take rate for an owned store ranges from 18% to 32% before CAC, and 25% to 45% when blended with CAC [6].
Key insight: The owned-store take rate looks competitive only when CAC is managed. The DTC advantage compounds over time because repeat customers drop the effective CAC toward zero — Amazon sellers never benefit from this dynamic.
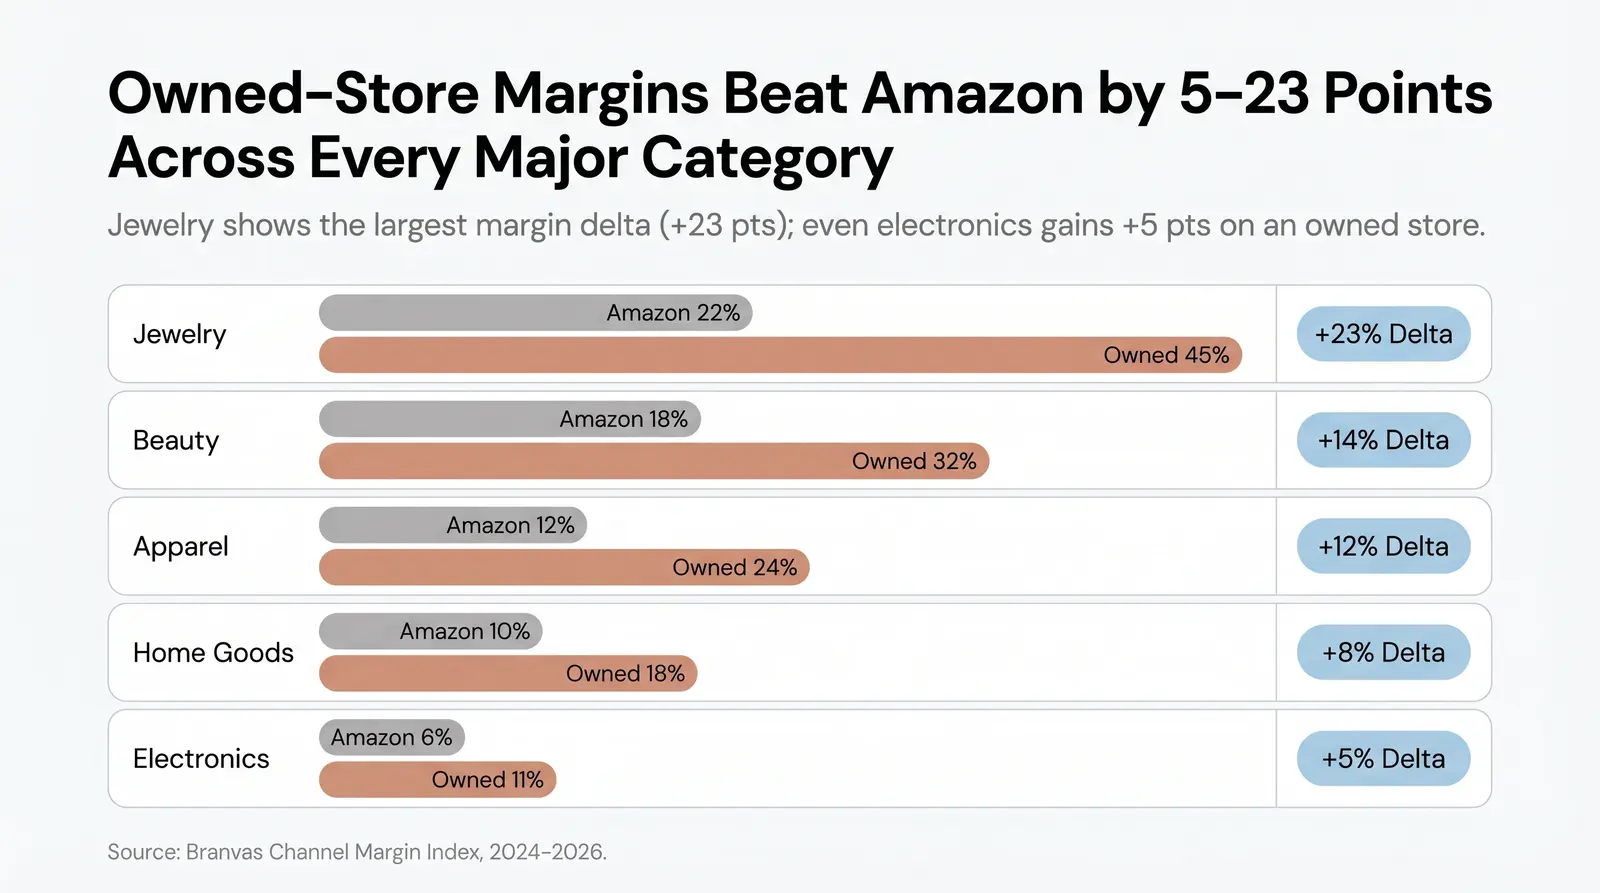
The table below illustrates the stark contrast in profitability between Amazon and owned-store channels across five major ecommerce categories.
| Category | Avg. Gross Margin | Amazon Net Margin | Owned-Store Net Margin | Margin Delta (Owned − Amazon) | Avg. AOV (Amazon vs. Owned) | Return Rate (Amazon vs. Owned) | 12-mo LTV (Amazon vs. Owned) |
|---|---|---|---|---|---|---|---|
| Jewelry (Branvas member data, anonymized aggregate, 2024) | 75% | 22% | 45% | +23% | $45 vs. $65 | 4% vs. 3% | 1.1x vs. 1.8x |
| Beauty & Personal Care [7] [8] | 65% | 18% | 32% | +14% | $25 vs. $45 | 6% vs. 5% | 1.2x vs. 2.1x |
| Apparel & Fashion [7] [9] | 55% | 12% | 24% | +12% | $35 vs. $85 | 28% vs. 25% | 1.1x vs. 1.6x |
| Home Goods [7] [10] | 45% | 10% | 18% | +8% | $40 vs. $95 | 15% vs. 12% | 1.0x vs. 1.3x |
| Consumer Electronics [7] [9] | 25% | 6% | 11% | +5% | $30 vs. $105 | 14% vs. 11% | 1.0x vs. 1.2x |
📥 Download the Branvas Channel Margin Index (CSV) — Click here to download the full data table (link placeholder)
Consider a jewelry brand selling a $45 necklace. We can compare Year 1 economics on Amazon FBA versus Shopify with a 3PL using the BCEF framework.
Assume the landed COGS is $9.00, yielding a gross margin of $36.00 (80%).
On Amazon, the brand pays a 20% referral fee ($9.00), an FBA fee of $3.50, and spends $6.75 on PPC (15% ACoS). After a $1.00 return drag, the net margin per first order is $15.75 (35%). Because Amazon owns the customer, the Year 1 repurchase rate is near zero. The total Year 1 net revenue per acquired customer remains $15.75.
On an owned store, the brand pays a 3% payment fee ($1.35), a $4.50 3PL fulfillment cost, and spends $12.00 on paid social CAC. After a $1.00 return drag, the net margin per first order is $17.15 (38%). However, the brand owns the email list. If the customer repurchases once in Year 1 via a free email campaign, the second order has zero CAC. The net margin on the second order is $29.15. The total Year 1 net revenue per acquired customer jumps to $46.30.
Customer LTV is structurally lower on Amazon because the marketplace owns the customer relationship. Sellers cannot email buyers, retarget them with pixel data, or build loyalty programs. Every sale on Amazon is essentially a first-time transaction, requiring the seller to pay for discovery over and over again.
In contrast, DTC brands own their email lists and can deploy repeat purchase flows, loyalty mechanics, and referral programs. This allows them to monetize the same customer repeatedly without paying Meta or Google for the privilege.
At Branvas, we track LTV cohorts for our jewelry brand members. The brands that build owned audiences — even small ones — consistently outperform their Amazon-only counterparts on a per-customer basis within 18 months.
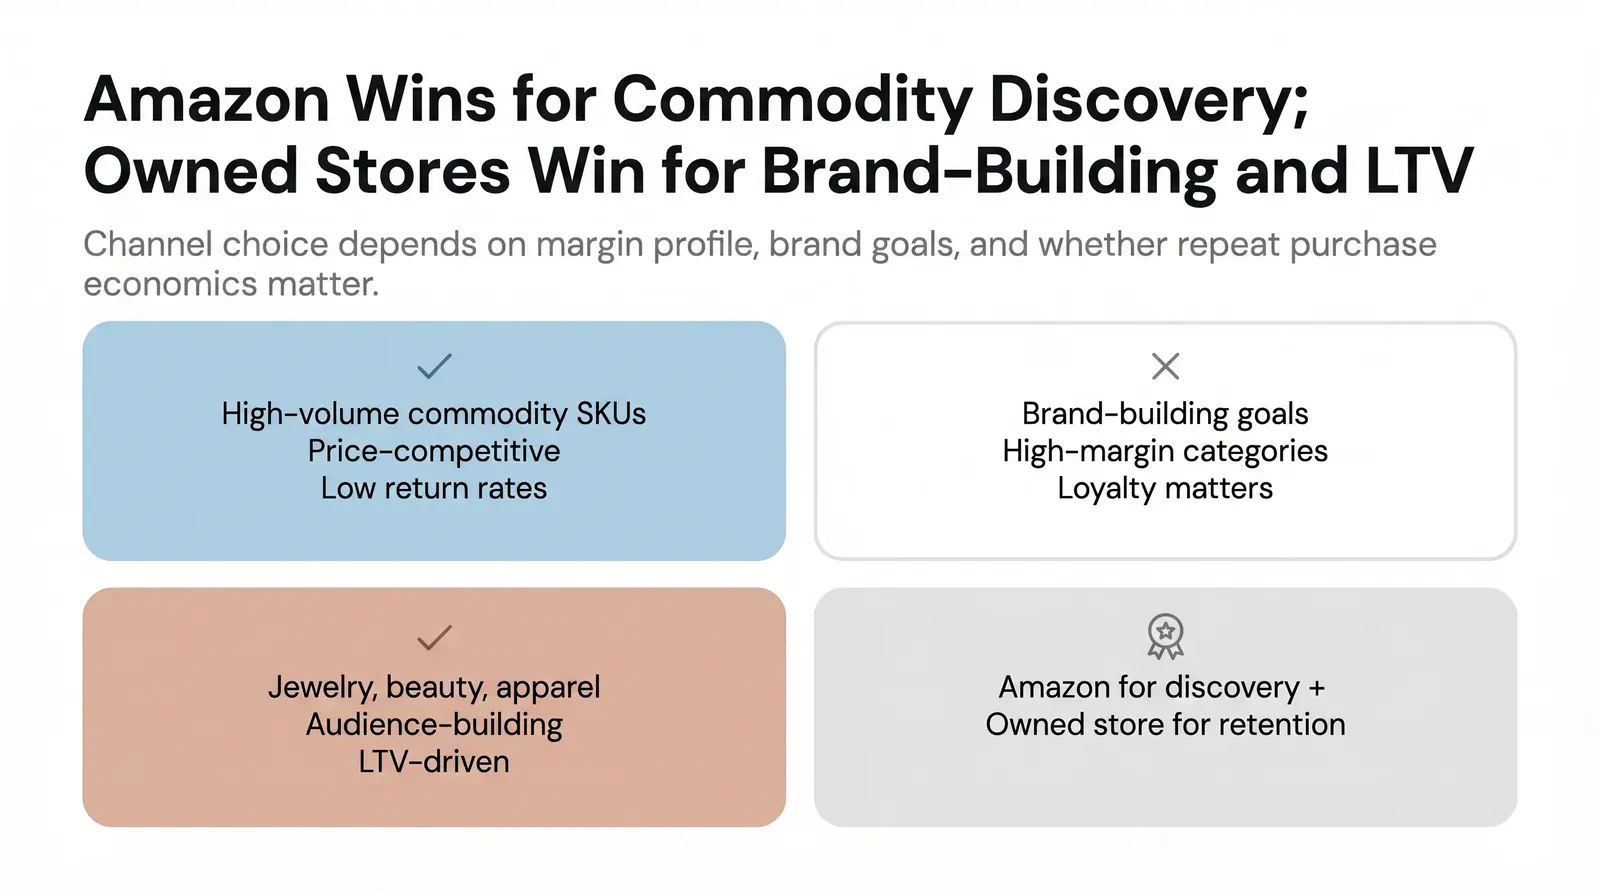
Amazon is not inherently bad; it is simply a specific tool for a specific job.
Amazon makes sense for high-volume commodity SKUs, price-competitive categories, and products with low return rates and high repeat purchase behavior that does not rely on brand loyalty. It is also an excellent discovery engine for new brands with no existing audience.
An owned store makes sense for higher-margin categories like jewelry, beauty, and apparel. It is the superior choice when brand-building is a primary goal, when repeat purchases and LTV matter, and when the seller has the ability to build an audience.
Many successful brands employ a hybrid model, using Amazon for top-of-funnel discovery and an owned store for retention and LTV capture.
If you're building a jewelry or accessories brand and want to model your own channel economics before choosing where to sell, Branvas's profit calculator can run the numbers for your specific AOV and volume in minutes.
Founders can use this data to make informed channel decisions by following a simple framework:
While 57% of Amazon sellers report profit margins above 10%, the average net margin after the full fee stack (referral, FBA, storage, and advertising) typically lands between 5% and 15%, depending heavily on the product category and advertising efficiency [11].
Yes. Shopify and DTC stores generally offer higher net margins than Amazon. While DTC brands face higher initial customer acquisition costs, they avoid Amazon's 15% referral fees and benefit from repeat purchases that carry near-zero acquisition costs, driving higher overall profitability.
Based on Branvas member data, a jewelry brand on Amazon typically sees a net margin of 18% to 28% after all fees and PPC. On an owned store, that same brand can achieve a net margin of 38% to 52% by leveraging higher average order values and strong customer retention.
DTC sellers own the customer data. They can build email lists, run loyalty programs, and execute retargeting campaigns to drive repeat purchases for free. Amazon sellers are prohibited from marketing directly to past buyers, meaning they must pay for customer acquisition on nearly every sale.
If you have a high-margin product and an existing audience, building your own store first allows you to capture higher margins and own your customer data. If you are selling a commodity product and have no audience, Amazon provides immediate access to buyers, though at a steep cost to your margins.
Across nearly every category studied, owned-store net margins and LTV-adjusted economics outperform Amazon — often by 15 to 25 margin points. While Amazon plays a valuable role in ecommerce, particularly for discovery and high-volume commodities, brands that build owned channels compound their advantage over time through customer retention and zero-CAC repeat purchases.
Ready to launch your own jewelry or accessories brand with owned-store economics from day one? Branvas handles sourcing, branding, packaging, and fulfillment — so you keep the margin, the customer, and the brand. See how it works →