



This month-by-month reference maps jewelry seasonal demand curves by category, revealing peak and trough timing for earrings, necklaces, rings, bracelets, and pins to optimize inventory and marketing.
Published:
October 5, 2026
Author:
Yi Cui
Stud earring sales peak in November and bottom in February. It is a simple fact, yet one that consistently catches new jewelry brand founders off guard. This guide serves as the reference resource built from observed demand patterns, intended to be bookmarked and cited by gift-guide writers, merchandisers, and jewelry brand founders. The core thesis is straightforward: jewelry seasonality is not monolithic. Demand curves differ dramatically by category, aesthetic, and gifting occasion, which means one-size-fits-all inventory planning leaves serious money on the table.
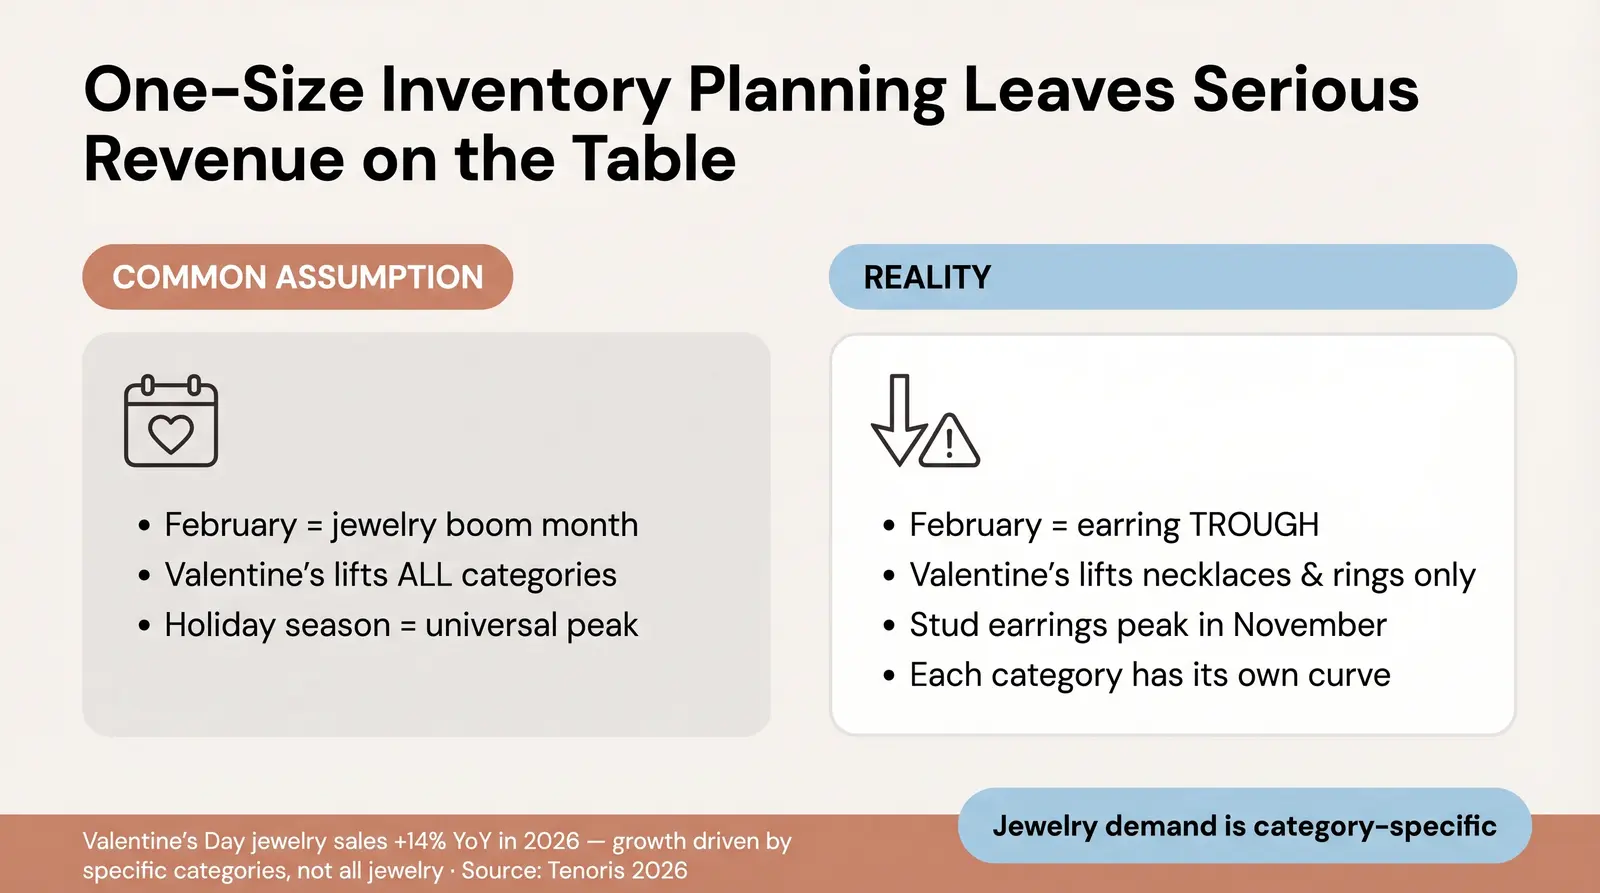
A common mistake among emerging jewelry sellers is treating all jewelry as a single, unified category and planning inventory around "the holidays." This approach assumes that if jewelry is selling well, all types of jewelry are selling well. The reality is far more complex.
February is commonly assumed to be a jewelry boom month because of Valentine's Day, but for earrings, February is actually a seasonal trough. Valentine's Day jewelry skews heavily toward necklaces and rings, which are traditionally viewed as romantic or intimate gifts. Earring demand, especially for stud earrings, peaks during the holiday gift-buying season in November and drops sharply in January and February when holiday gift-buying stops and self-purchase behavior has not yet kicked in. Recent data from Tenoris shows that while Valentine's Day jewelry sales jumped 14% year-over-year in 2026, the growth was driven primarily by higher-end spending on specific categories, not a rising tide that lifted all boats. [1]
To make sense of these divergent patterns, we rely on the Branvas Seasonal Demand Index (BSDI). This proprietary framework serves as the lens used to organize the data in this article, helping sellers move beyond intuition and into data-backed inventory planning. In our experience at Branvas, the sellers who outperform their peers aren't just stocking more. They're stocking the right categories at the right time. We consistently see brand founders get blindsided by February earring slowdowns they didn't anticipate.
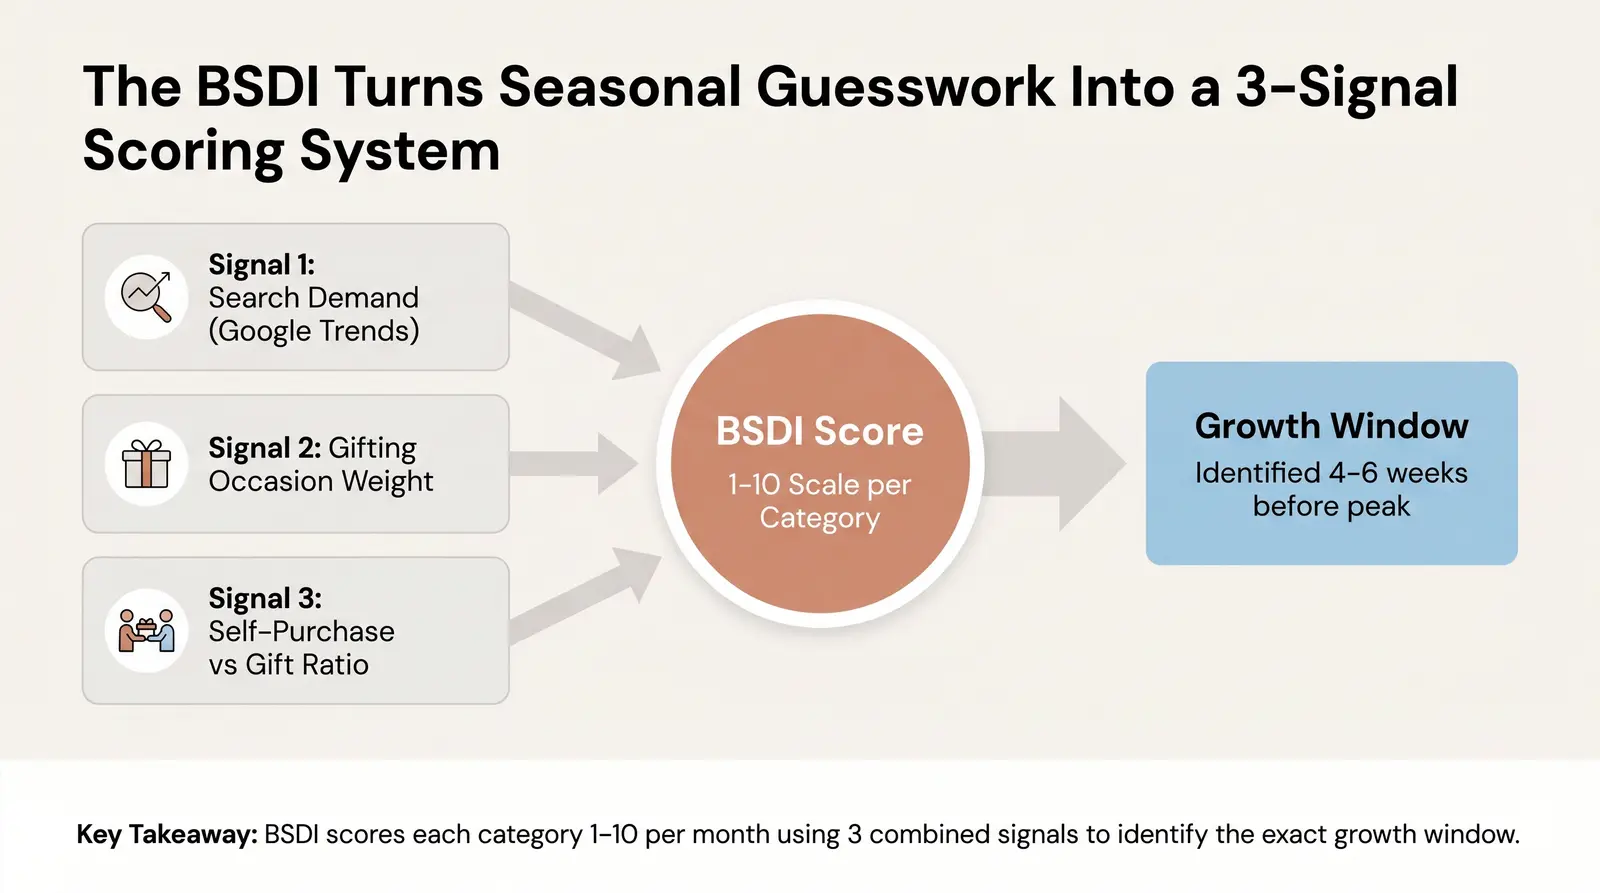
The Branvas Seasonal Demand Index (BSDI) is a relative scoring model that maps demand intensity for each jewelry category across 12 months on a normalized 1–10 scale, where 1 represents a seasonal trough and 10 represents peak demand. It combines three critical signals:
The BSDI allows brand founders to identify not just the peaks, but the crucial growth windows. These are the 4–6 week ramp-up periods before a peak, which is exactly when inventory and ad spend decisions must be made to capture the incoming wave of demand.
The Valentine's Window for Necklaces: A Branvas member launching a dainty initial necklace line in January would target a BSDI growth window of Dec 26–Jan 31, with peak demand expected the week of Feb 7–14. Running paid social starting Jan 15 and ensuring inventory landed by Feb 1 would align perfectly with the growth curve.
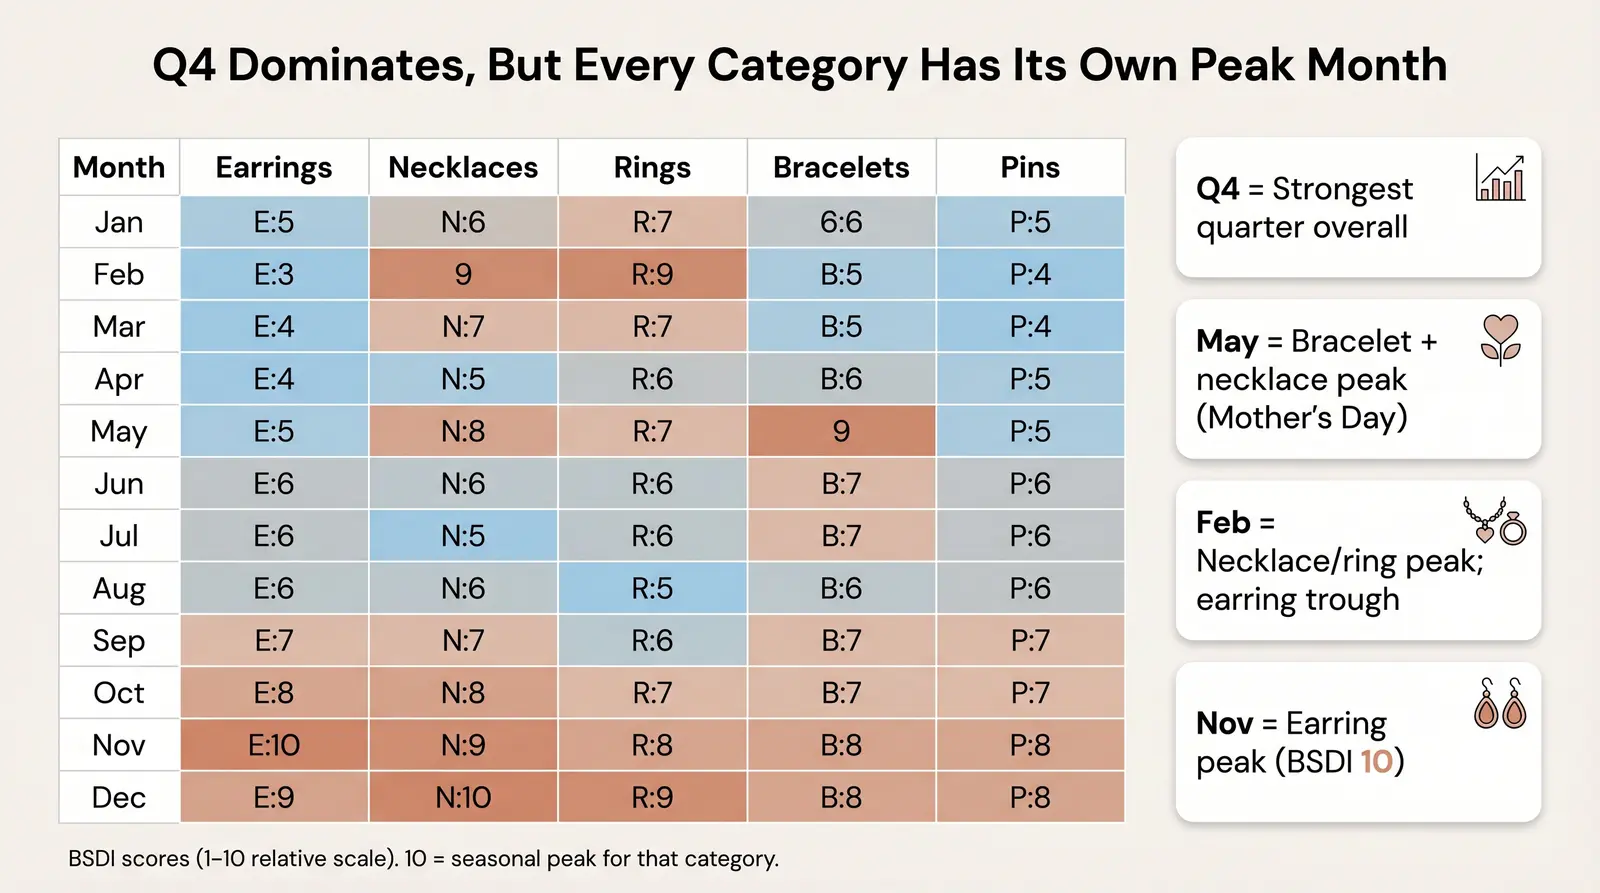
The full-year demand calendar reveals distinct seasonal rhythms across all jewelry categories. Q4 (October–December) remains the strongest quarter overall, where gift-buying dominates the landscape and drives peak revenue for most sellers. Q1 (January–March) presents a mixed picture. Valentine's Day lifts necklaces and rings significantly, but earrings experience a post-holiday trough. Self-purchase behavior begins recovering in late February.
Moving into Q2 (April–June), Mother's Day and Graduation drive demand for bracelets and necklaces. Rings see a secondary peak as engagement season ramps up. Q3 (July–September) is generally a softer period overall. However, back-to-school shopping creates a small earring uptick in August, and pins or enamel accessories see steady summer festival demand.
| Month | Earrings | Necklaces | Rings | Bracelets | Pins/Brooches | Key Demand Driver |
|---|---|---|---|---|---|---|
| Jan | 4 | 6 | 5 | 4 | 3 | Post-holiday; Valentine's ramp for necklaces |
| Feb | 3 | 9 | 8 | 5 | 3 | Valentine's Day (gifting peak) |
| Mar | 4 | 6 | 7 | 5 | 4 | Engagement season begins |
| Apr | 5 | 6 | 7 | 6 | 5 | Spring gifting, engagement |
| May | 7 | 8 | 7 | 9 | 6 | Mother's Day (bracelets + necklaces peak) |
| Jun | 6 | 7 | 8 | 7 | 6 | Graduation; engagement season peak |
| Jul | 5 | 5 | 5 | 5 | 7 | Festival/summer; pins uptick |
| Aug | 6 | 5 | 4 | 5 | 6 | Back-to-school earring uptick |
| Sep | 5 | 5 | 5 | 5 | 5 | Pre-holiday soft period |
| Oct | 7 | 7 | 6 | 6 | 7 | Holiday ramp begins |
| Nov | 10 | 9 | 8 | 9 | 8 | Black Friday/Cyber Monday; peak for most |
| Dec | 9 | 10 | 9 | 9 | 7 | Christmas gift-buying; necklaces peak |
Caption: BSDI scores (1–10 relative scale). 10 = seasonal peak for that category. Source: Branvas demand modeling based on aggregated search signal, gifting occasion weighting, and member sales patterns.
The earring category exhibits a clear split between stud earrings and statement pieces. Stud earrings are heavily gifting-driven and see their absolute peak in November as holiday shopping begins. During the 2021 holiday season, earring sales rose 65% year-over-year, with stud earrings accounting for 30% of all bestselling earring styles, according to sales data reported at the time. While market conditions have normalized since then, the fundamental seasonal pattern holds: earrings are a holiday gift category first.
Statement earrings are more occasion and event-driven. They often experience a secondary uptick during the summer wedding and festival season, particularly in June and July, when outdoor events and celebrations create demand for bold, expressive pieces. This makes statement earrings a useful counter-seasonal play for sellers who want to maintain momentum through the summer trough.
Valentine's Day is notably weak for earrings. The holiday skews toward necklaces and rings as romantic gifts, leaving earring demand flat or declining. Sellers who over-stock earrings for February will likely be sitting on excess inventory well into the spring. The primary growth window for earrings opens in mid-October and runs through Black Friday. The deepest trough occurs in January and February, making this a challenging time to launch new earring-heavy collections. The tactical move is to use January and February for product photography, content creation, and catalog updates so you are ready to capitalize on the October growth window.
Necklaces enjoy two distinct peaks throughout the year. The first arrives in December, driven by Christmas gifting. The second hits in February for Valentine's Day, as necklaces remain the most gifted jewelry category for this romantic holiday. NRF data shows that overall Valentine's Day jewelry spending is expected to reach $7 billion in 2026, with necklaces and pendants leading in unit volume. [4] Analysis from Pattern.com confirms that necklaces received the biggest Valentine's Day bump and also saw a 56% increase in demand during Mother's Day, making them the most consistently occasion-driven category in the entire jewelry market. [6]
Minimalist and dainty necklaces have a longer tail into the spring months, supported by self-purchase behavior and the "treat yourself" culture. Gen Z buyers, in particular, favor necklaces as their top self-purchase category, with 35% selecting them over rings and watches, according to BriteCo. [2] This creates a sustained demand signal that extends well beyond the traditional gifting peaks.
The growth window for the December peak begins in late November, just after Thanksgiving. For the Valentine's peak, the growth window opens in late December and early January. Google Trends data indicates that searches for Valentine's Day jewelry start increasing approximately three weeks before the holiday and peak 24 hours before February 14. This means your content and paid campaigns need to be live by late January to capture the full growth window. The category typically sees its trough during the slower summer months of July and August, making this a good time to test new colorways or pendant styles before the fall ramp-up.
Rings experience two primary peaks. June brings a surge driven by graduation gifting and the peak of engagement season. December brings the expected Christmas holiday rush. February also provides a strong secondary peak for fashion rings, fueled by both Valentine's self-gifting and romantic gifting.
Engagement season is a real and measurable phenomenon. According to WeddingWire data, approximately 40% of all marriage proposals take place between Thanksgiving and Valentine's Day, with December accounting for 16% of all annual proposals, compared to the typical 7–9% for other months. Christmas Day is the single most popular day to propose. [7] This creates a concentrated demand window for rings that runs from late November through mid-February, with a secondary surge in June around graduation and summer weddings.
The trough for rings typically lands in September and October, representing a pre-holiday soft spot. A crucial tactical note for brand founders is that stackable rings follow self-purchase curves much more closely than gifting curves. The BriteCo survey found that rings are the top self-purchase jewelry category overall, with 31% of Americans choosing them as their most meaningful self-purchase. [2] Planning inventory for stackable rings should align with self-purchase trends, particularly the late-winter and spring "treat yourself" period, rather than relying solely on traditional holiday spikes.
Bracelets see a dominant peak in May, driven almost entirely by Mother's Day. According to the NRF, jewelry leads Mother's Day spending at $7.5 billion in 2026, and charm bracelets rank among the top gifted pieces. [5] A secondary peak occurs in November and December during the broader holiday shopping season.
The growth window for bracelets opens in late April and runs through the second week of May. The category experiences troughs in January and February, as well as July and August. We often see Branvas members undersell Mother's Day because they start stocking bracelets in late April, a full two weeks after the growth window has already opened.
Pins and enamel brooches represent the most self-purchase-driven category in the jewelry space and are the least tied to traditional gifting occasions. Demand here is more event and culture-driven. Pride season in June, festival season in July and August, and holiday novelty pins in November and December all drive steady interest.
The global brooch market was valued at $3.8 billion in 2025 and is projected to reach $7.1 billion by 2034, growing at a compound annual growth rate of 7.2%. This growth is driven by the category's identity and self-expression positioning, which resonates particularly strongly with younger consumers who use accessories to signal community membership and personal values.
This category is the most consistent year-round, characterized by lower highs but higher lows than other jewelry types. The trough typically occurs from January through March. The strategic opportunity for sellers is to counter-program with pins in February, when gifting categories are dominating the competitive focus and ad costs for romantic keywords are at their highest. A pins campaign in February can capture self-purchase buyers who are actively browsing but not finding relevant content in a sea of heart-shaped pendants and romantic messaging.

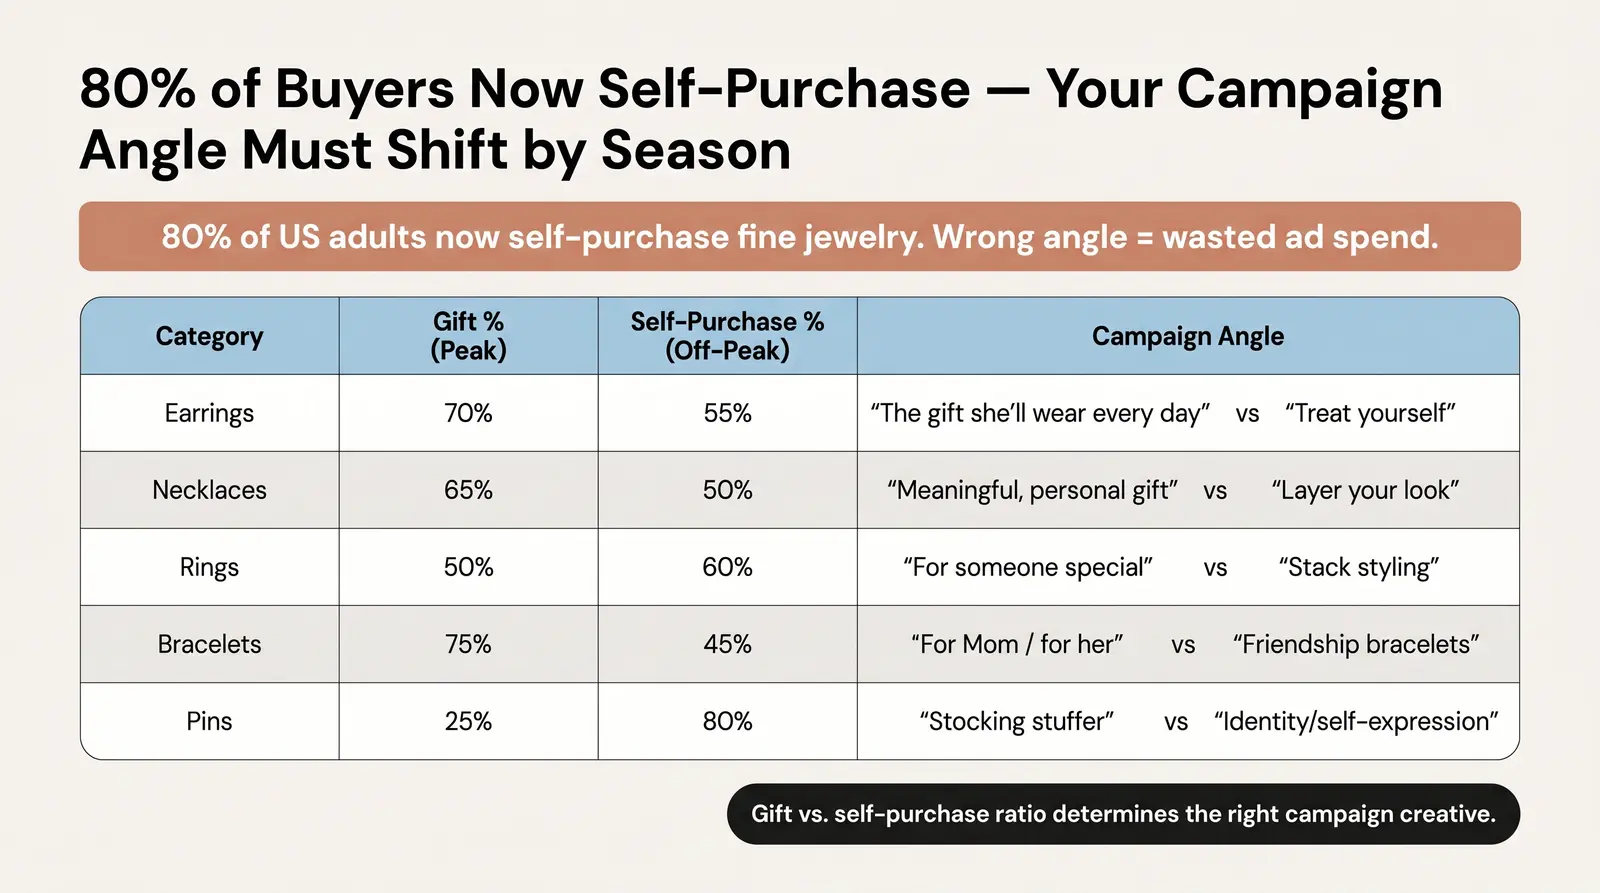
The gift-purchase versus self-purchase composition of demand fundamentally changes how sellers should time campaigns and messaging. A recent BriteCo survey found that 80% of American adults now purchase fine jewelry for themselves rather than waiting to receive it as a gift [2]. This shift means that relying solely on traditional gifting holidays leaves a massive portion of the market untapped.
Understanding this ratio by category allows brands to adjust their campaign creative and copy angles based on the dominant purchase motive for the season.
| Category | Est. Gift Purchase % (peak season) | Est. Self-Purchase % (off-peak) | Campaign Angle at Peak | Campaign Angle in Trough |
|---|---|---|---|---|
| Earrings | 70% | 55% | "The gift she'll wear every day" | "Treat yourself" / new arrivals |
| Necklaces | 65% | 50% | "Meaningful, personal gift" | "Layer your look" / self-expression |
| Rings | 50% | 60% | "For someone special" / "She'll love this" | Stack styling content, self-gifting |
| Bracelets | 75% | 45% | "For Mom / for her" | Friendship bracelets, self-stack |
| Pins | 25% | 80% | Holiday novelty, stocking stuffer | Identity/self-expression |
Caption: Estimated ratios based on gifting occasion proximity and category purchase behavior patterns. Adjust campaign creative and copy angle based on the dominant purchase motive for the season.
The BSDI curves are only valuable if they translate into actionable business decisions. The following five steps are how jewelry brand founders can implement these demand curves in practice.
Inventory timing is the most critical lever. Work backward 8–12 weeks from the peak. Production and sourcing lead times mean that if you wait until the growth window opens to order inventory, you are already too late. For the November earring peak, that means placing orders by late August. For the May bracelet peak, orders should be placed in February.
Ad spend ramp-up should begin in the growth window, not at the peak. The weeks leading up to a holiday are when consumers are actively researching and adding items to carts. Waiting until the final week before Valentine's Day to launch campaigns means competing at the highest CPM point with the least runway to optimize.
Content calendar alignment requires planning gift guides, lookbooks, and user-generated content campaigns to land 2–3 weeks before the peak. This builds awareness right as the growth window accelerates. A gift guide published on November 1 will have time to rank organically and generate backlinks before the Black Friday rush.
Category rotation during off-peak periods is an underused strategy. Use slower months for new launches and product testing. Lower competition means your learning budget goes further, and you can gather real conversion data before the high-stakes holiday season. Launching a new ring style in September gives you six weeks of data before the November peak.
Bundle strategy can shift demand curves by combining a high-season and low-season category to move slower inventory. A necklace and earring gift set, for example, pulls earring demand forward into the Valentine's window. A bracelet and ring stack bundle extends bracelet demand beyond Mother's Day into the summer months.
The table below summarizes the key timing decisions for each category.
| Category | Order Inventory By | Launch Campaigns By | Peak Month | Trough Month |
|---|---|---|---|---|
| Earrings | Late August | Mid-October | November | February |
| Necklaces (Holiday) | Mid-September | Late November | December | July |
| Necklaces (Valentine's) | Early November | Late December | February | August |
| Rings | Late September | Late November | December/June | September |
| Bracelets | Mid-February | Late April | May | January |
| Pins/Brooches | Year-round | 2 weeks before event | November | January |
Caption: Recommended timing framework based on BSDI growth windows and standard 8–12 week sourcing lead times. Adjust based on your specific supplier lead times.
If you're building a jewelry brand and want to align your product catalog with these demand windows, Branvas's catalog and sourcing system is designed to give you flexibility to rotate SKUs seasonally without minimum order headaches.

Q: When do jewelry sales peak each year?
A: Jewelry sales peak significantly during the Q4 holiday season, specifically in November and December. The National Retail Federation expects holiday sales to surpass $1 trillion, with jewelry consistently performing as a top gift category [3]. Secondary peaks occur around Valentine's Day and Mother's Day.
Q: What is the best-selling jewelry category for Valentine's Day?
A: Necklaces and rings are the best-selling categories for Valentine's Day, as they are traditionally viewed as romantic and intimate gifts. While overall jewelry spending for Valentine's Day is expected to reach $7 billion in 2026, earring sales typically experience a seasonal trough during this period [4].
Q: When should I start stocking inventory for the holiday jewelry season?
A: You should begin stocking inventory for the holiday season in late September or early October. The growth window for holiday jewelry demand opens in mid-October, and having inventory ready ensures you can capture early shoppers and avoid supply chain delays during the peak November rush.
Q: Does jewelry sell well in summer?
A: Summer is generally a softer period for overall jewelry sales, but specific categories perform well. Statement earrings see an uptick due to wedding and festival season, while pins and enamel brooches experience steady demand driven by self-purchase and cultural events.
Q: What jewelry category has the most consistent year-round demand?
A: Pins and enamel brooches have the most consistent year-round demand. This category is heavily driven by self-purchase and self-expression rather than traditional gifting occasions, resulting in lower peak spikes but higher off-peak baseline sales compared to rings or necklaces.
[1] Valentine’s Day Jewelry Sales Jump 14% as Higher-End Spending Drives Market Growth — Tenoris, 2026
[2] 80% of Americans Now Buy Fine Jewelry for Themselves Instead of Waiting for a Gift, New BriteCo Survey Finds — BriteCo, 2025
[3] NRF Expects Holiday Sales to Surpass $1 Trillion for the First Time — National Retail Federation, 2025
[4] Valentine's Day Spending Expected to Reach New Records — National Retail Federation, 2026
[5] Mother's Day Spending Expected to Hit Record $38 Billion — National Retail Federation, 2026
[6] Analysis: The Market Patterns of Jewelry Demand — Pattern.com
[7] WeddingWire 2018 Newlywed Report: Engagement Season Proposal Data — WeddingWire / David Douglas Diamonds, 2018
Jewelry seasonality is not a monolith. It is highly category-specific, and the sellers who plan their inventory and marketing around real demand curves, rather than intuition, consistently outperform the market. Understanding that stud earrings peak in November while charm bracelets peak in May allows founders to allocate capital efficiently and maximize revenue year-round.
Branvas provides the infrastructure that makes this strategic approach possible. Fast sourcing, a flexible catalog, private-label branding, and blind fulfillment mean founders can rotate product lines seasonally without the capital risk of traditional wholesale. You can stock what the data says will sell, exactly when it will sell.
Ready to build a jewelry brand timed to actual demand? See how Branvas works →
New to building a jewelry brand? Start with The Branvas Academy for guides on catalog planning, trend timing, and launch strategy.


