



Jewelry ecommerce benchmarks for conversion rate, AOV, returns, repeat purchases, and LTV:CAC with a proprietary scoring framework to diagnose store performance.
Published:
August 6, 2026
Author:
Yi Cui
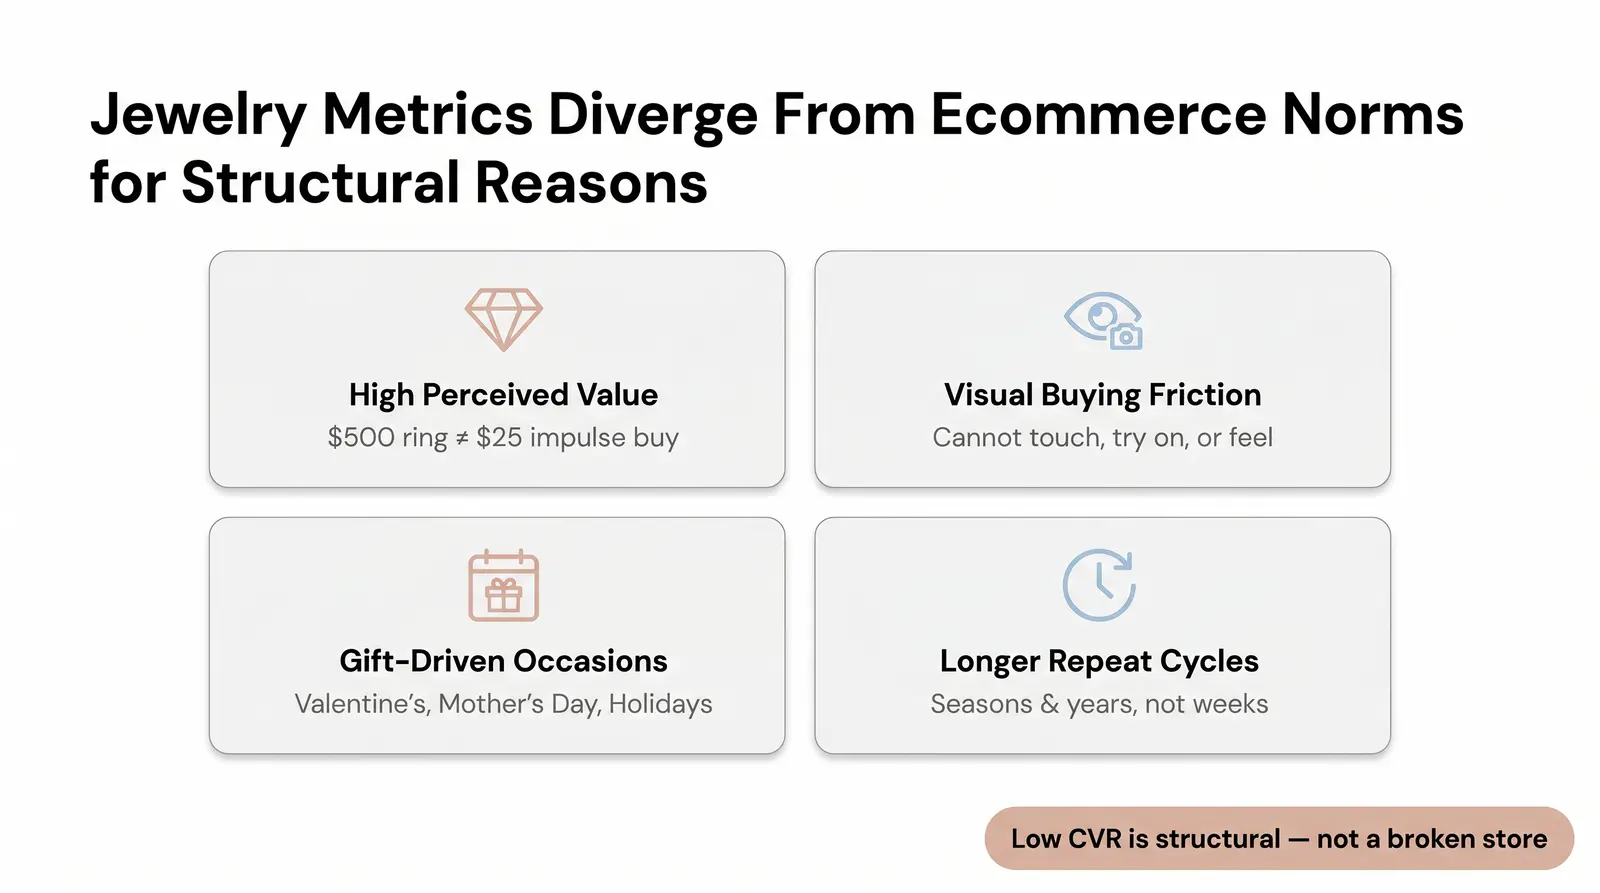
Jewelry ecommerce benchmarks are easy to misread because jewelry has high perceived value, visual buying friction, gift-driven seasonality, and longer repeat cycles than consumables. The useful benchmark is not one metric. It is the whole unit-economics picture.
A jewelry founder who sees a 1.0% conversion rate and compares it to a general ecommerce average of 2-4% will conclude their store is broken. It probably isn't. A founder who sees a 12-month repeat purchase rate of 14% and benchmarks it against a beauty brand's 35% will conclude their retention is failing. It probably isn't that either.
This article gives you the real benchmarks, explains the structural reasons behind each one, and gives you a framework to diagnose your own store's performance with precision.
When you see that the average ecommerce conversion rate is 2-4%, that number is technically accurate. It is also completely meaningless for a jewelry operator.
A $25 sauce is an impulse buy. A $500 pendant is a considered purchase. Customers research, compare, sleep on it, and often visit a product page three to five times before converting. That extended decision cycle is not a failure of the store. It is the structural reality of selling high-perceived-value products online.
Several forces push jewelry metrics away from general ecommerce norms.
High perceived value means customers are making financial decisions, not impulse decisions. The higher the price point, the more friction exists between intent and purchase. A customer buying a $2,500 engagement ring online is doing research that a customer buying a $30 candle never does.
Visual buying friction is unique to jewelry. Customers cannot try on a ring, feel the weight of a necklace, or see how a stone catches the light. Every product page is fighting against the inherent uncertainty of buying something tactile through a screen. This is why photography, video, and trust signals matter more in jewelry than in almost any other category.
Gift-driven purchase occasions create a seasonal pattern that is unlike consumables. Valentine's Day, Mother's Day, anniversaries, graduations, and the holiday season drive the majority of jewelry purchases. This means demand is concentrated, not steady, and the repurchase cycle is tied to the calendar, not to when a product runs out.
Longer repeat purchase cycles are a natural consequence of the product category. A customer who buys a ring does not need another ring next month. The repeat purchase window for jewelry is measured in seasons and years, not weeks.
Here is a non-obvious insight: a repeat purchase rate that looks "low" in a 90-day window for a jewelry brand may actually signal a healthy, high-AOV, low-returns business, not a retention failure. The math is simple. A customer who buys once at $280 AOV and never returns has still delivered more revenue per acquisition dollar than a customer who buys four times at $35 AOV in apparel, assuming similar CAC. We often see founders at Branvas benchmark themselves against general ecommerce averages and conclude their repeat rate is broken, when in fact their LTV math is perfectly sound once AOV is factored in.
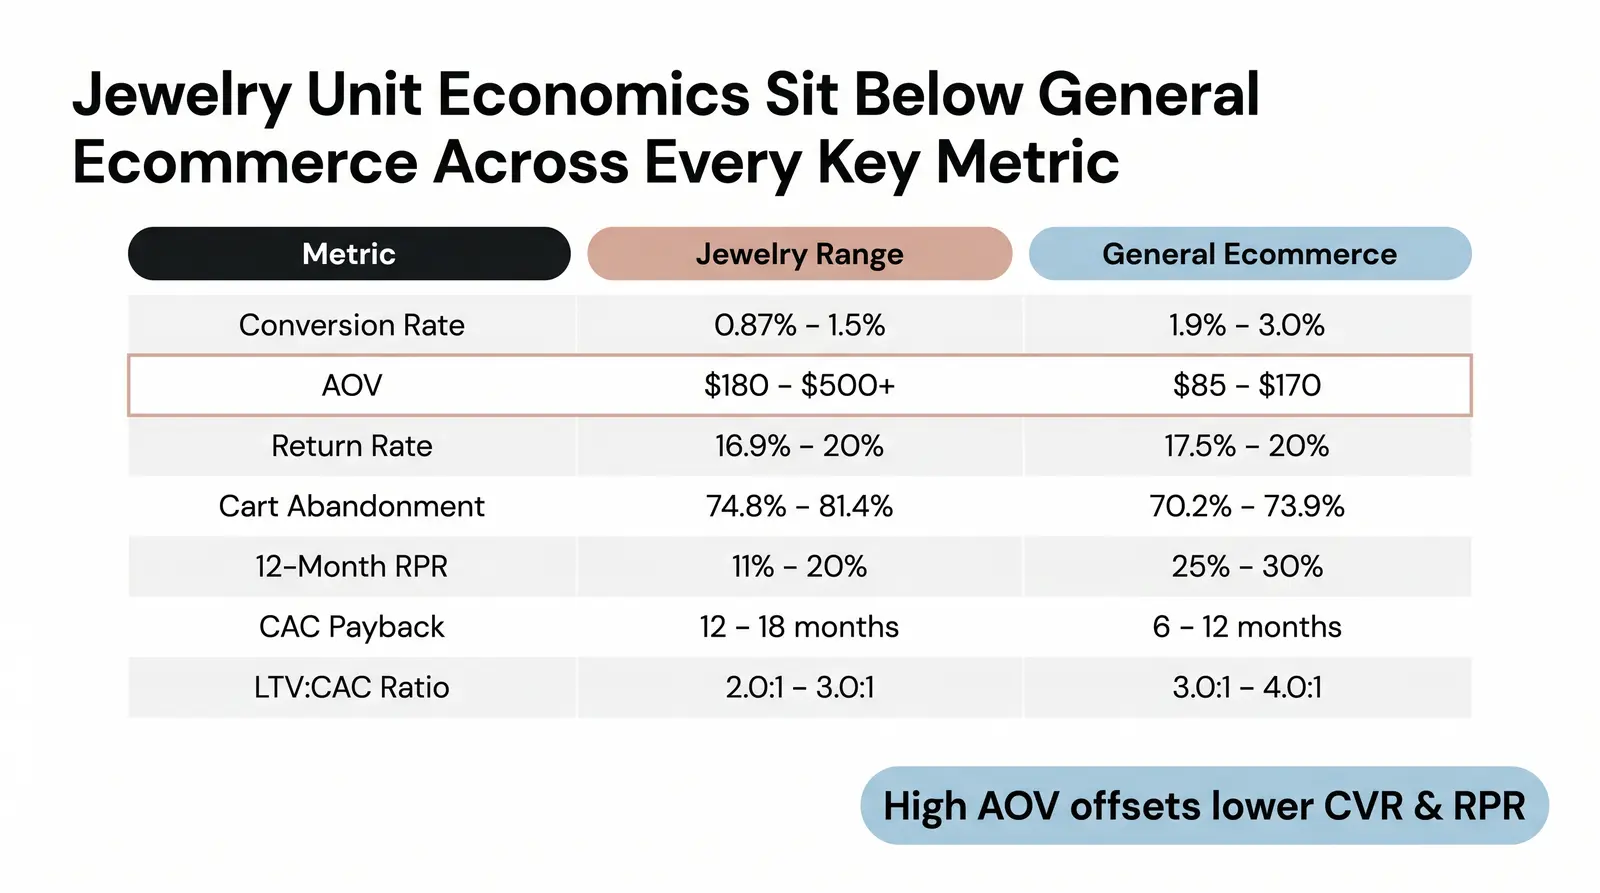
This is the core section. The table below is built from 2025-2026 industry data across multiple sources, including Dynamic Yield's live benchmark platform, WisePIM's jewelry industry report, Eightx's jewelry financial benchmark, BS&Co's repeat purchase rate study, and Branvas's own operator data. [1] [2] [5] [9] [10]
| Metric | Jewelry Benchmark Range | General Ecommerce Benchmark | Notes |
|---|---|---|---|
| Conversion Rate (overall) | 0.87% – 1.5% | 1.9% – 3.0% | Lowest of any tracked retail category. A rate above 1.5% is high-performing for jewelry. [1] [2] |
| Mobile Conversion Rate | 0.8% – 1.6% | 1.8% – 2.85% | Mobile browse and desktop checkout is a common pattern in fine jewelry. [3] [4] |
| Average Order Value (AOV) | $180 – $500+ | $85 – $170 | Fashion jewelry sits at $40-$85; fine jewelry clears $500 easily. High AOV is the economic engine. [5] |
| Return Rate | 16.9% – 20% | 17.5% – 20% | Sizing drives most returns. Fine jewelry with good tools can achieve below 15%. [6] |
| Cart Abandonment Rate | 74.8% – 81.4% | 70.19% – 73.9% | Highest of any category. Trust friction and high price points are the primary causes. [7] [8] |
| Repeat Purchase Rate (90-day) | 5% – 10% | 15% – 20% | Too short a window for fine jewelry. Most gifting-driven repeat purchases happen at 6-18 months. [9] |
| Repeat Purchase Rate (12-month) | 11% – 20% | 25% – 30% | Structurally lower than consumables, but healthy given high AOV. [9] |
| Customer Retention Rate | 15% – 22% | 25% – 35% | Jewelry relies on gifting occasion targeting rather than replenishment-based retention. [9] |
| CAC Payback Period | 12 – 18 months | 6 – 12 months | High CAC ($120-$180) and low purchase frequency extend payback. Acceptable if LTV is strong. [10] |
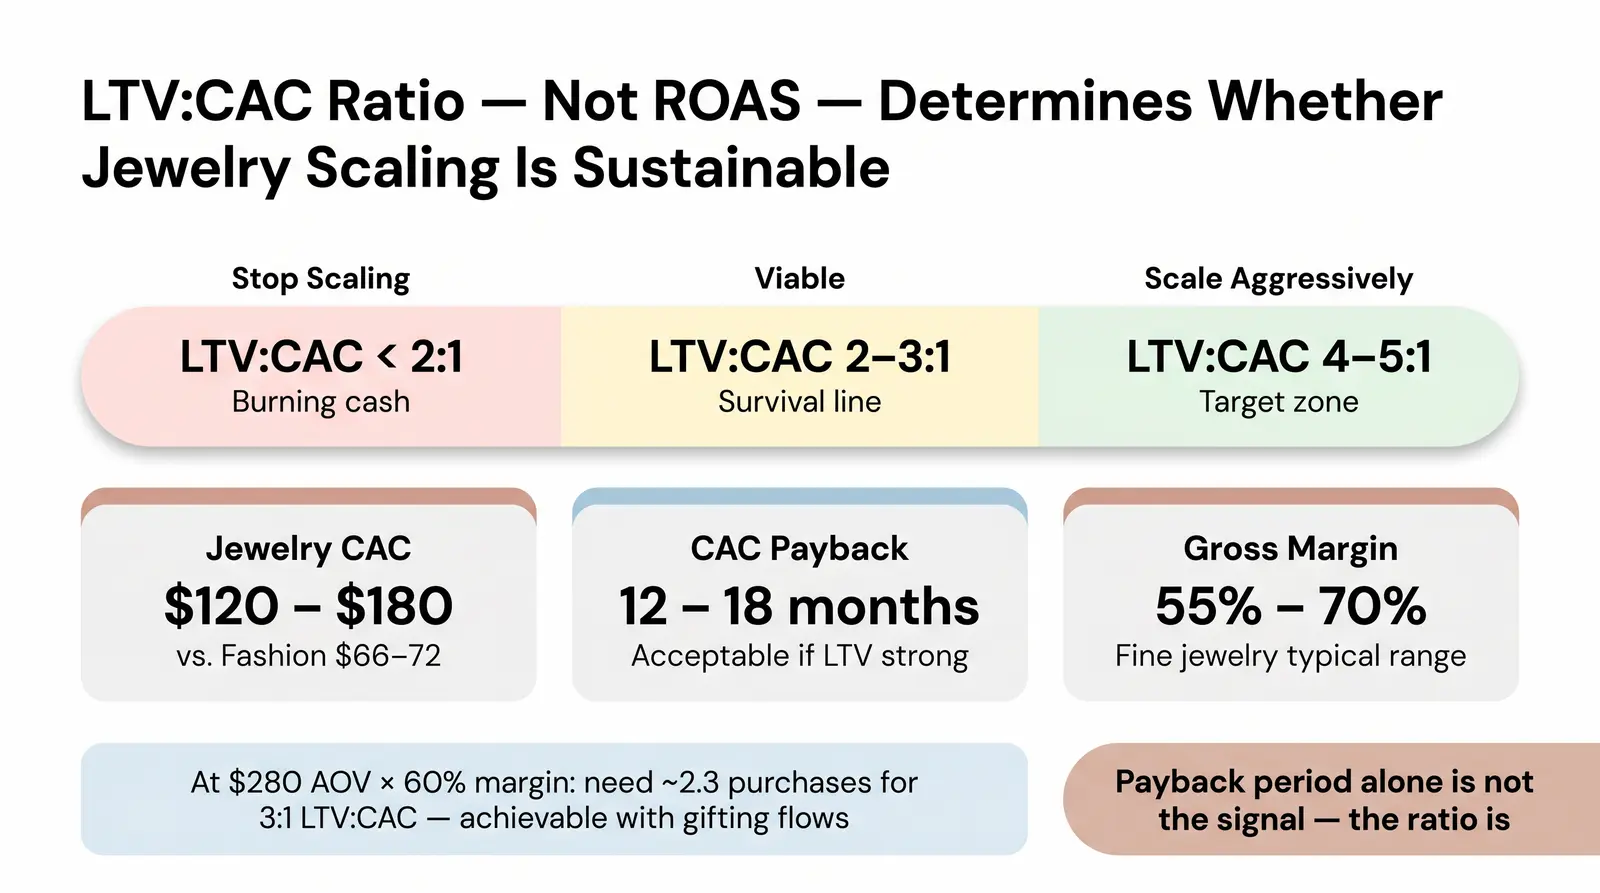
| LTV:CAC Ratio | 2.0:1 – 3.0:1 | 3.0:1 – 4.0:1 | 3:1 on margin dollars is the survival line. 4:1 to 5:1 is the target for healthy scaling. [10] |
Reading each metric:
Conversion Rate. A number below 0.87% is a signal to investigate trust signals, product photography, and mobile checkout friction. A number above 1.5% means your store is in the top tier of jewelry ecommerce and the lever to pull is AOV, not conversion.
AOV. If your AOV is below $120 and you sell fine jewelry, you have a merchandising problem. You are carrying fine-jewelry cost structure on fashion-jewelry economics, and the unit economics will not close. [5]
Return Rate. A rate above 20% in jewelry is almost always a sizing or expectations problem. Invest in ring sizing guides, lifestyle photography showing scale, and detailed material descriptions before treating it as a product quality issue.
Cart Abandonment. An 81% abandonment rate sounds catastrophic. In jewelry, it is the baseline. The question is not how to eliminate abandonment. It is how to recover it with abandoned cart flows and retargeting.
Repeat Purchase Rate. A 12-month rate below 10% is a signal to investigate your post-purchase flows. A rate above 15% means your gifting moment targeting is working.
LTV:CAC. If your ratio is below 2:1, stop scaling ad spend. Fix AOV and retention first.
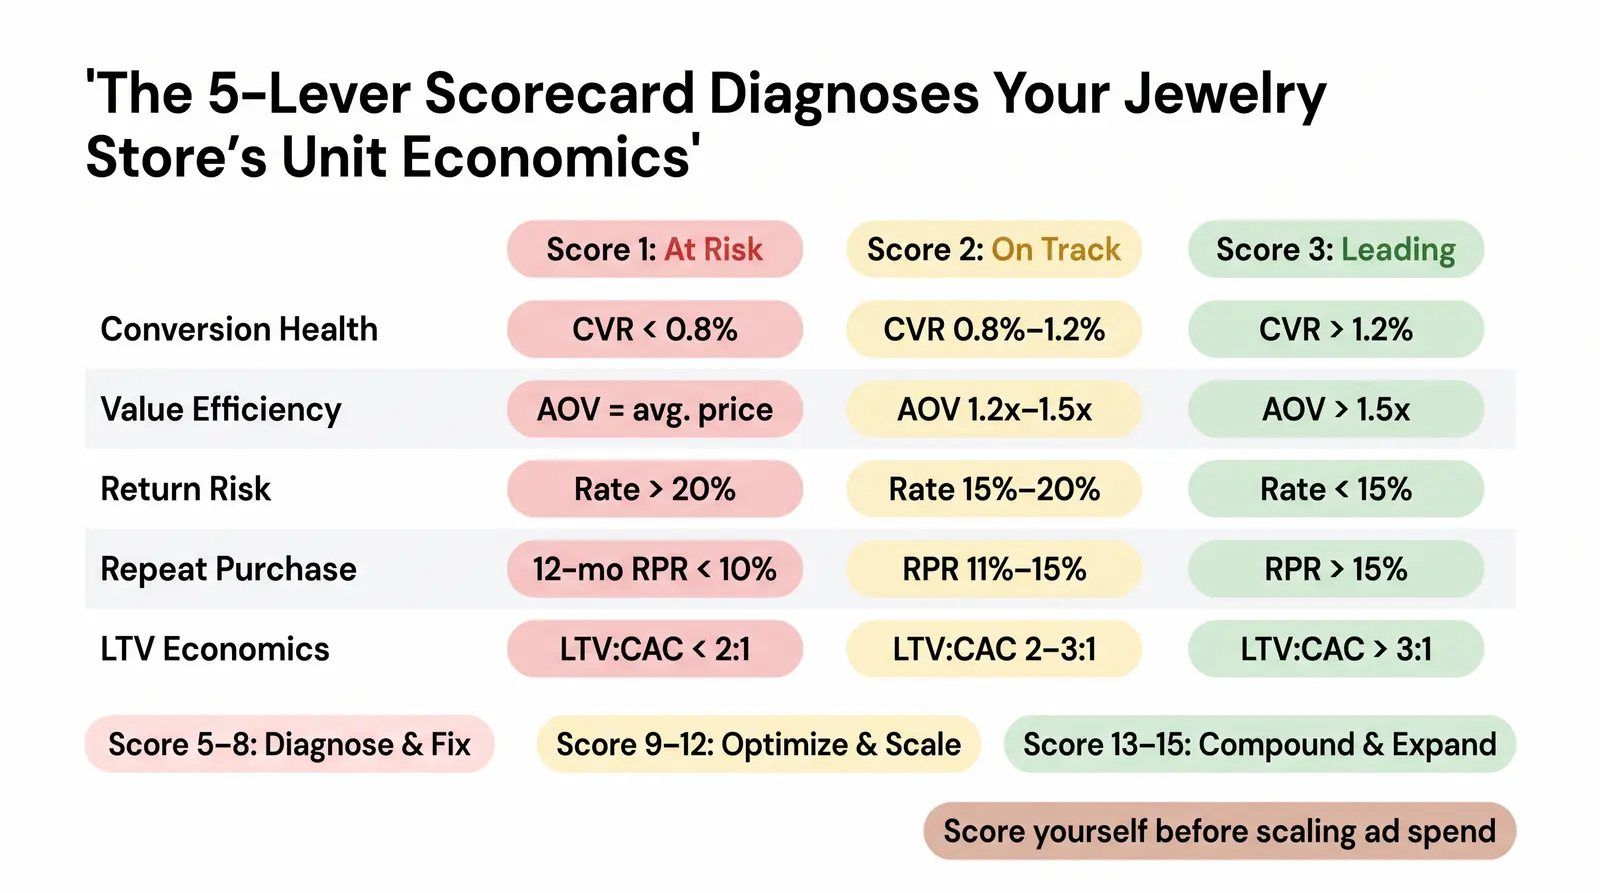
At Branvas, we walk new brand partners through the Branvas Jewelry Performance Scorecard (BJPS) in their first 90 days to establish a baseline before recommending any product or marketing changes. It is a simple, operator-facing scoring rubric that lets a jewelry founder rate their store across the 5 most important unit-economics levers on a 1–3 scale.
Scoring: 1 = At Risk, 2 = On Track, 3 = Leading
| Score | What It Looks Like |
|---|---|
| 1 (At Risk) | Overall CVR below 0.8%. Mobile CVR below 0.5%. Likely missing trust signals, poor photography, or a broken mobile checkout. |
| 2 (On Track) | Overall CVR 0.8% – 1.2%. Mobile CVR 0.6% – 1.0%. Functional but with clear room to improve. |
| 3 (Leading) | Overall CVR above 1.2%. Mobile CVR above 1.0%. Photography, trust signals, and checkout are all optimized. |
| Score | What It Looks Like |
|---|---|
| 1 (At Risk) | AOV is at or below the average product price. No bundling, no upsells, no cross-sells working. |
| 2 (On Track) | AOV is 1.2x – 1.5x the average product price. Some bundling or upsell is working. |
| 3 (Leading) | AOV is above 1.5x the average product price. Strong bundle strategy and gifting sets are lifting every transaction. |
| Score | What It Looks Like |
|---|---|
| 1 (At Risk) | Return rate above 20%. Dominant reason is "item not as described" or quality issues: a product or photography problem. |
| 2 (On Track) | Return rate 15% – 20%. Dominant reason is sizing: a solvable problem with better guides and tools. |
| 3 (Leading) | Return rate below 15%. High percentage of returns converted to exchanges or store credit rather than cash refunds. |
| Score | What It Looks Like |
|---|---|
| 1 (At Risk) | 12-month RPR below 10%. No post-purchase flow, no gifting moment targeting, no loyalty mechanism. |
| 2 (On Track) | 12-month RPR 11% – 15%. Basic post-purchase email sequence in place. Some gifting calendar targeting. |
| 3 (Leading) | 12-month RPR above 15%. Automated gifting moment flows, collection drop strategy, and loyalty program all working. |
| Score | What It Looks Like |
|---|---|
| 1 (At Risk) | LTV:CAC below 2:1. CAC payback above 18 months. Acquisition is outrunning retention. Stop scaling. |
| 2 (On Track) | LTV:CAC 2:1 – 3:1. CAC payback 12 – 18 months. Viable but fragile. Focus on AOV and repeat rate. |
| 3 (Leading) | LTV:CAC above 3:1. CAC payback below 12 months. Unit economics support aggressive scaling. |
Scoring Interpretation:
Conversion Rate
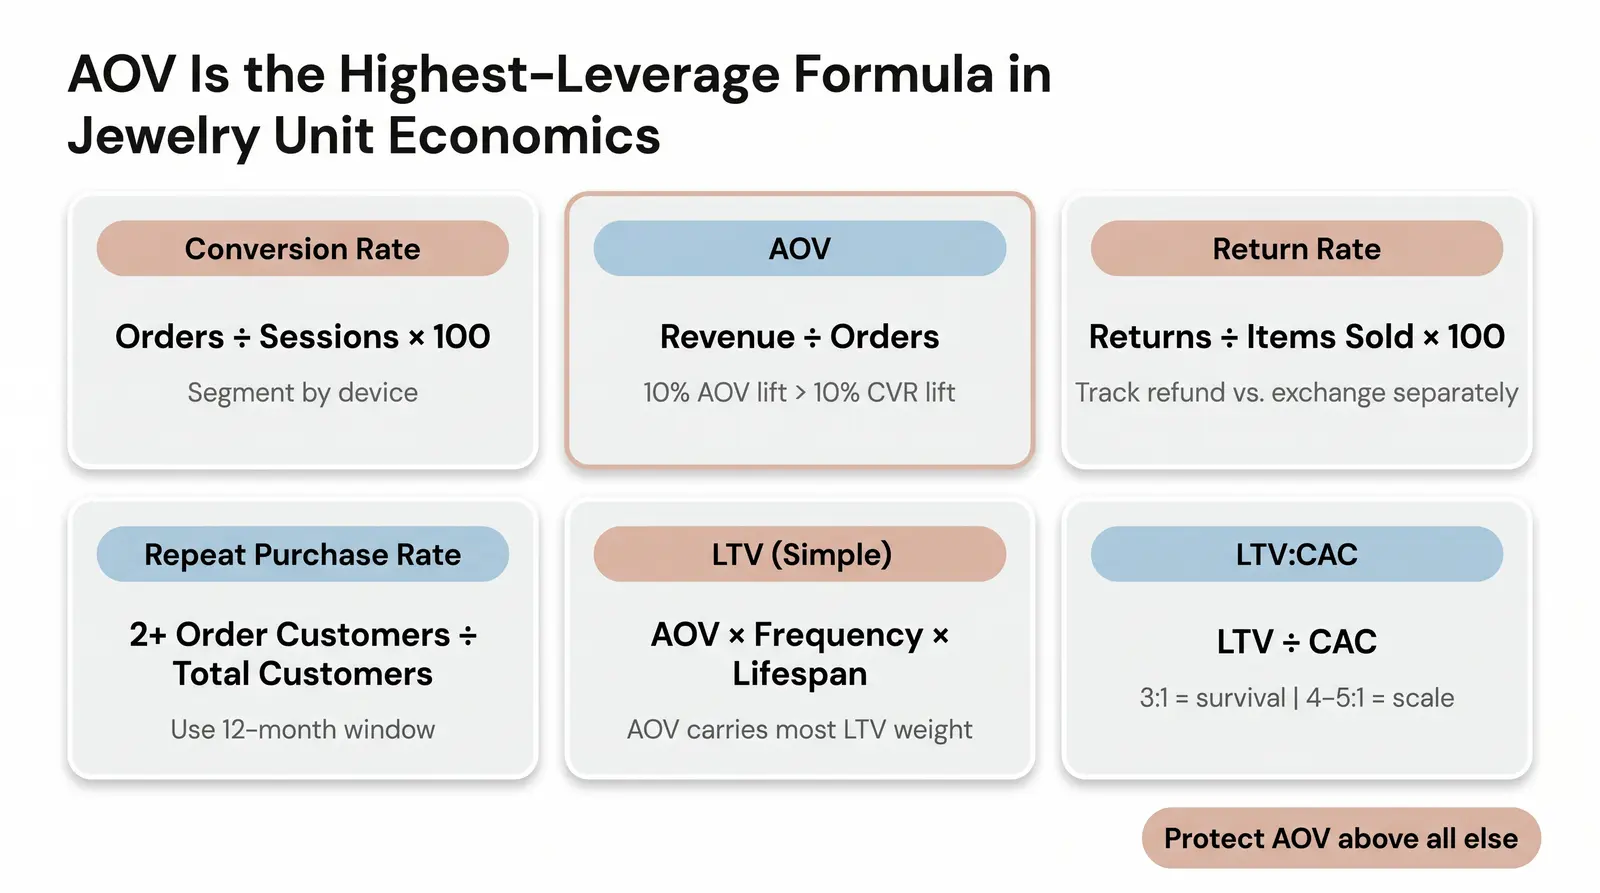
Conversion Rate = (Total Orders / Total Website Sessions) × 100
Jewelry note: Always segment by device. A 1.5% overall rate can hide a 0.8% mobile rate and a 3.0% desktop rate: two completely different problems.
Average Order Value
AOV = Total Revenue / Total Number of Orders
Jewelry note: AOV is the most important lever in jewelry. A 10% increase in AOV has a greater impact on unit economics than a 10% increase in conversion rate, because it improves every downstream metric simultaneously.
Return Rate
Return Rate = (Total Returned Items / Total Items Sold) × 100
Jewelry note: Always track the refund rate (cash back) separately from the exchange rate (retained revenue). A 20% return rate with 50% of returns converting to exchanges is a fundamentally different business than a 20% return rate with 90% cash refunds.
Repeat Purchase Rate
RPR = (Customers with 2+ Orders / Total Unique Customers) × 100
Jewelry note: Always specify the time window. A 90-day RPR is too short for fine jewelry. Use 12-month RPR as your primary benchmark.
Customer Retention Rate
Retention Rate = ((Customers at End of Period - New Customers Acquired) / Customers at Start of Period) × 100
Jewelry note: Retention in jewelry is often driven by annual gifting occasions rather than monthly loyalty. Track it on an annual cohort basis.
Customer Lifetime Value (Simple)
LTV = AOV × Average Purchase Frequency × Average Customer Lifespan
Jewelry note: Because purchase frequency is low, AOV carries most of the LTV weight in jewelry. This is why protecting AOV is more important than chasing frequency.
Customer Lifetime Value (Predictive)
Predictive LTV = (AOV × Purchase Frequency × Gross Margin %) / Churn Rate
Jewelry note: Use this version when you have at least 12 months of cohort data. It accounts for the fact that customers who buy a second time are 45% more likely to buy a third. [9]
CAC Payback Period
CAC Payback (months) = CAC / (AOV × Gross Margin % × Monthly Purchase Frequency)
Jewelry note: In jewelry, this will often be 12-18 months. That is acceptable if LTV is strong. If payback exceeds 18 months, investigate AOV and retention before cutting ad spend.
LTV:CAC Ratio
LTV:CAC = Customer Lifetime Value / Customer Acquisition Cost
Jewelry note: 3:1 on margin dollars is the survival line. 4:1 to 5:1 is where you want to be before scaling aggressively.
Let's look at "Luna & Ore," a fictional but realistic DTC fine jewelry brand doing $400K in annual revenue. They sell primarily gold vermeil and sterling silver pieces in the $150-$350 price range.
Luna & Ore's Current Metrics:
| Metric | Luna & Ore | BJPS Benchmark (Score 2) |
|---|---|---|
| Overall CVR | 0.9% | 0.8% – 1.2% |
| Mobile CVR | 0.6% | 0.6% – 1.0% |
| AOV | $210 (avg. product price: $200) | AOV 1.2x – 1.5x avg. product price |
| Return Rate | 19% (mostly sizing) | 15% – 20% |
| 12-month RPR | 11% | 11% – 15% |
| LTV:CAC | 2.1:1 (CAC: $130, LTV: $273) | 2:1 – 3:1 |
| CAC Payback | 17 months | 12 – 18 months |
Luna & Ore's BJPS Score:
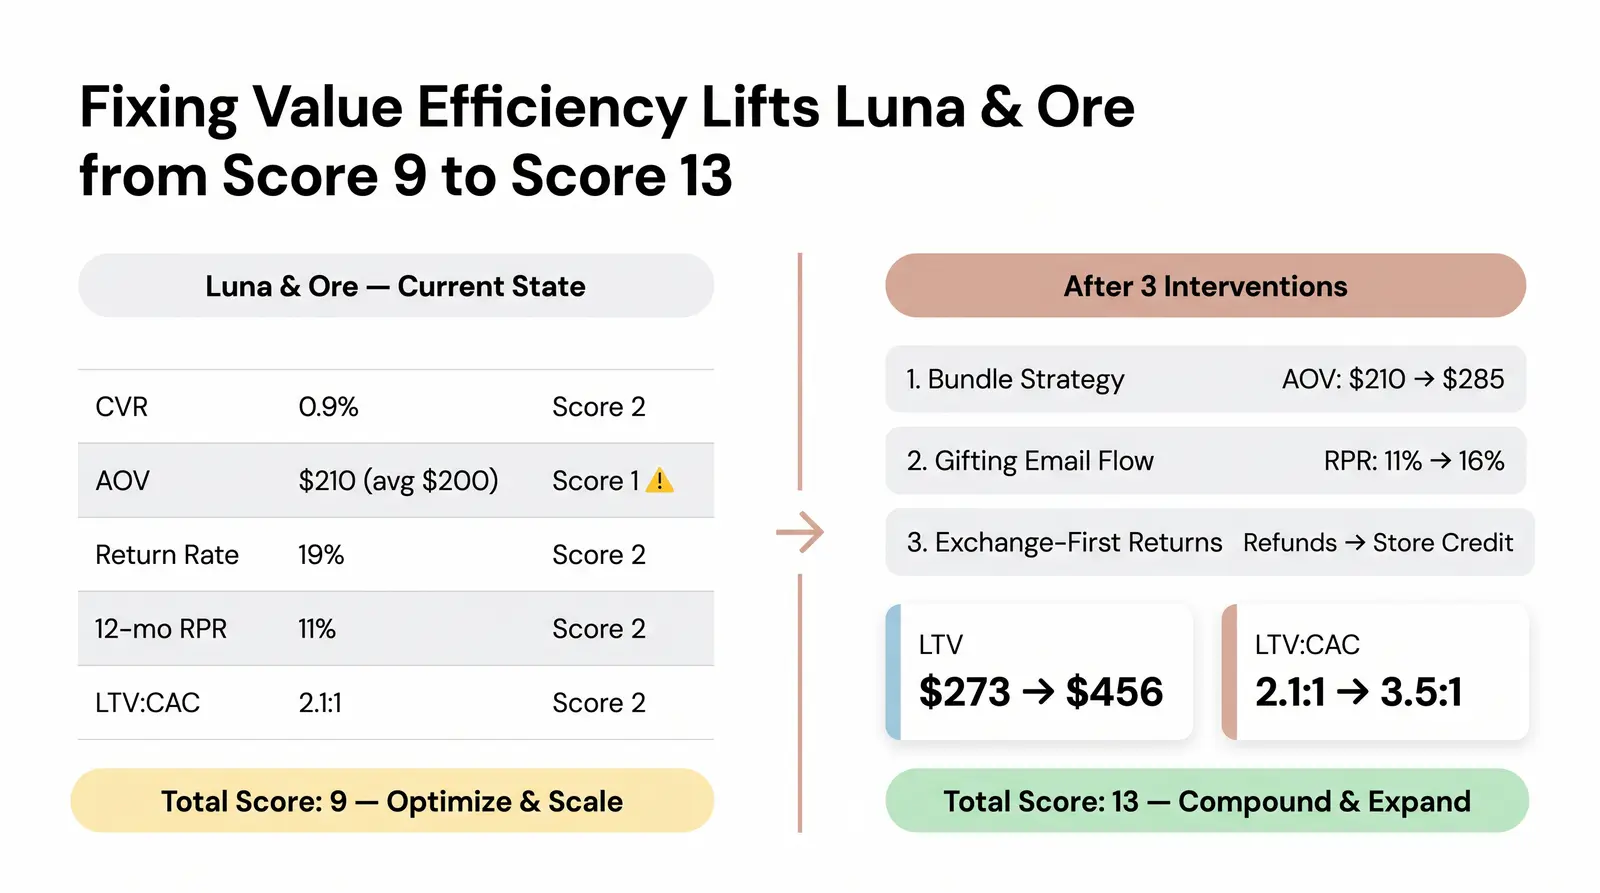
Total Score: 9 (Optimize and Scale)
Luna & Ore has a viable business, but their Value Efficiency score is dragging them down. Their AOV of $210 on a $200 average product price means almost no bundling or cross-selling is happening. Combined with a $130 CAC, they are barely breaking even on the first purchase.
Three Highest-Leverage Interventions:
Implement a Bundle Strategy. Create curated sets — a matching necklace and earring set, or a "starter stack" of three stackable rings — priced at $320-$380. This single change can push AOV to $280-$300 without any additional ad spend.
Build a Gifting Moment Email Flow. Identify customers who bought in November-December (holiday gifting) and trigger an automated email 10.5 months later with a "For someone special this holiday season" campaign. Do the same for Valentine's Day buyers. This is the highest-ROI retention lever in jewelry.
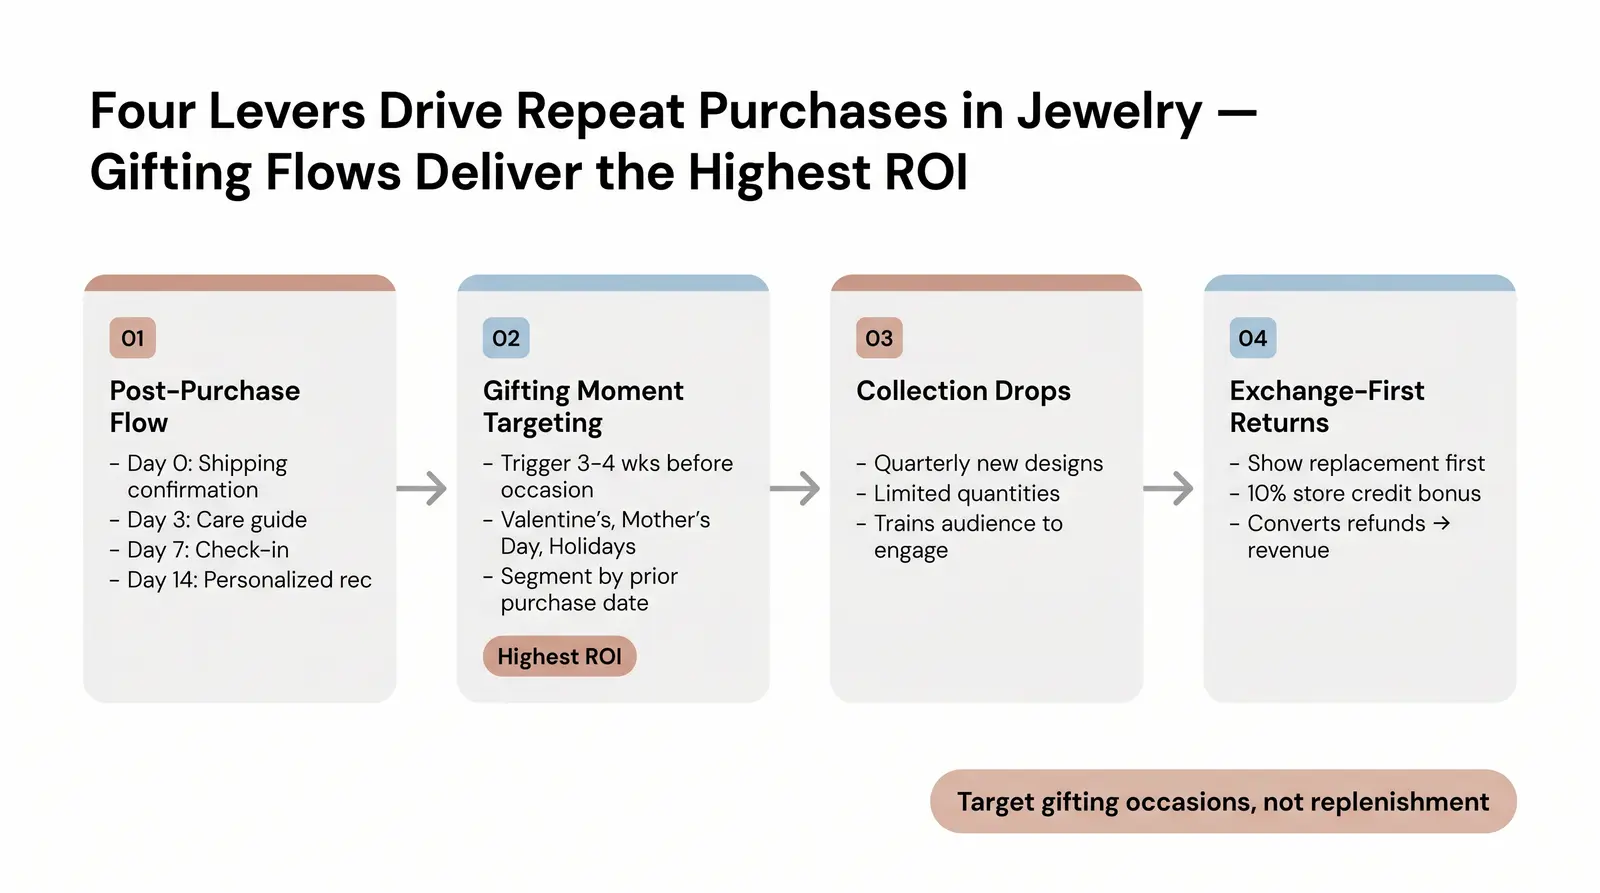
Add an Exchange-First Returns Portal. Implement a returns portal that shows the right replacement before it ever shows a refund button. Offer 10% bonus store credit for exchanges. This converts cash refunds into retained revenue.
Projected Impact:
If Luna & Ore raises their AOV from $210 to $285 through bundling and boosts their 12-month RPR from 11% to 16% through gifting flows, their LTV increases from $273 to $456. Their LTV:CAC ratio improves from 2.1:1 to 3.5:1, and their CAC payback drops from 17 months to 10 months. This moves them from Score 9 to Score 13 on the BJPS, from "Optimize and Scale" to "Compound and Expand."
Most jewelry benchmarks cite repeat purchase rates of 11-20% in 12 months. Compared to the 35-45% rates seen in supplements or pet care, this looks alarming. But the comparison is structurally wrong.
The BS&Co study of 156,110 DTC customers found that jewelry and high-AOV fashion brands cluster around an 11% repeat purchase rate, while consumables hit 30-40%. [9] The reason is not a retention failure. The reason is that the product does not run out.
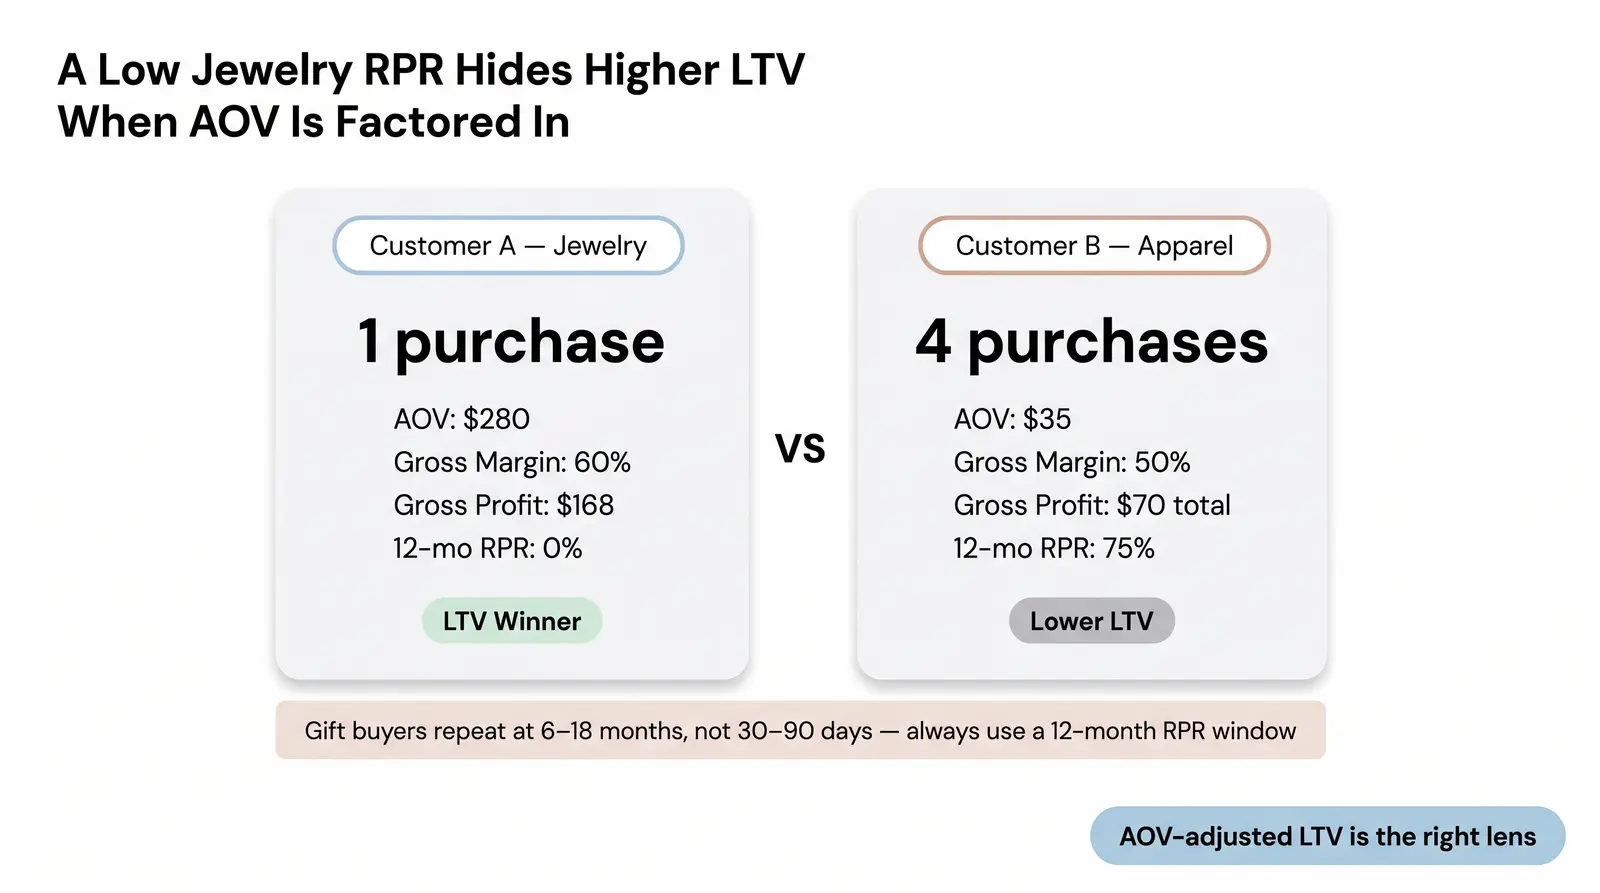
AOV-adjusted LTV is the correct lens. Consider two customers:
Customer A delivered $280 in revenue from one CAC payment. Customer B delivered $140 in revenue from one CAC payment (assuming the same CAC). Customer A is more valuable, even though their repeat purchase rate is 0% in the 12-month window.
The math becomes even clearer when you factor in gross margin. Fine jewelry typically runs 55-70% gross margin. [5] At $280 AOV and 60% gross margin, Customer A delivers $168 in gross profit. Customer B at $35 AOV and 50% gross margin delivers $17.50 per transaction — $70 over four transactions. Customer A still wins.
Gift-purchase dynamics compound this. Many jewelry buyers are gift-givers, not self-purchasers. The "repeat" cycle is tied to gifting occasions — holidays, anniversaries, birthdays — not replenishment needs. This makes 6-18 month repeat windows more meaningful than 30-90 day windows. A customer who buys a Valentine's Day gift and then returns 11 months later for a holiday gift is a highly loyal customer. Their 90-day repeat purchase rate is 0%. Their 12-month rate is 50%.
Here is a contrarian insight worth internalizing: optimizing for repeat purchase rate in jewelry at the expense of AOV — for example, by dropping price points to introduce $40 "everyday" items to increase purchase frequency — is a unit-economics mistake most operators only recognize after the fact. You end up acquiring a different type of customer who dilutes your brand, never trades up to your core pieces, and generates lower gross profit per transaction.
If you want to move the needle on repeat purchases, you need strategies built around how people actually buy jewelry. Generic retention tactics designed for consumables will not work here.
The 14 days after the first order is where most brands lose customers. Inside that window, your job is to confirm the purchase, build anticipation during shipping, and deliver an experience that creates emotional connection.
A high-performing jewelry post-purchase sequence looks like this: a shipping confirmation with tracking and an honest delivery estimate on Day 0; a care guide (how to clean the metal, how to store the piece) on Day 3; a check-in 5-7 days post-delivery asking how the piece looks and requesting a photo; and a personalized recommendation 14 days later based on what they bought.
Packaging inserts matter here. A handwritten-style note, a care card, and a small gift (a polishing cloth, a ring sizer) all contribute to the unboxing experience. The unboxing is the first physical touchpoint. It is the moment the customer decides whether this brand is worth returning to.
This is the highest-ROI retention lever in jewelry. Most jewelry purchases are tied to a specific occasion. If you know when that occasion is, you can reach the customer before they start researching alternatives.
The gifting calendar for jewelry: Valentine's Day (February), Mother's Day (May), graduations (May-June), anniversaries (year-round, but trackable from first purchase date), and the holiday season (November-December). Build automated flows that trigger 3-4 weeks before each occasion, segmented by what the customer previously bought.
A customer who bought a men's ring in November is likely buying a gift for a partner. Target them in late January with a Valentine's Day campaign for a complementary piece. A customer who bought a necklace in April is likely a Mother's Day gift-giver. Target them in late April the following year.
Limited or seasonal collection drops create urgency and give repeat buyers a reason to come back outside of gifting occasions. This mirrors luxury brand strategy. Brands like Cartier and Tiffany do not run constant promotions. They create events.
For an independent jewelry brand, a quarterly collection drop (new designs, limited quantities) gives your email list a reason to open every email. It trains your audience to pay attention. It also creates natural social content and press opportunities.
Curated bundles serve two purposes. They increase AOV on the first purchase, and they create natural repeat occasions later. A customer who buys a necklace-and-earring set for a gift is likely to return for the matching bracelet when the next occasion arrives.
Gift-ready packaging is an underrated lever. If your product arrives in a beautiful box that looks like a gift, the recipient becomes a potential customer. The unboxing experience is a marketing channel.
If you're building a jewelry brand and want infrastructure that supports post-purchase flows, custom packaging, and collection drops without managing a supply chain, explore how Branvas works.
Jewelry conversion rates are structurally lower than general ecommerce for four reasons: the visual trust deficit (customers cannot touch or try on the product), size and metal uncertainty, price sensitivity at higher AOVs, and gift-purchase hesitation (the buyer is not sure if the recipient will like it).
The Mobile vs. Desktop Gap
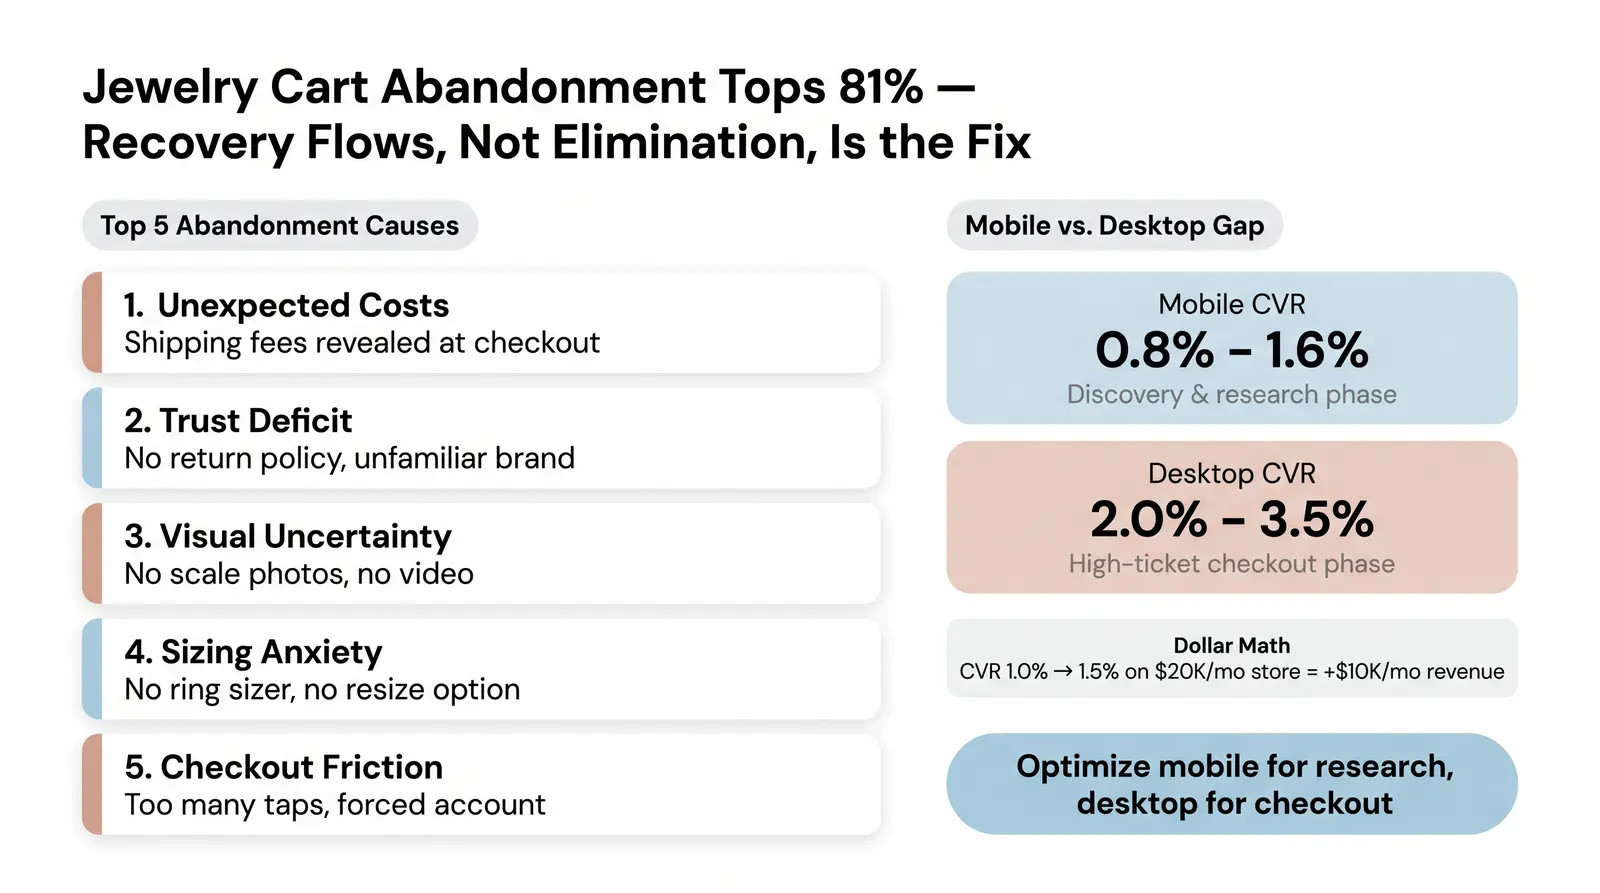
Mobile accounts for 70%+ of ecommerce traffic, but desktop converts significantly better in jewelry. [3] This is a well-documented pattern: customers use mobile for discovery and research, then switch to desktop to view high-resolution images and complete high-ticket transactions. A 2% overall conversion rate might hide a 1.2% mobile rate and a 3.5% desktop rate: two completely different optimization problems.
The fix is not to abandon mobile. It is to optimize mobile for the research phase (fast load times, excellent photography, easy navigation) while removing friction from the desktop checkout (fewer form fields, guest checkout, multiple payment options).
The Top 5 Jewelry-Specific Cart Abandonment Reasons:
The Dollar-Value Math:
For a store doing $20K per month in revenue at a 1.0% conversion rate: improving conversion to 1.5% — a half-percentage-point improvement — adds $10,000 per month in revenue with zero additional ad spend. That is $120,000 per year. The same traffic budget, 50% more revenue.
For a store doing $20K per month at a 1.5% conversion rate: improving to 2.0% adds another $6,700 per month. Each incremental improvement compounds.
Most jewelry brands measure ROAS (Return on Ad Spend). ROAS only measures the efficiency of the first transaction. It tells you nothing about whether the business is actually profitable over time.
LTV:CAC is the metric that matters. It measures the health of the entire customer lifecycle: how much a customer is worth over their lifetime relative to what it cost to acquire them.
Why Jewelry CAC Is High
Jewelry CAC runs approximately $120 to $180 per new customer, significantly above adjacent DTC categories like fashion ($66-$72) or beauty ($61-$68). [5] The reason is the low conversion rate. When only 1 in 100 visitors converts, you pay for 99 visitors who didn't buy. Every dollar of ad spend is spread across a much larger pool of non-converting traffic.
What a Healthy LTV:CAC Looks Like in Jewelry
A 3:1 LTV:CAC ratio on margin dollars is the survival line for jewelry. [10] This means for every $130 spent acquiring a customer, that customer should deliver $390 in gross profit over their lifetime. At a 60% gross margin and $280 AOV, that requires approximately 2.3 purchases over the customer's lifetime, achievable with a strong gifting moment strategy.
The real target is 4:1 to 5:1, which is where jewelry brands can scale aggressively without running out of cash.
Why New Jewelry Brands Have Long Payback Periods, and Why That's Acceptable
New jewelry brands often have a CAC payback period of 12 to 18 months. This is structurally longer than a fast-fashion brand (which might aim for 3-6 months) because the repeat purchase cycle is longer and the CAC is higher.
This is acceptable, provided the LTV is strong. A brand with a 16-month payback period and a 4:1 LTV:CAC ratio is a healthy business. A brand with a 16-month payback period and a 1.5:1 LTV:CAC ratio is burning cash. The payback period alone is not the signal. The ratio is.
Use the Branvas Profit Calculator to model your jewelry brand's unit economics before you launch or scale.
What is a good conversion rate for a jewelry ecommerce store?
A healthy conversion rate for jewelry ecommerce falls between 0.87% and 1.5%, based on 2025-2026 industry data. [1] [2] Because jewelry is a high-consideration purchase with a high average order value, conversion rates are structurally lower than the general ecommerce average of 2-3%. A rate above 1.5% puts you in the top tier of jewelry ecommerce. If your rate is below 0.8%, investigate trust signals, product photography, and mobile checkout friction before assuming the problem is traffic quality.
What is the average repeat purchase rate for jewelry brands?
The average 12-month repeat purchase rate for jewelry sits around 11-20%, compared to 25-30% for general ecommerce. [9] This is lower by design: jewelry is bought for specific gifting occasions, not replenished on a regular cycle. A 12-month RPR below 10% signals a need to invest in post-purchase flows and gifting moment targeting. A rate above 15% indicates strong retention relative to the category.
What is the average AOV for jewelry ecommerce?
Average order value varies significantly by sub-niche. Fashion and costume jewelry averages $40-$85. Demi-fine and minimalist jewelry ranges from $85-$200. Fine jewelry typically exceeds $500, with bridal often reaching $2,000+. [5] The general jewelry and accessories category averages approximately $180, compared to a general ecommerce average of $143. [2] AOV is the most important lever in jewelry because it determines whether the unit economics work at all.
Why is my jewelry store's repeat purchase rate lower than ecommerce averages?
Jewelry is not a consumable product — it doesn't run out. Additionally, a significant portion of jewelry purchases are gifts, meaning the repurchase cycle is tied to annual milestones (anniversaries, holidays) rather than 30-day replenishment cycles. This makes short-term repeat rates look artificially low. A customer who buys a Valentine's Day gift and returns 11 months later for a holiday gift is a loyal customer with a 0% 90-day repeat rate and a 50% 12-month rate. Always use a 12-month window to benchmark jewelry repeat purchase rates.
How can I increase customer retention in a jewelry ecommerce store?
The most effective strategies are specific to how people buy jewelry. First, build gifting moment flows — automated email sequences that trigger 3-4 weeks before major gifting occasions (Valentine's Day, Mother's Day, holidays) for customers who previously bought during those windows. Second, implement a post-purchase sequence that includes care instructions, a satisfaction check-in, and a personalized recommendation 14 days after delivery. Third, create seasonal collection drops that give your email list a reason to engage outside of gifting seasons. Finally, implement an exchange-first returns portal that converts cash refunds into store credit, keeping revenue on your books. Brands using all four of these levers consistently outperform the 20% 12-month RPR benchmark.


