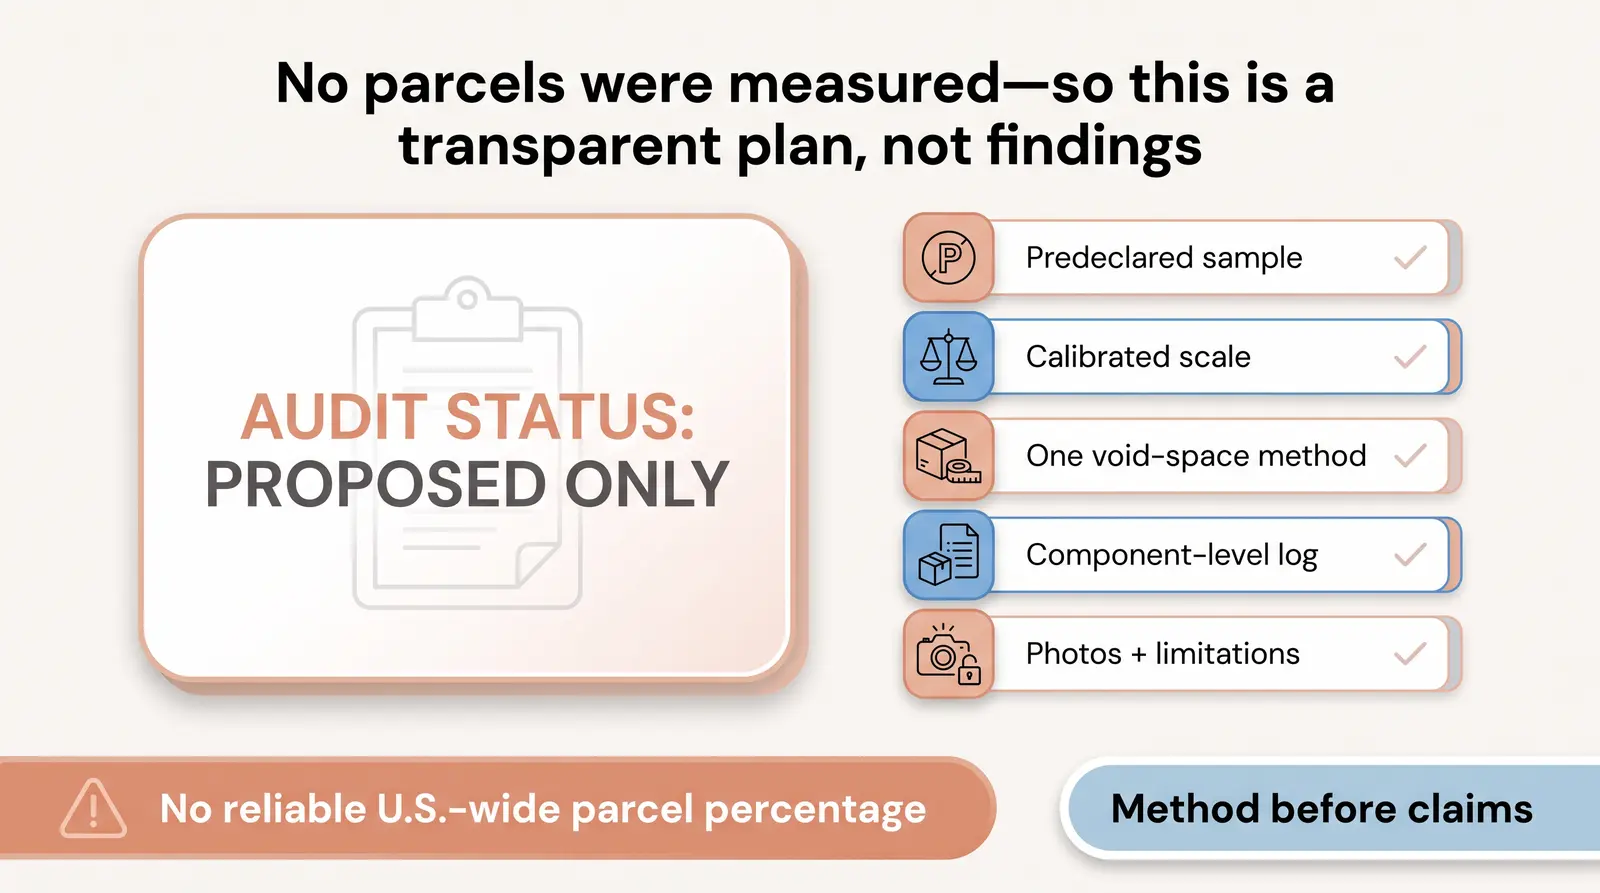


Ecommerce packaging waste lacks a universal U.S. statistic; this guide separates EPA data from online-specific research and proposes a reproducible parcel audit protocol with three distinct metrics.
Published:
November 12, 2026
Author:
Yi Cui
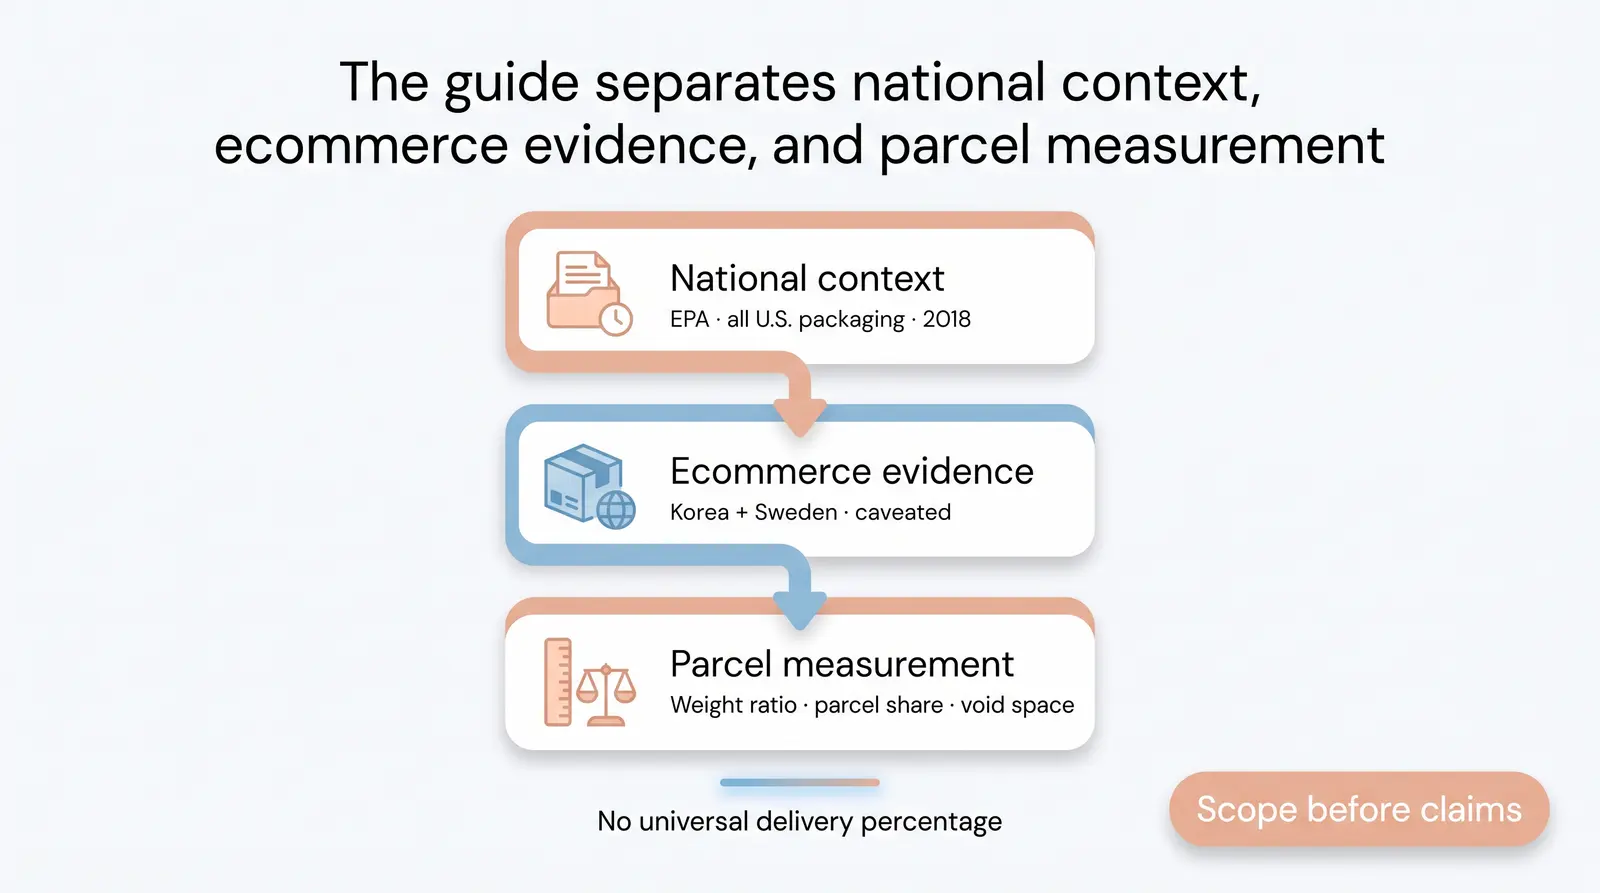
No single, reliable U.S. percentage answers how much of an ecommerce delivery is packaging. The latest EPA figures track every kind of U.S. municipal-solid-waste container and packaging in 2018, not online parcels. Ecommerce-specific evidence is limited and location-dependent: a Korean 2010 to 2015 study linked the same amount of online spending with more packaging waste than offline spending, but it is not a U.S. parcel benchmark. The practical answer is a transparent parcel measurement that separates packaging mass from parcel space. 1 2 9
EPA defines containers and packaging as products assumed to be discarded in the same year the contained product is purchased. Its latest complete data are for 2018 and cover U.S. post-consumer municipal solid waste, not ecommerce orders or delivery parcels. 1 9
| 2018 U.S. MSW containers and packaging measure | Value | What the figure does, and does not, represent |
|---|---|---|
| Generated | 82.22 million short tons, 28.1% of total MSW generation | National generation of all containers and packaging |
| Recycled | 44.33 million short tons, 53.9% of generated packaging | A national management outcome, not a parcel recycling rate |
| Combusted with energy recovery | 7.42 million short tons | A national management outcome |
| Landfilled | 30.47 million short tons | A national management outcome, not ecommerce packaging alone |
Source: EPA 2018 U.S. MSW containers-and-packaging data. 1
The category is much broader than shipping boxes and mailers. It includes packaging for food, beverages, medicines, cosmetics, storage, and other products, across paper and paperboard, glass, steel, aluminum, plastics, wood, and miscellaneous materials. 1
Material detail is useful context, but it still does not isolate online retail. EPA reports 33.3 million short tons of corrugated boxes generated in 2018 and a 96.5% corrugated-box recycling rate. It reports 14.53 million short tons of plastic containers and packaging generated, with 1.98 million tons recycled, or 13.6%. 1
Those figures can describe the scale and material mix of national packaging waste. They cannot tell a seller what percentage of a particular delivery was packaging.

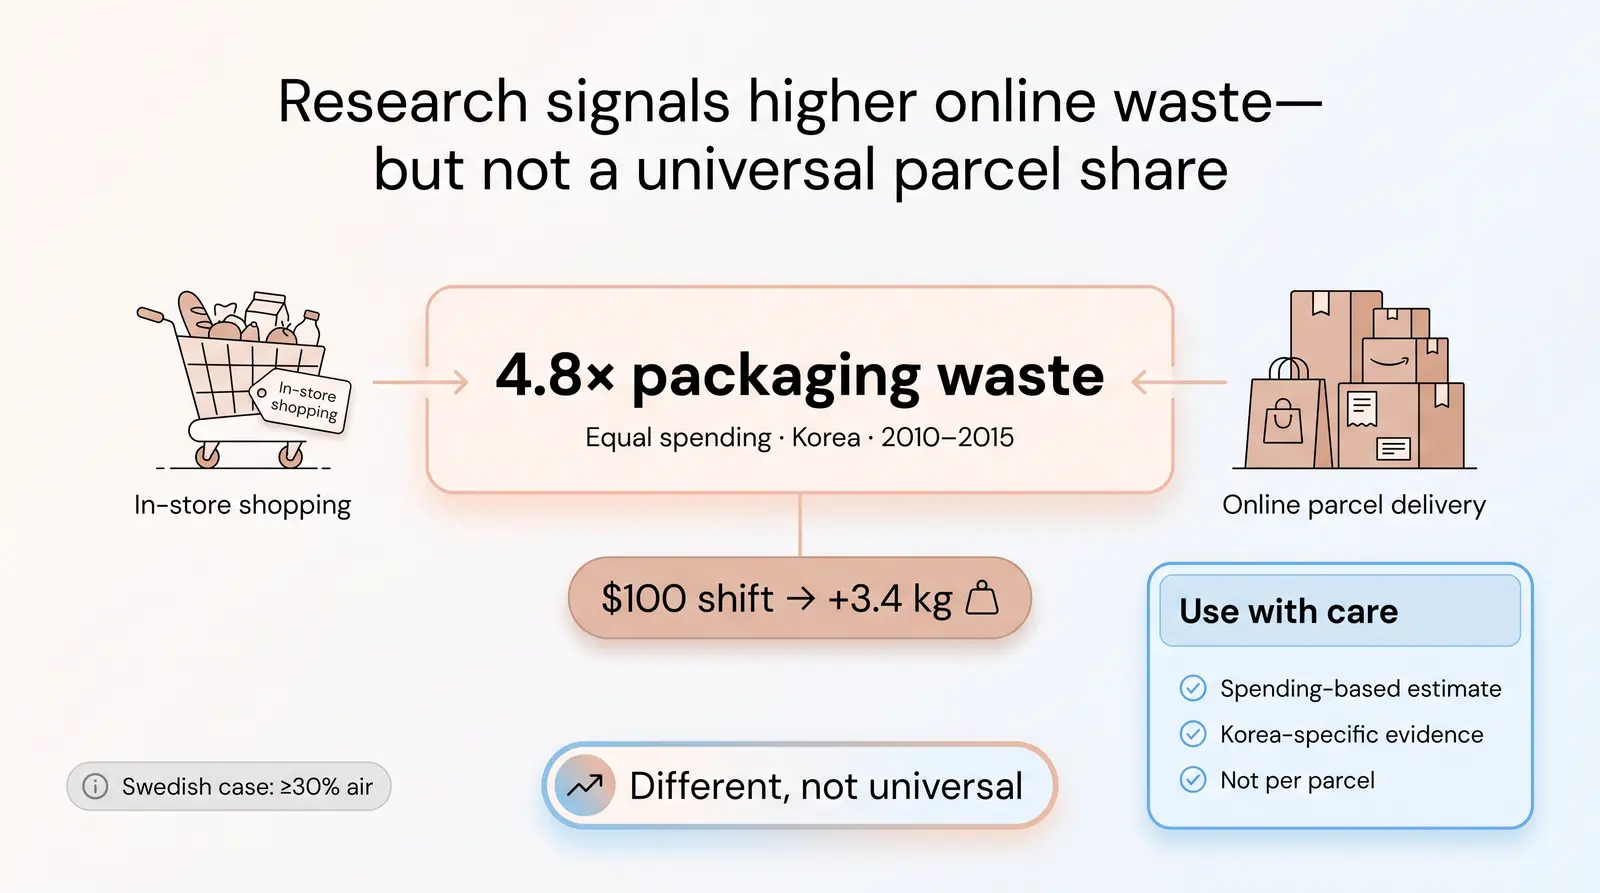
The clearest quantitative comparison located for online shopping is not a U.S. parcel study. Kim, Kang, and Chun combined Korean county-level household-waste data with online and offline spending data for 2010 to 2015. They reported that the same amount of online spending generated 4.8 times the packaging waste of offline spending. 2
The study also estimated that shifting $100 of spending from offline to online generated an additional 3.4 kg of packaging waste. That is a spending-based estimate in Korea, not a ratio of packaging weight to product weight, a measurement of one box, or a U.S. national forecast. 2
A second useful caution comes from a Swedish qualitative retail case. The focal logistics provider's internal calculation estimated that its ecommerce parcels averaged at least 30% air. The research frames empty space as a protection and operations tradeoff, but the figure is not an independently audited or representative ecommerce average. 3
Together, these sources support a careful conclusion: online-shopping packaging waste can be meaningfully different from store-shopping packaging, yet current evidence does not yield one universal answer to how much of a delivery is packaging.
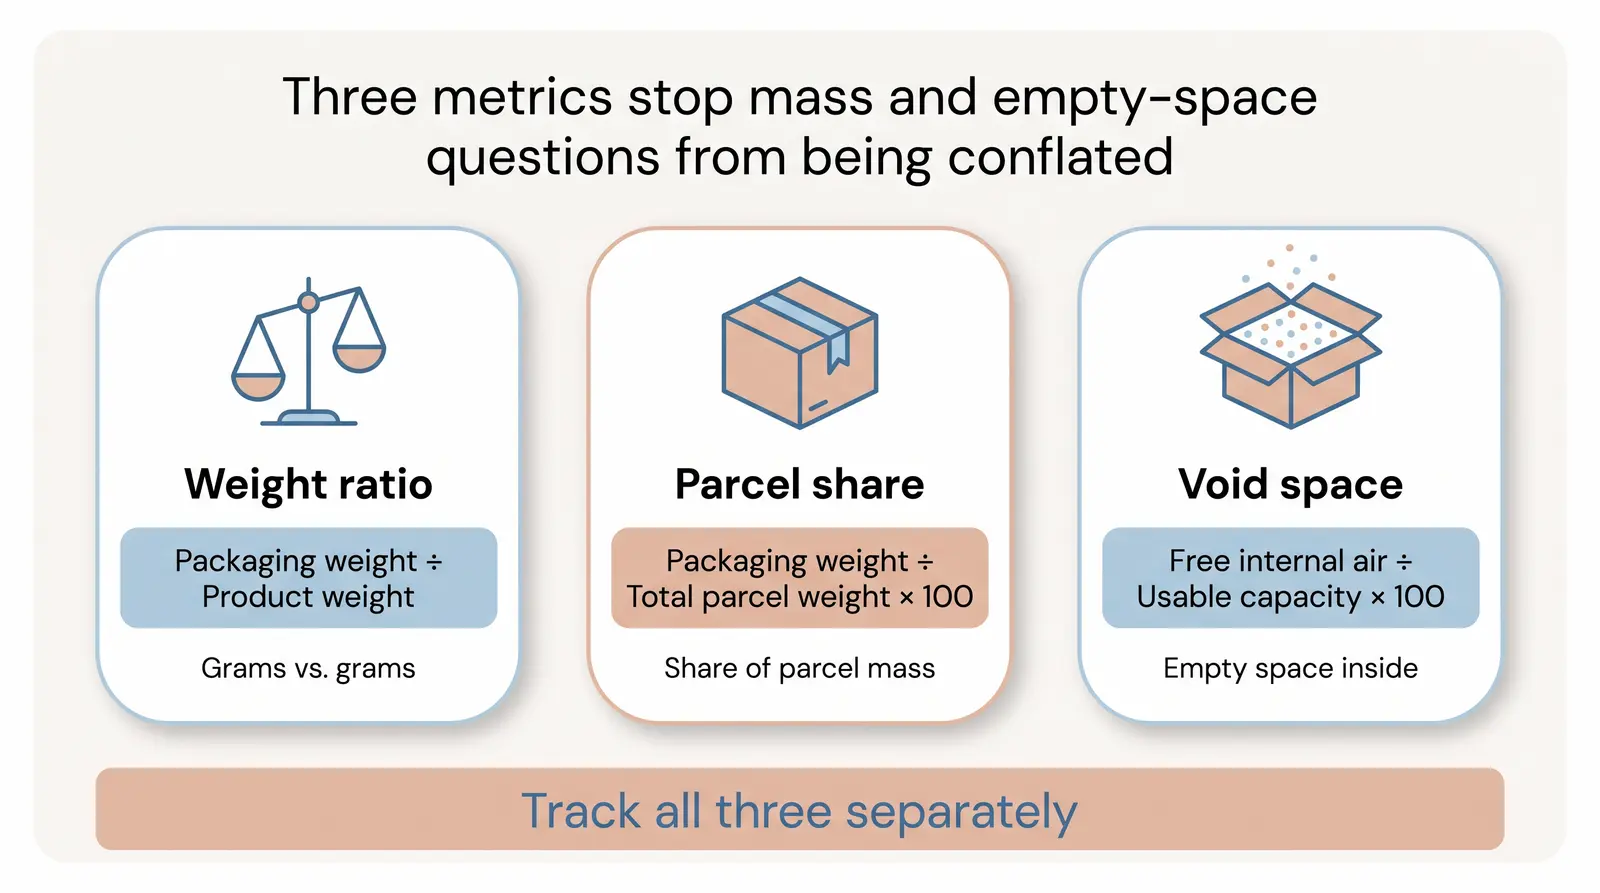
Use the same definitions for every parcel in a comparison. In the formulas below, total packaging weight includes primary packaging, secondary shipping packaging, void fill, labels, and tape. Product weight excludes that packaging.
| Metric | Formula | What it measures | Why it is not interchangeable |
|---|---|---|---|
| Packaging-to-product weight ratio | total packaging weight / product weight |
Packaging grams relative to product grams | A light product can produce a high ratio even when the package is physically small |
| Packaging share of total parcel weight | (total packaging weight / total parcel weight) × 100 |
The percentage of parcel mass that is packaging | It uses the whole parcel as the denominator, so it will not equal the ratio above |
| Void-space percentage | (free internal air volume / usable internal container volume) × 100 |
Unoccupied air within the shipping container | It measures space, not grams or material type |
For this protocol, void fill is a packaging component by weight. Its physical volume counts as occupied, rather than as free air, in the void-space calculation. Record its weight separately so an apparently full box is not mistaken for a low-material shipment.
Status: This is a proposed method that readers or Branvas could run. Branvas has not purchased, weighed, measured, or photographed parcels for this article.
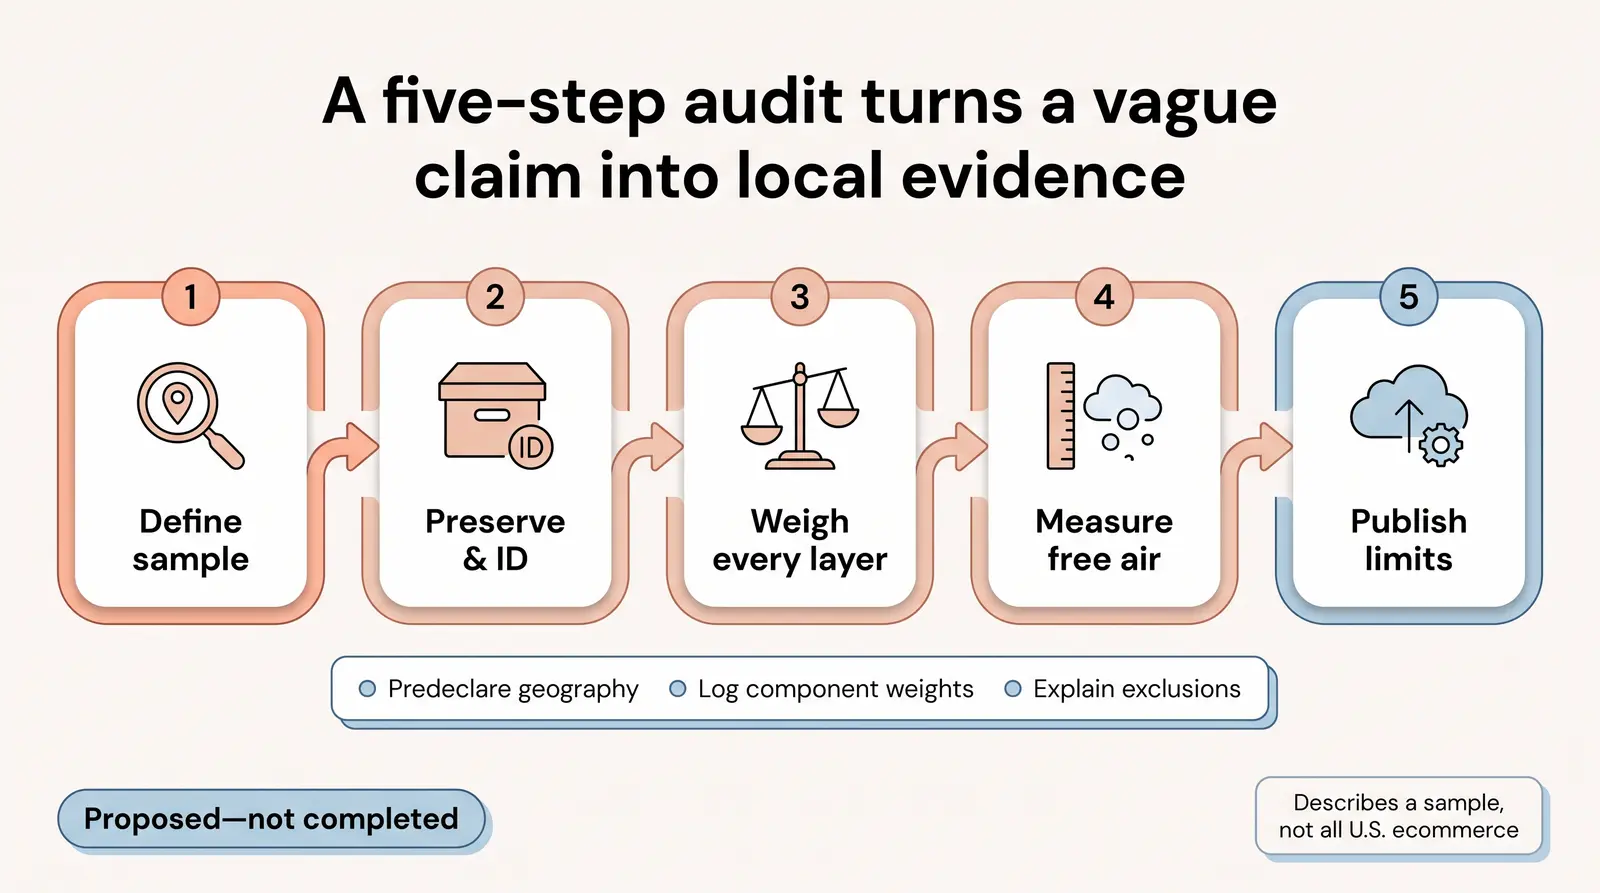
Document the target geography, purchase period, retailer or fulfillment route, inclusion rules, exclusions, and the planned number of parcels before orders are placed.
Build the sample across apparel, accessories, beauty, and home goods. Publish the final count in each category and identify any missing or excluded parcel, rather than treating a convenience sample as a national estimate.
Assign each delivery a parcel ID. Photograph the unopened exterior, shipping label with personal information obscured, each opened layer, every separated component, and the measurement setup.
Record the delivery date, destination region, product category, carrier where visible, package type, and material notes. Keep the original packaging together until all weights and dimensions have been recorded.
Use one calibrated scale, state its resolution, and record grams. Weigh these components separately:
Add the components to calculate total packaging weight. Compare the component sum with the as-received parcel weight and log any difference rather than silently adjusting it.
Before removing or rearranging contents, document the opened parcel. Keep the product and all packaging components in their received positions.
Fill only the remaining free gaps with a documented, dry, reusable fill medium. Measure that medium's volume in a graduated container. This is the free internal air volume.
After emptying the shipping container, use the same fill medium and closure position to measure its usable internal capacity. Divide the first volume by the second. If a parcel cannot be measured without disturbing contents, mark the void-space result as not measurable and explain why.
This method intentionally does not count air sealed inside bubble wrap, foam, or other cushioning as free void space. It treats the cushioning as a physical packaging component.
Publish raw component weights, external dimensions, the void-space method, photo IDs, category totals, and the formulas used. State whether visible damage or a return is observed during the documented period, but do not infer that packaging caused either outcome without a separate design.
List limits such as product shape, shipment distance, season, retailer selection, measurement uncertainty, and local recycling access. A documented sample can describe its own sample. It cannot automatically represent all U.S. ecommerce.
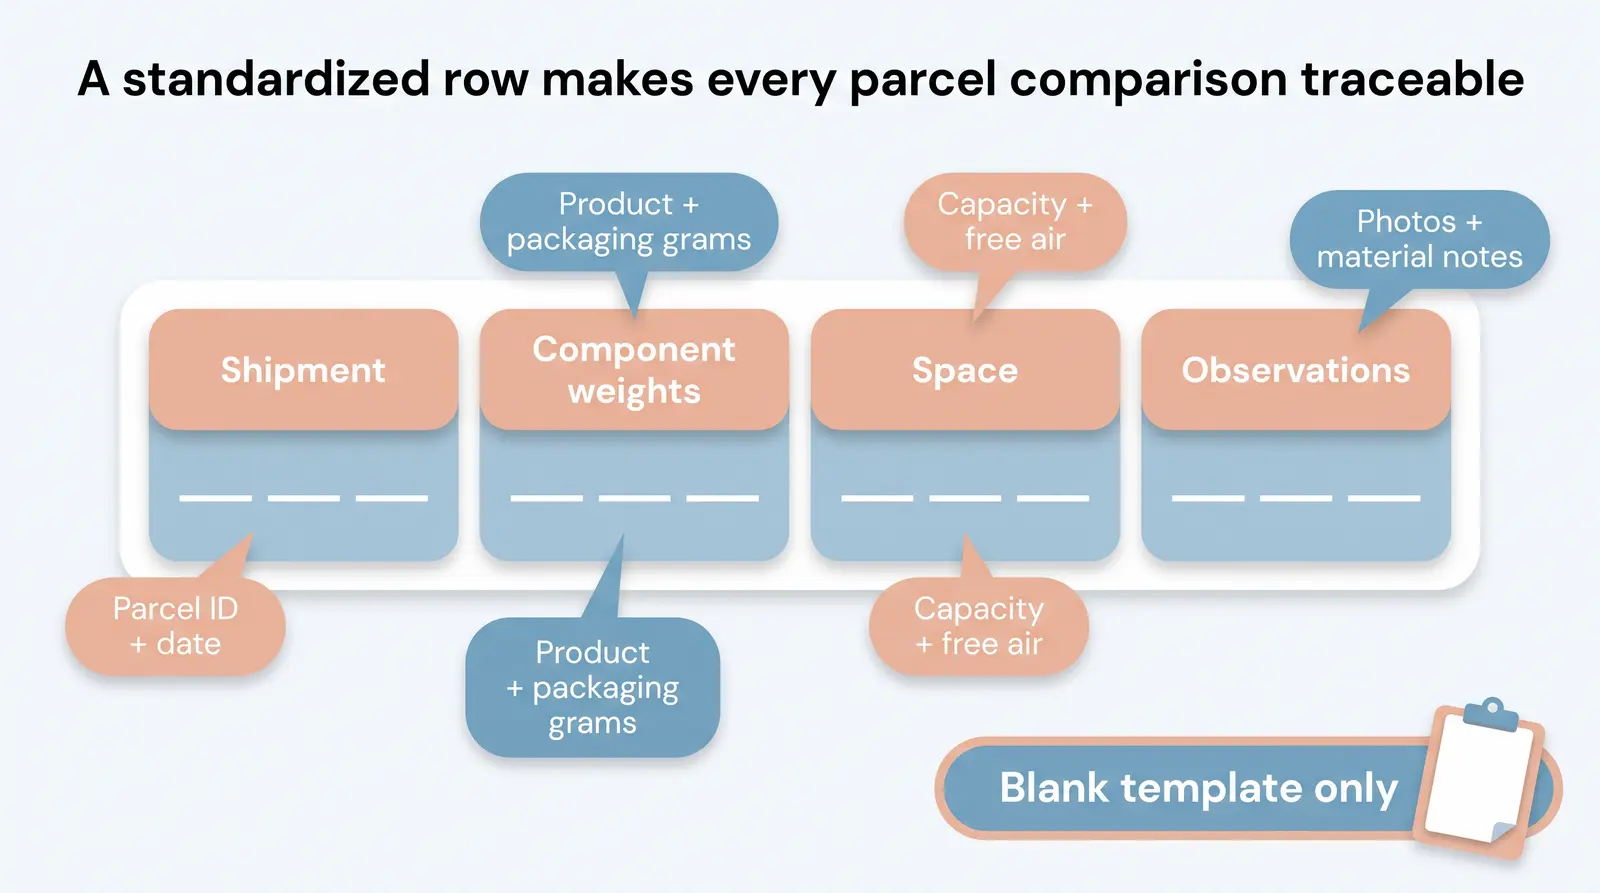
Blank template only. It contains no audit findings.
| Parcel ID | Arrival date and region | Category | Product weight, g | Primary packaging, g | Secondary packaging, g | Void fill, g | Labels and tape, g | Total packaging, g | Total parcel weight, g | Packaging-to-product ratio | Packaging share, % | Usable internal capacity, L | Free internal air, L | Void space, % | Material notes | Damage or return observation | Photo IDs and notes |
|---|
This example demonstrates the arithmetic. It is not a Branvas parcel, measurement, audit result, or benchmark.
| Hypothetical component | Weight |
|---|---|
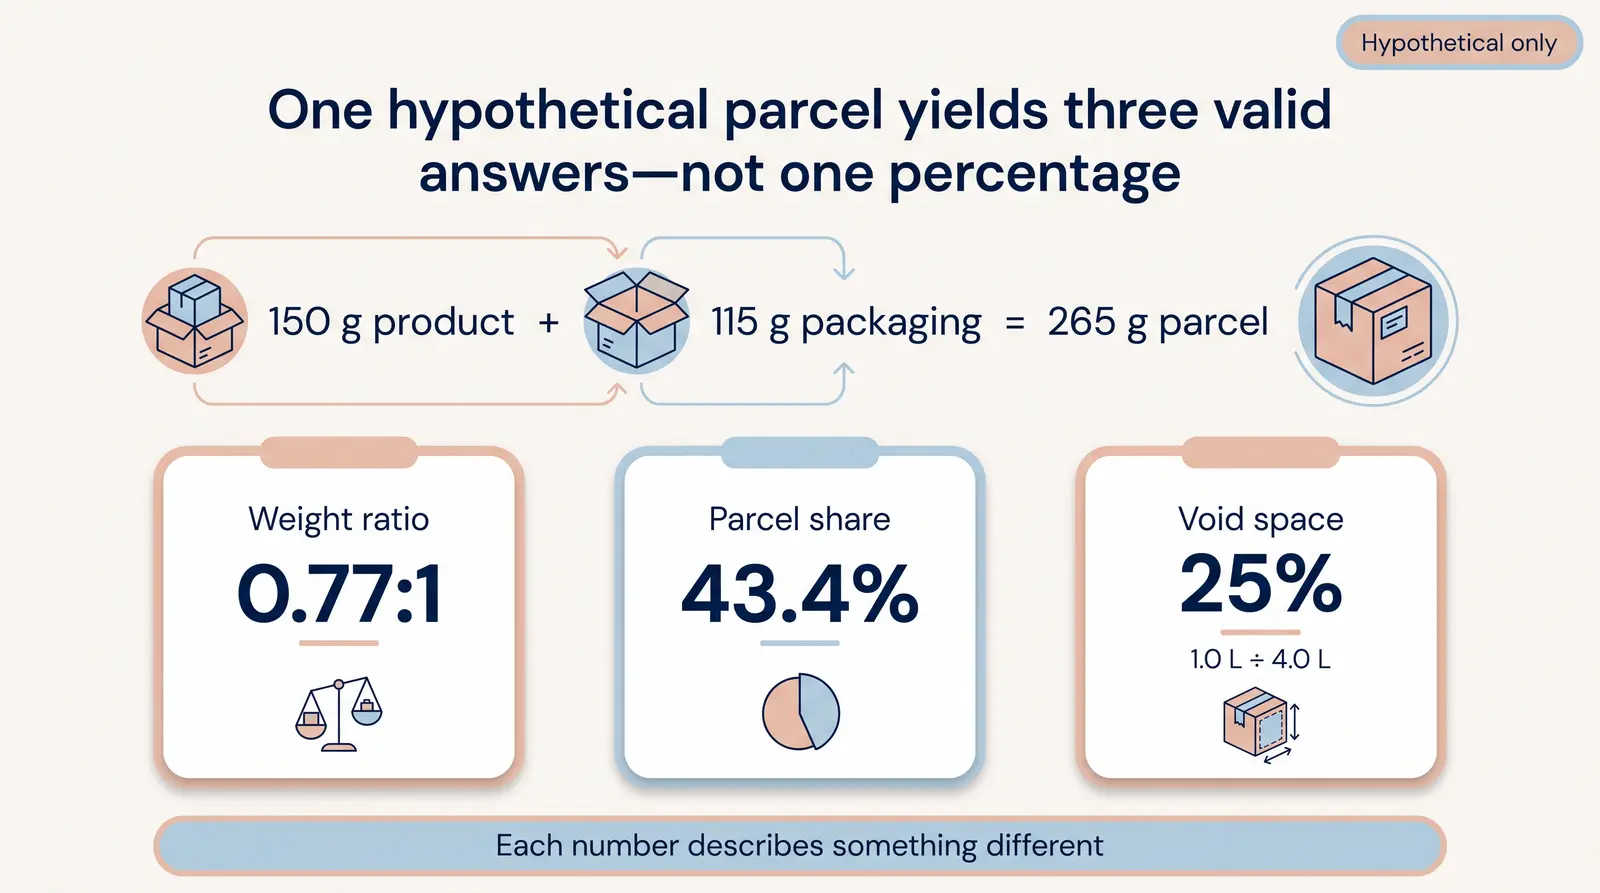
| Product | 150 g |
| Primary packaging | 20 g |
| Secondary shipping packaging | 80 g |
| Void fill | 10 g |
| Labels and tape | 5 g |
| Total packaging | 115 g |
| Total parcel | 265 g |
The calculations are:
115 g / 150 g = 0.7667, reported as 0.77:1.(115 g / 265 g) × 100 = 43.4%.(1.0 L / 4.0 L) × 100 = 25%.The same shipment can therefore have a 0.77:1 weight ratio, a 43.4% packaging share, and 25% void space. Each number describes a different property.
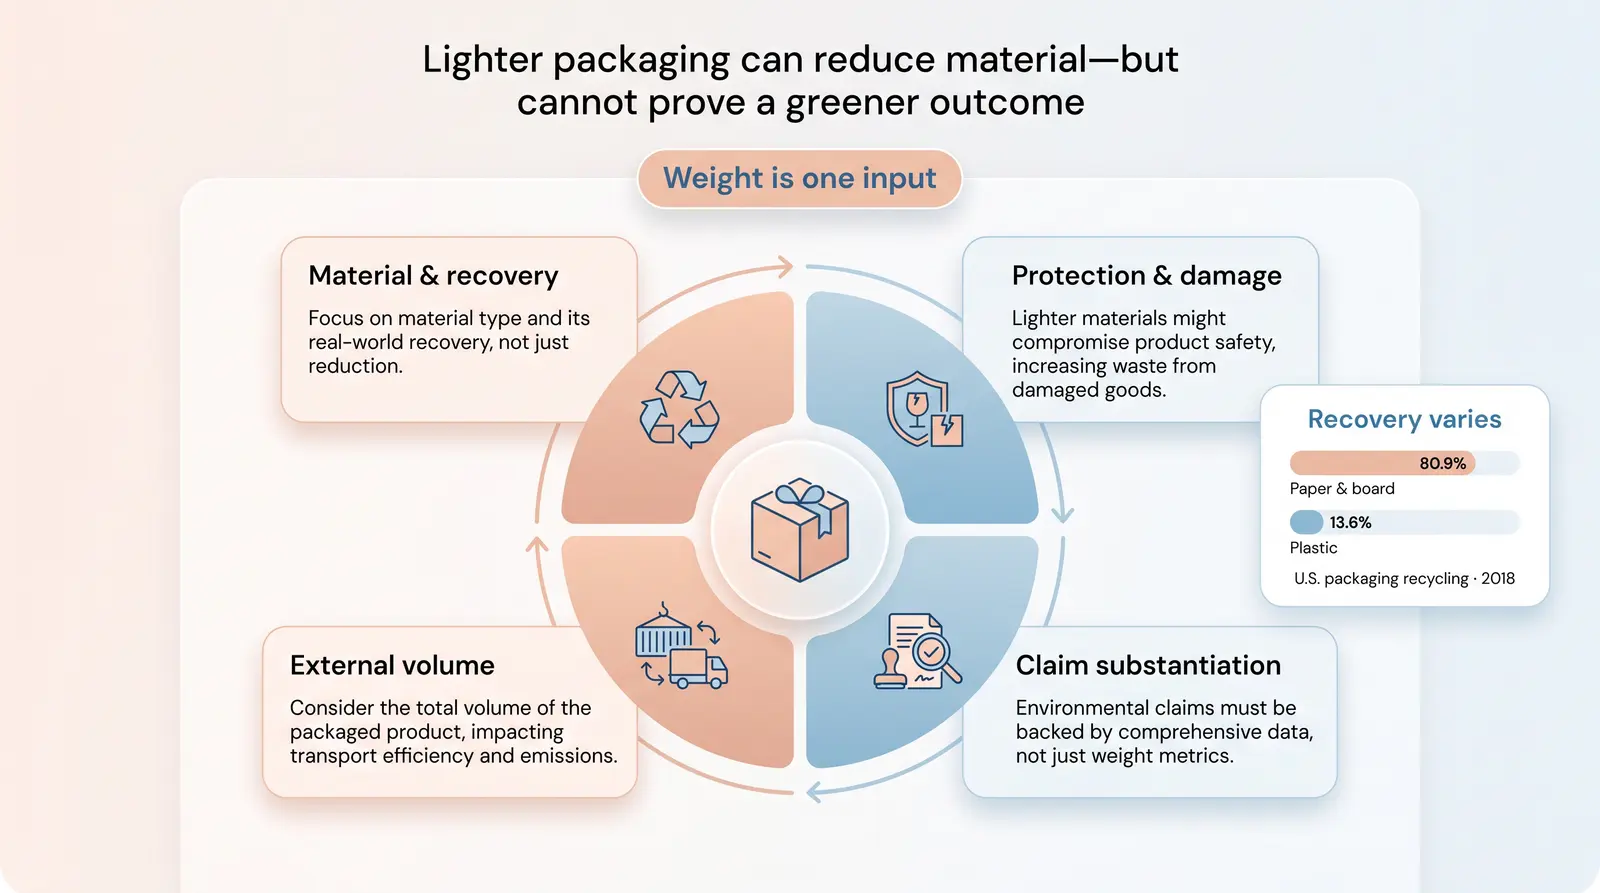
A lower packaging weight may reduce material use, but it does not by itself establish that one package has a lower overall environmental impact. EPA advises considering both production and disposal, and notes that recovery matters as well as source reduction. 8
Material and recovery pathways vary. In EPA's 2018 national MSW data, paper and paperboard containers and packaging had an 80.9% recycling rate, while plastic containers and packaging had a 13.6% recycling rate. Those are national category outcomes, not a guarantee that a particular package will be accepted where a customer lives. 1
Protection matters too. Amazon's seller guidance says an oversized package can let an item bounce and become damaged, while a package that is too small can squash or crush it. Its advice is to fit the package to the product and use protective material where needed. 5
External volume is a separate operational measure. UPS calculates dimensional weight from length, width, and height divided by a rate-specific divisor, and FedEx says it bills the greater of dimensional or actual weight. Carrier rules and divisors vary, so use the applicable service and contract before making a cost comparison. 6 7
Marketing language needs the same discipline. FTC guidance says marketers should analyze tradeoffs before a qualified general claim implies an overall environmental benefit. It also says recyclable claims may need qualification when suitable recycling facilities are not available to at least 60% of the consumers or communities where the product is sold. 4
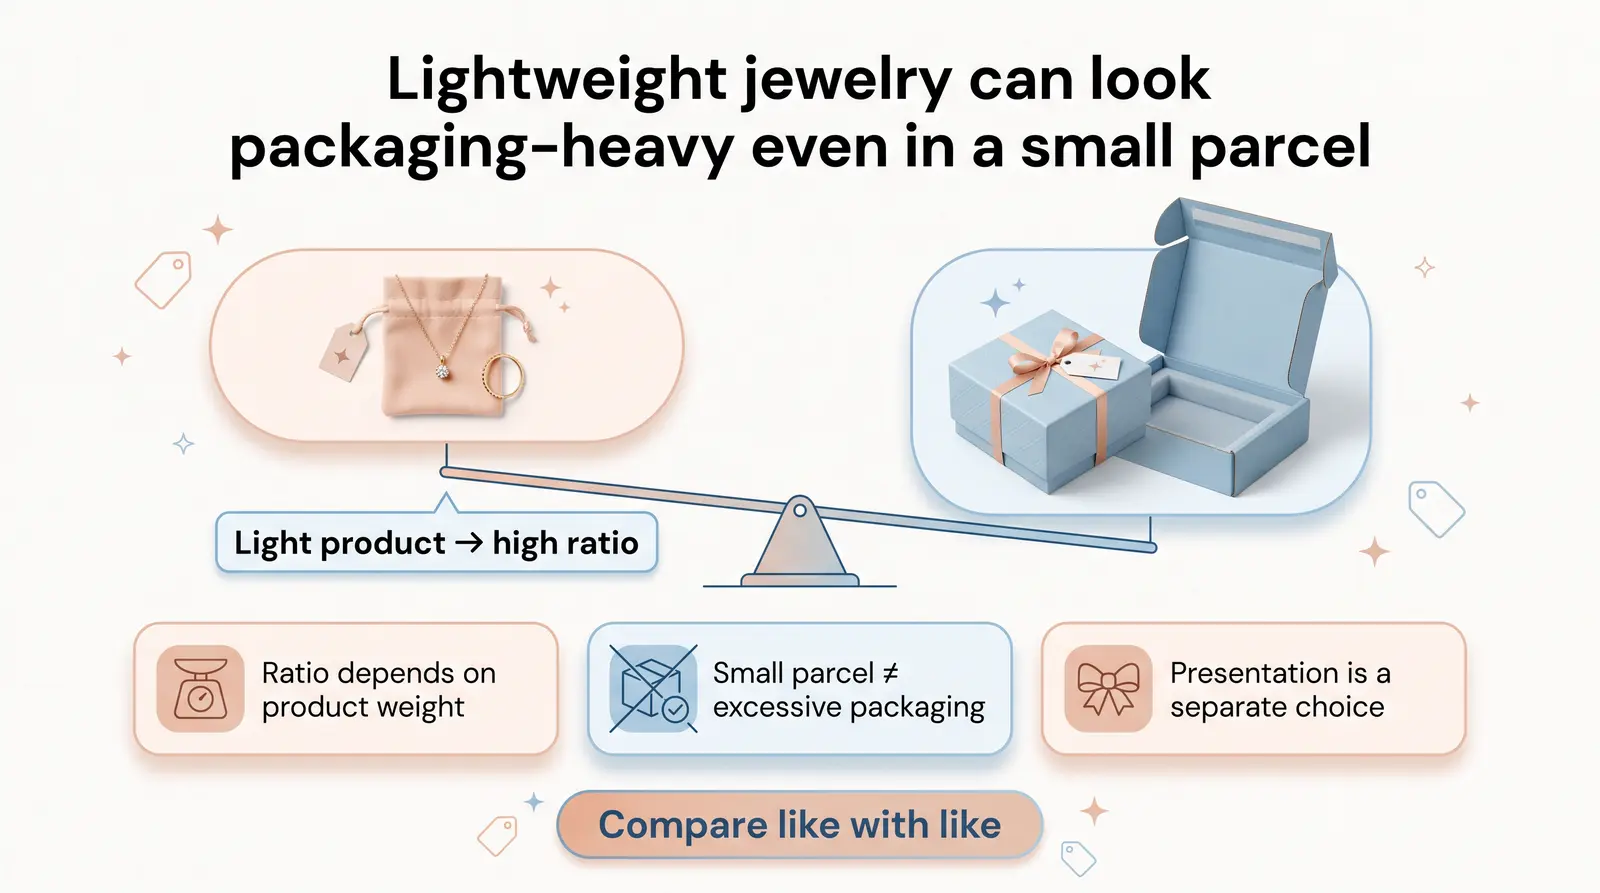
Jewelry is often lightweight, so a packaging-to-product ratio can look high even when the parcel is small. That is a property of the denominator, not proof that the packaging is excessive.
For the design side of the tradeoff, see this separate guide to jewelry packaging ideas for small businesses. It focuses on branded presentation rather than national waste statistics or parcel-audit results.
Store owners evaluating a private-label jewelry fulfillment option can next review how Branvas works.
Not in the sources used here. EPA reports all U.S. MSW containers and packaging for 2018, not ecommerce parcels, and the ecommerce research cited here does not provide a representative U.S. parcel-weight share. 1 2
No. The 4.8-times estimate compares equal online and offline spending in Korea from 2010 to 2015. It does not compare individual products, individual parcels, or every market. 2
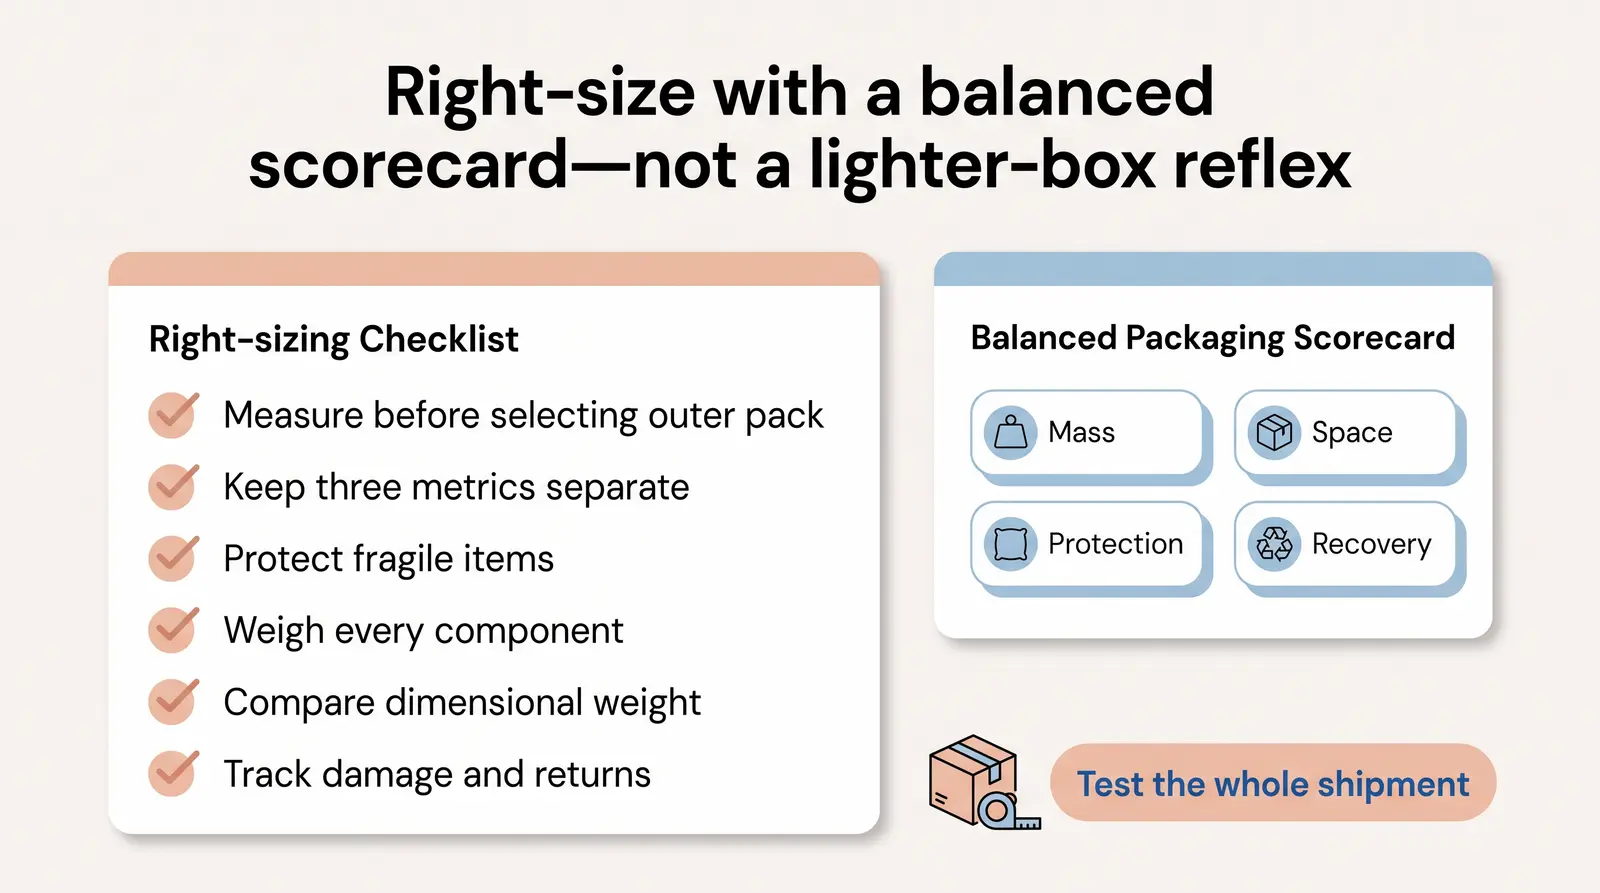
Use all three when possible. The ratio helps compare packaging mass against product mass, parcel share shows how much of shipment mass is packaging, and void space identifies unused interior capacity. None replaces the others.
No. The at-least-30% figure was an internal calculation reported by one logistics provider in a Swedish qualitative case. It is useful for framing a measurement question, not for setting a universal target. 3
No. Weight does not resolve material production, recovery access, product protection, transport volume, or other tradeoffs. Make specific, qualified claims and test the functional package, not weight alone. 4 8
The chosen primary cluster is ecommerce packaging waste and online shopping packaging waste, with an evidence-seeking reader intent: find citable statistics, understand whether online shopping differs from store shopping, and decide what to measure in a shipment.
General national packaging-waste statistics and packaging-to-product ratio were kept as separate layers. EPA supplies national context, while the ratio is a parcel-level measurement method. Broad claims about excessive packaging rates, a universal ecommerce parcel share, or a current U.S. ecommerce tonnage were not used because the consulted evidence does not support them.
The supplied title remains accurate as a question. The opening answers it directly: there is no reliable universal U.S. percentage. The hook was converted from an implied original audit into a proposed, documented audit protocol, because no physical audit was performed.
The research record identified an informational, statistics-led result set spanning official EPA data, peer-reviewed ecommerce research, and vendor/editorial statistics roundups. The research output recorded ordinary organic listings only. It did not reliably observe a featured snippet, answer box, image pack, news pack, or other special SERP feature.
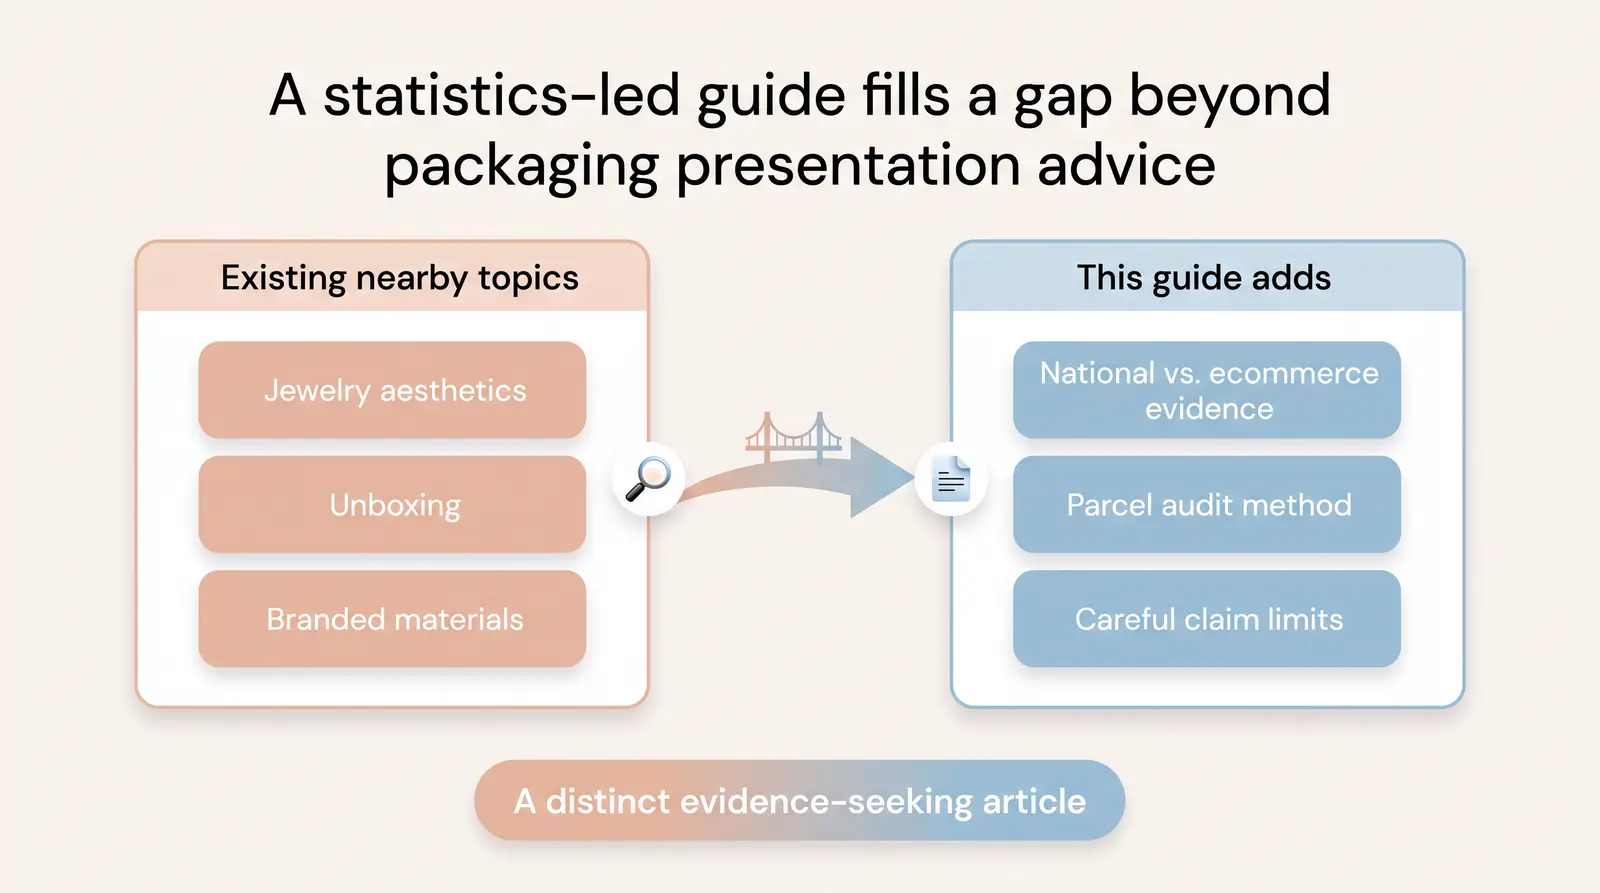
The recommended format is a new article, not an update. The closest Branvas pages focus on jewelry-packaging aesthetics, unboxing, branded packaging, or jewelry-material lifecycle. This article is distinct because it separates national data from ecommerce evidence and supplies an audit method without claiming measurements.
The Branvas blog index, sitemap, closest relevant posts, How It Works page, and a site-search URL were checked. The site-search response was not extractable, so the overlap check is strong for the closest pages but not exhaustive. Two verified, non-overlapping internal links were used: the jewelry packaging ideas guide as a design companion and How It Works as the single next-step CTA.
| Evidence used | Year or period | Scope and handling in the article |
|---|---|---|
| EPA 82.22 million short tons, 28.1%, 44.33 million recycled, 30.47 million landfilled, plus material figures | 2018 | U.S. post-consumer MSW containers and packaging across all channels. Labeled national context only, never ecommerce parcel data. 1 9 |
| Kim, Kang, and Chun 4.8-times and 3.4 kg spending comparison | Korea, 2010 to 2015 data; article 2022 | Spending-based online versus offline estimate. Labeled Korea-specific, not causal proof for every parcel and not a U.S. benchmark. 2 |
| At-least-30% air figure | Swedish case research, data collected 2020 to 2021; article 2022 | An internal estimate from the focal logistics provider in a qualitative case. Labeled nonrepresentative, not a benchmark. 3 |
| FTC 60% facility-access qualification and tradeoff guardrail | 2012 guidance | U.S. environmental-marketing guidance, not a lifecycle assessment or recycling rate. 4 |
| Carrier dimensional-weight references | Page dates not shown | Carrier- and rate-specific operating rules. Used only to explain why external volume can affect billable weight. 6 7 |
| Worked-example values | Hypothetical | Verified arithmetic only. Explicitly not a measured parcel or benchmark. |

The parcel audit is proposed only. No parcels were bought, weighed, dimensioned, photographed, or analyzed by Branvas for this article.
To run a real audit, the team needs a predeclared sampling plan across apparel, accessories, beauty, and home goods; a documented purchase period and geography; a calibrated scale; a consistent free-space measurement medium and method; component-level recording for product, primary and secondary packaging, void fill, labels, and tape; parcel photos with personal information obscured; external and internal capacity measurements; a damage and returns observation plan; and a publication-ready dataset that lists exclusions, uncertainty, formulas, material notes, and sample counts by category.
The strongest unavoidable evidence limit is that no consulted source provides a reliable U.S.-wide ecommerce packaging-to-product ratio, packaging share of delivery weight, or universal void-space percentage. The article therefore avoids converting national MSW totals, a Korean spending study, or a Swedish case estimate into a universal parcel statistic.