Score any ecommerce niche from 1 to 10 using Google Trends slope, Meta Ad Library density, and SERP domain rating to determine if it's too crowded to enter profitably.
Published:
September 30, 2026
Author:
Yi Cui
Enter a niche. Get a 1–10 saturation score based on Google Trends slope, ad-library density, and SERP competition.
The promise of a 1–10 saturation score sounds like a magic bullet. But before we get to the math, we need to clear the air. "Saturated" is the most misused word in ecommerce.
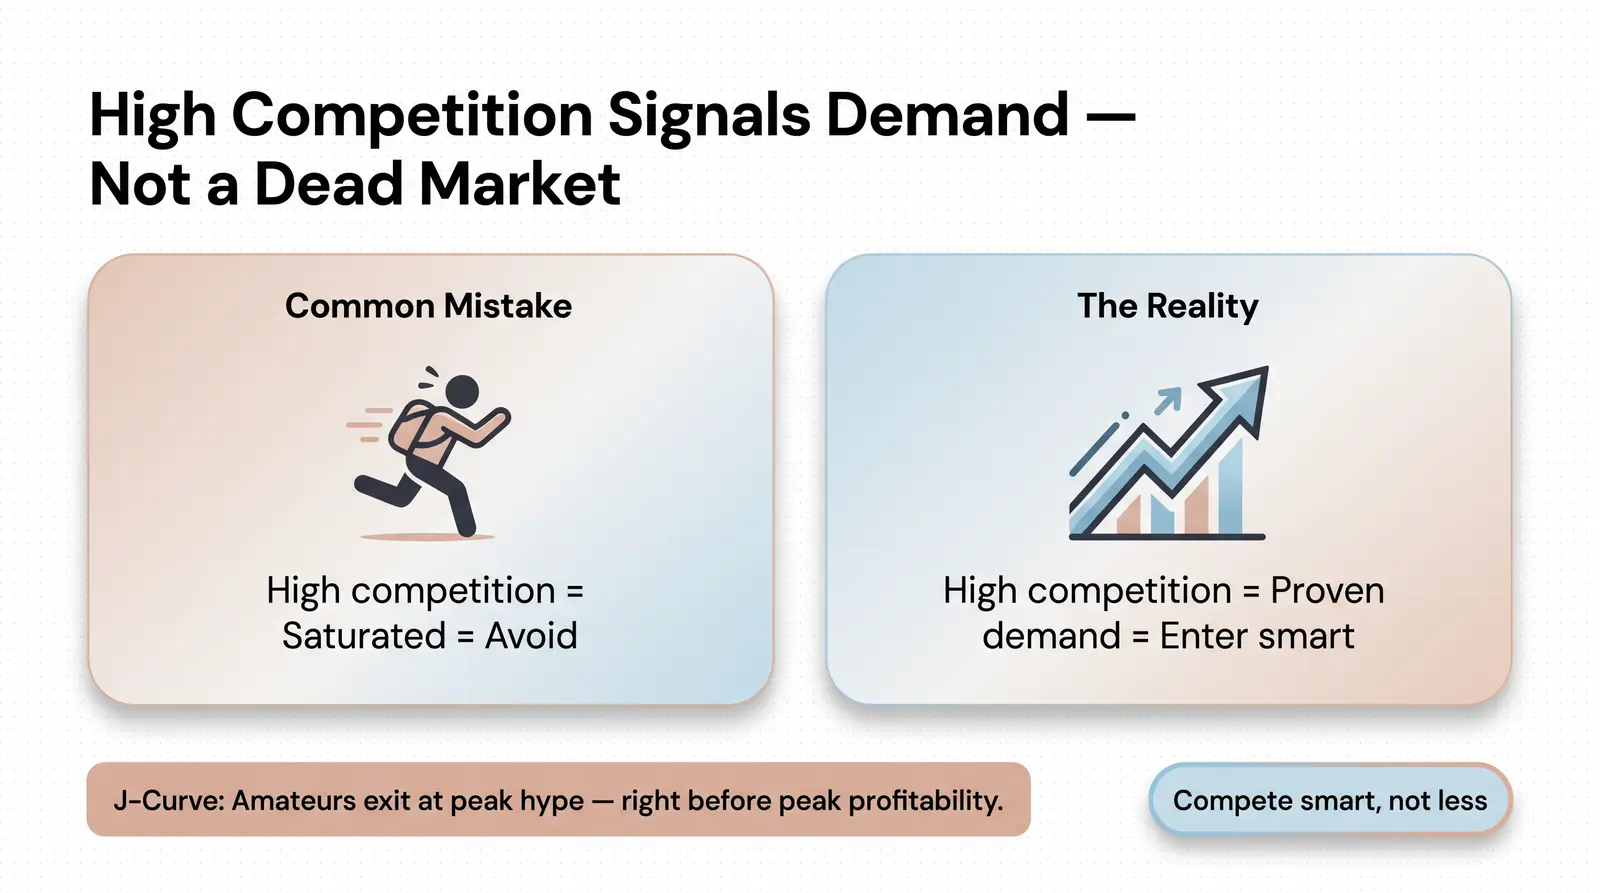
Most new sellers look at high search volume and high competition, declare a niche "saturated," and run away. This is a critical mistake. High saturation scores on broad keywords often signal a healthy, proven market, not a dead one. The mistake is trying to compete head-on for the broad keyword, rather than entering the market intelligently. As noted by industry experts, targeting niches cuts competition and improves performance in saturated markets [1]. Competition validates demand. If no one is selling it, no one is buying it.
This misunderstanding is tied to the J-curve adoption model. In business, the J-curve describes an initial dip in performance or profitability followed by exponential growth [2]. In ecommerce niche adoption, niches often look saturated at peak hype. The market floods with amateur dropshippers. Profitability dips as ad costs soar. But then, the hype cools. The amateurs exit the niche right before it hits peak commercial viability and stabilizes. Those who stick around, or enter post-hype with a differentiated brand, ride the upward slope of the J-curve to profitability.
You cannot measure saturation with gut feeling. You need data. These three signals provide a clear, objective view of how crowded a niche really is.
Search volume tells you how many people care today. Trend slope tells you where the market is going tomorrow. A declining trend on a high-volume keyword is far more dangerous than a rising trend on a low-volume keyword.
To measure this, open Google Trends. Set your timeframe to the "Past 5 years" to see the macro trajectory and identify seasonal cycles. Then, zoom in to the "Past 90 days" to check immediate momentum. You are looking for sustained upward momentum, not short-lived viral spikes [3]. Use the "Rising" related queries filter to find breakout terms that signal brand-new product opportunities most competitors haven't discovered yet [4].
The Meta Ad Library is your window into competitor ad spend. Search the library for your primary niche keyword. Count the active ads. But don't just count—analyze.
Note the creative diversity. If you see dozens of different angles, formats, and high-production videos, the market is mature and saturated. If you see only a few basic image ads or repetitive copy, the niche is early or underserved. Look at the start dates. Ads running for months are likely profitable, as advertisers don't keep paying for what doesn't convert [5].
Organic search reveals the structural barrier to entry. Use a free SEO tool like Ahrefs Free Keyword Checker to pull the Domain Rating (DR) of the top 10 organic results for your primary niche keyword.
If the average DR of the top 10 results is over 60, you are facing a high barrier to entry dominated by established brands. If the average DR is under 40, the SERP is vulnerable, signaling an opportunity for a new, optimized store to rank and capture organic traffic [6].

To move from observation to action, we developed The Branvas NSS (Niche Saturation Score) Framework. This proprietary model synthesizes demand momentum, ad pressure, and organic barriers into a single, actionable metric.
Here is the scoring rubric. Evaluate your niche across these three signals and assign a score from 1 to 10 for each.
| Signal | Weight | Score Range | What It Measures |
|---|---|---|---|
| Google Trends Slope | 35% | 1–10 (1 = Rising fast, 10 = Declining fast) | Demand momentum |
| Meta Ad Library Density | 35% | 1–10 (1 = Few ads/angles, 10 = High volume/diverse angles) | Competitive ad pressure |
| SERP Top-10 Avg DR | 30% | 1–10 (1 = Avg DR < 30, 10 = Avg DR > 70) | Organic barrier to entry |
Once you have your three scores, apply the formula:
NSS = (Trends Score × 0.35) + (Ad Density Score × 0.35) + (SERP DR Score × 0.30)
Use this composite score interpretation table to determine your next move:
| Composite NSS | Interpretation | Recommended Action |
|---|---|---|
| 1–3 | Emerging / Untapped | Move fast; validate demand first |
| 4–5 | Growing / Competitive | Viable with differentiation |
| 6–7 | Maturing / Crowded | Sub-niche or reposition |
| 8–10 | Saturated / Dominated | Avoid unless strong brand moat |

Let's run the NSS Framework on the niche "minimalist jewelry." The global minimalist jewelry market was valued at $3.8 billion in 2025 and is projected to grow steadily [7]. But is it too saturated for a new seller today?
Calculation:
NSS = (4 × 0.35) + (8 × 0.35) + (9 × 0.30)
NSS = 1.4 + 2.8 + 2.7 = 6.9
Interpretation:
With an NSS of 6.9, "minimalist jewelry" is Maturing / Crowded. A new seller should not launch a generic "minimalist jewelry" store. Instead, they must sub-niche into something like "dainty gold minimalist necklaces for bridesmaids" or "waterproof minimalist jewelry," where the ad density and SERP barriers are lower.

As the J-curve model shows, niches often look saturated at peak hype but have a second commercial wave post-hype when amateur sellers exit. Saturation is not binary; it is a spectrum.
When you hit a high NSS score, do not abandon the market entirely. Instead, use niche stacking. Layer two moderately competitive niches to create a defensible micro-niche. For example, combine "sustainable" with "minimalist jewelry" to target eco-conscious Gen Z buyers.
If your broad niche scores a 6–8, look for sub-niche escape valves. Dive into Google Trends "related queries," hunt for gaps in the Meta Ad Library, and find long-tail keywords where the SERP DR is lower. In our experience working with sellers launching private-label jewelry brands, we consistently see founders abandon niches scoring 6–7 when a targeted sub-niche — with a score of 4–5 — was sitting one level down.

Do not spend a dime on inventory or ads until you have run this checklist.
If you're evaluating jewelry or accessories niches specifically, Branvas's product catalog is organized by niche and trend momentum — explore the catalog before you finalize your niche decision.
Ready to launch a private-label jewelry brand in a niche you've already validated? Branvas handles sourcing, branding, and fulfillment — see how it works and launch in days, not months.

1. How do I know if a dropshipping niche is too saturated?
A niche is too saturated if it scores an 8–10 on the NSS Framework. This means search demand is declining, major competitors dominate the Meta Ad Library with diverse creatives, and the first page of Google is locked down by high-DR domains. In these cases, the cost to acquire a customer will likely exceed your profit margins.
2. Is Google Trends enough to evaluate niche saturation?
No. Google Trends only measures search intent and demand momentum. It tells you if people are looking for a product, but it does not tell you how fiercely competitors are fighting for those people. You must combine trend data with ad density and SERP analysis to get a complete picture of market saturation.
3. What is a good niche saturation score for a new seller?
A new seller should target an NSS between 3 and 5. This range indicates a growing market with proven demand, but where the competitive ad pressure and organic barriers are still manageable. It provides a healthy balance of opportunity and accessibility for a new brand.
4. Can a saturated niche still be profitable?
Yes. A saturated broad niche can still be highly profitable if you differentiate your brand or target a specific sub-niche. By utilizing niche stacking or finding sub-niche escape valves, you can bypass the intense competition of the broad keyword and build a profitable business serving a specific segment.
5. How often should I re-score my niche?
You should re-score your niche every quarter. Ecommerce moves fast, and competitive landscapes shift rapidly. Regular scoring helps you stay ahead of trends, monitor rising ad pressure, and adapt your strategy before your customer acquisition costs become unsustainable.