New ecommerce store owners should track behavioral and engagement metrics like bounce rate, add-to-cart rate, and cart abandonment before obsessing over revenue in their first 30 days.
Published:
July 8, 2026
Author:
Yi Cui
Early stores need learning signals before they need scale.
It is the classic ecommerce trap: you spend months sourcing products, perfecting your logo, and tweaking your Shopify theme. You finally push the store live, spend $200 on Meta ads, and then you refresh your analytics dashboard 40 times a day, panicking when the sales do not immediately roll in. You wonder if your prices are too high, if your products are wrong, or if your entire strategy is broken.
This anxiety is entirely normal. But reacting to it too quickly is where most new founders go wrong. The first month of a new ecommerce store is rarely a period of explosive growth. Instead, it is a critical diagnostic phase. Your primary goal is not to maximize revenue or Return on Ad Spend (ROAS) immediately. It is to figure out whether your website actually works and whether your target audience genuinely cares about what you are selling.
In this guide, we will break down exactly what numbers and signals you should pay attention to in your first 30 days. By tracking the right behavioral and engagement metrics, you can stop wasting money, stop panicking over the wrong things, and make smarter decisions before you attempt to scale.
Making major pivots in the first 30 days is almost always premature. Slashing prices, redesigning your homepage, or doubling your ad budget before you have enough data is like adjusting a recipe after tasting only one bite. You simply do not have enough statistical significance to act on.
If you have had 100 visitors and zero sales, that does not necessarily mean your product is bad. It might mean you reached the wrong 100 people. Or that those people need more time to consider the purchase. Or that your checkout has a friction point you have not noticed yet.
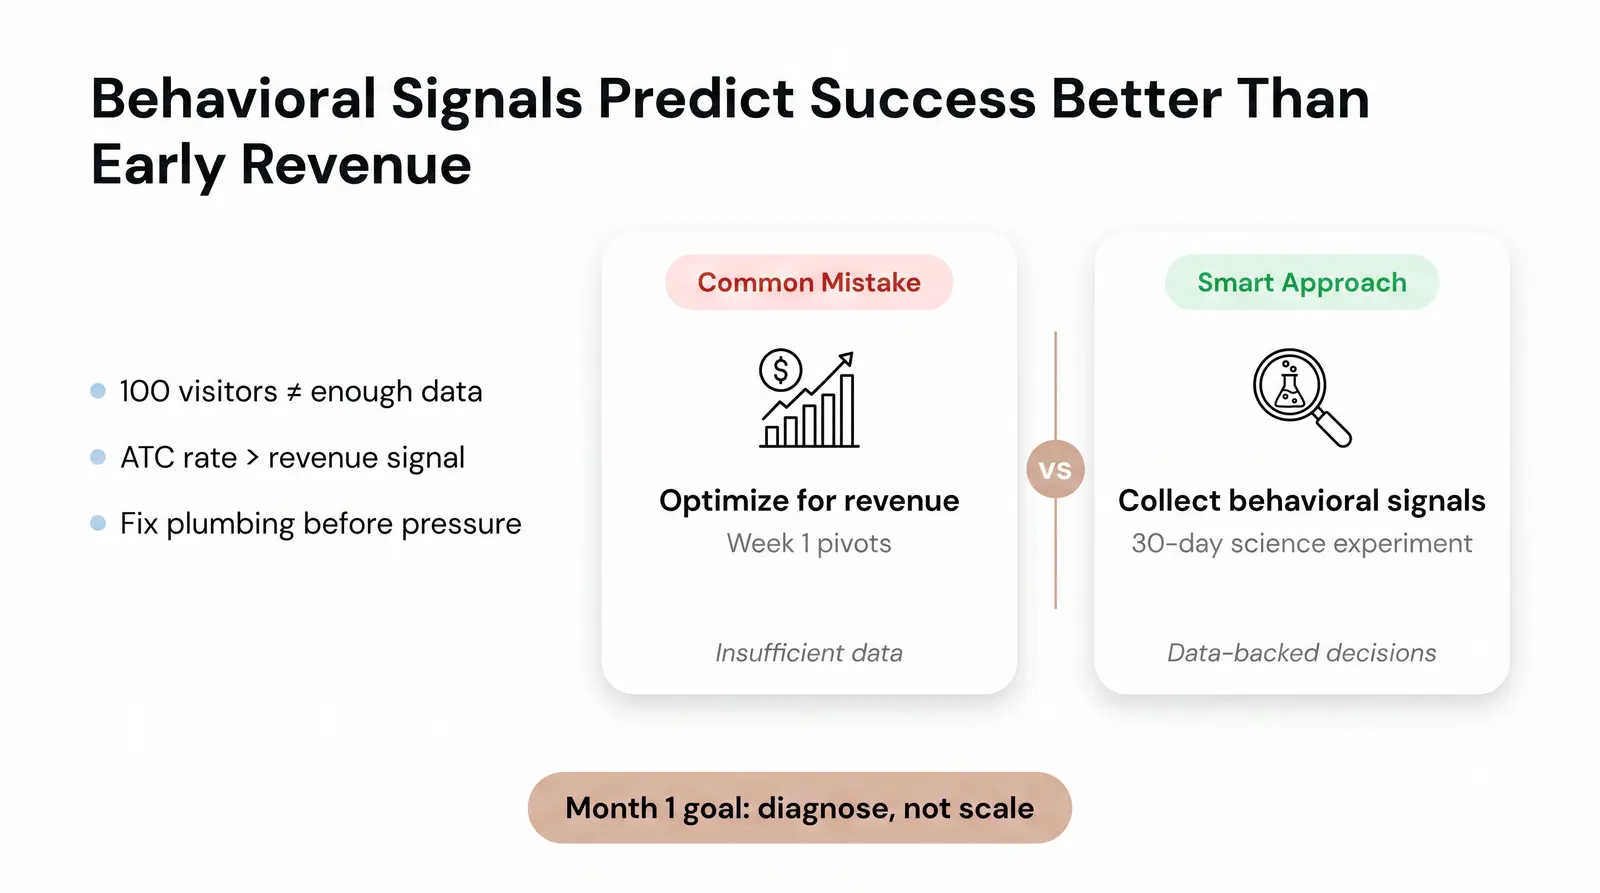
Most new store owners obsess over revenue and ROAS in week one. But behavioral and engagement signals are far more predictive of long-term success than early revenue numbers. Research in conversion rate optimization consistently shows that understanding user behavior before optimizing for revenue leads to better long-term outcomes [1]. If visitors are adding items to their carts and spending three minutes on your site, that is a strong signal of product-market fit, even if they have not checked out yet.
At Branvas, we work with dozens of new brand founders each month, and the ones who struggle most in month two are almost always the ones who made sweeping product or ad changes in week three based on insufficient data.
Think of your first 30 days as a science experiment. You are collecting data, not drawing conclusions. You need to know if the plumbing works before you turn the water pressure up to maximum.
To help founders separate vanity metrics from actionable data, we developed the Branvas Launch Signal Framework™. This is our internal model for evaluating new store health in the first 30 days. It uses a three-layer signal stack that moves from the top of the funnel down to the point of purchase.
Layer 1 — Traffic Quality Signals: Are the right people arriving?
Layer 2 — Engagement and Intent Signals: Are they interested enough to consider buying?
Layer 3 — Conversion and Customer Signals: Are early buyers telling you something meaningful?
For each layer, the table below outlines the specific metrics to track, what healthy looks like at 30 days, and what red flags to watch for. Benchmark ranges are sourced from Shopify, Littledata, Blend Commerce, and Baymard Institute data. Note that ranges vary by niche: high-ticket jewelry will naturally have lower conversion rates than low-cost accessories, for example.
| Signal Layer | Metric | What to Measure | Healthy Range (30-Day Benchmark) | Red Flag |
|---|---|---|---|---|
| Layer 1: Traffic Quality | Bounce Rate | Percentage of visitors who leave without clicking or interacting. | 36% to 47% [2] | Above 60%: poor ad targeting or slow page load speed. |
| Layer 1: Traffic Quality | Average Session Duration | How long visitors stay on your site per visit. | 1.5 to 3 minutes [3] | Under 60 seconds: low intent or irrelevant traffic. |
| Layer 1: Traffic Quality | Traffic Source Mix | Breakdown of organic, direct, social, and paid traffic. | No single source above 80% of total | Over-reliance on one paid channel creates fragile growth. |
| Layer 2: Engagement and Intent | Add-to-Cart (ATC) Rate | Percentage of sessions where a visitor adds at least one item to their cart. | 4% to 8% [4] | Below 2%: pricing, product imagery, or copy issues. |
| Layer 2: Engagement and Intent | Product Page Views Per Session | How many product pages a visitor views before leaving. | 2 to 4 pages per session | 1 page per session: low browsing interest or poor site navigation. |
| Layer 2: Engagement and Intent | Email Opt-in Rate | Percentage of visitors who subscribe to your list. | 1% to 3% | Below 0.5%: your offer or pop-up timing needs work. |
| Layer 3: Conversion and Customer | Cart Abandonment Rate | Percentage of shoppers who add items to cart but leave before purchasing. | 65% to 75% [5] | Above 85%: checkout friction, surprise shipping costs, or trust gaps. |
| Layer 3: Conversion and Customer | Ecommerce Conversion Rate | Percentage of total sessions that result in a completed order. | 1.4% to 2.5% [6] | Below 0.5%: fundamental trust or offer issues to investigate. |
| Layer 3: Conversion and Customer | Checkout Initiation Rate | Percentage of cart adds that proceed to checkout. | 40% to 60% | Below 30%: your cart page or shipping policy is creating hesitation. |

When the dashboard is full of numbers, it is easy to fixate on the wrong ones. Here are four metrics that new founders obsessively watch, why they are misleading in the first 30 days, and what to track instead.
1. Total Revenue
It is natural to want to see money coming in. But total revenue in the first 30 days is largely a function of how much traffic you bought, not how good your store actually is. Many new Shopify stores generate under $1,000 in their first month [7]. That is not a failure. It is a baseline.
What to track instead: Add-to-Cart Rate. If people are adding items to their carts, the desire is there. You can fix checkout friction. You cannot easily manufacture desire that is not there.
2. Return on Ad Spend (ROAS)
If you are spending $10 a day on ads, your ROAS will swing wildly based on a single purchase or non-purchase. The ad algorithms have not had enough time or data to learn who your ideal customer is. Early ROAS is volatile and largely meaningless at small budgets.
What to track instead: Cost Per Click (CPC) and Click-Through Rate (CTR). These tell you whether your ad creative and targeting are resonating with the right audience, regardless of whether those visitors have converted yet.
3. Follower Count
Having 5,000 Instagram followers feels like social proof, but followers do not pay the bills. Organic reach on most platforms is heavily restricted, meaning only a small fraction of your followers will ever see any given post.
What to track instead: Email and SMS subscriber rate. An email address is a direct line to a potential customer that you own and control. Track how many site visitors are opting into your welcome sequence.
4. Unsegmented Page Views
Seeing "1,000 visitors this week" feels like momentum. But if 800 of those visitors bounced immediately from a poorly targeted ad, that traffic is noise, not signal.
What to track instead: Session Duration by Traffic Source. Break down which channels (organic search, social, paid, direct) are sending visitors who actually stay on the site for more than two minutes. That is your quality traffic.

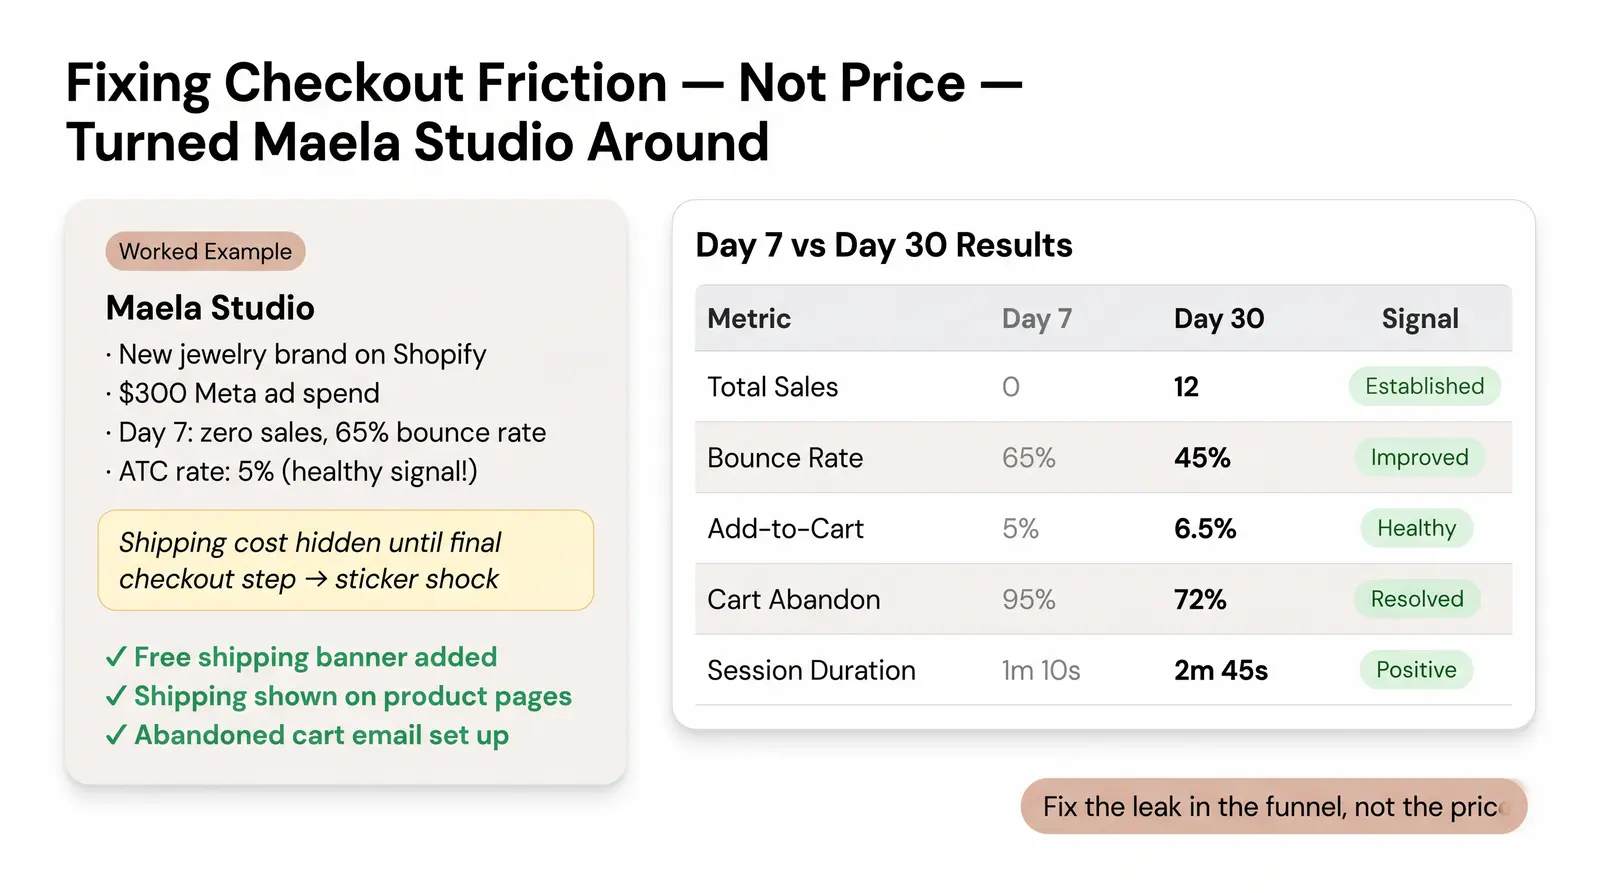
Consider Maela Studio, a new private-label jewelry brand on Shopify. The founder launched with a modest Instagram following of around 2,000 followers and $300 in initial Meta ad spend targeting women aged 22 to 35 interested in minimalist jewelry.
Day 7: Zero sales. The founder's instinct was to cut prices by 30% and scrap her ad creatives entirely. Before making any changes, she reviewed her data through the Branvas Launch Signal Framework™.
Her bounce rate was high at 65%, which was concerning. But her Add-to-Cart rate was a healthy 5%. That meant people liked the jewelry enough to put it in their carts. They just were not completing the purchase. She dug deeper and found that her shipping costs were not visible until the final checkout step, creating sticker shock at the last moment. Baymard Institute research confirms that unexpected extra costs are the number one reason shoppers abandon carts [5].
Instead of slashing prices, she added a "Free Shipping on Orders Over $50" banner to the top of every page and displayed shipping estimates directly on the product pages. She also set up an automated abandoned cart email sequence.
Day 14: Two sales came through. Her cart abandonment rate dropped from 95% to 80%. The changes were working, but she still needed more data before drawing firm conclusions.
Day 30: The picture was much clearer. Here is how her key metrics compared:
| Metric | Day 7 | Day 30 | Signal Assessment |
|---|---|---|---|
| Total Sales | 0 | 12 | Encouraging: consistent conversion established. |
| Bounce Rate | 65% | 45% | Improved: traffic quality stabilized as targeting refined. |
| Add-to-Cart Rate | 5% | 6.5% | Healthy: product-market interest is real. |
| Cart Abandonment Rate | 95% | 72% | Healthy: shipping clarity resolved the primary friction point. |
| Average Session Duration | 1 min 10 sec | 2 min 45 sec | Positive: visitors are browsing more deeply. |
By applying the framework, the founder avoided a premature price cut that would have eroded her margins and sent the wrong signal to the market. She fixed the actual leak in her funnel rather than guessing at the wrong problem. Her first 30 days were not a growth phase. They were a diagnostic phase. And she used them exactly right.
Use this checklist to stay focused on the right actions each week. Resist the urge to skip ahead.
Week 1: Setup and Foundation
Week 2: Engagement and Intent
Week 3: Friction and Feedback
Week 4: The 30-Day Review
For deeper learning on building your brand's analytics foundation, visit the Branvas Academy.

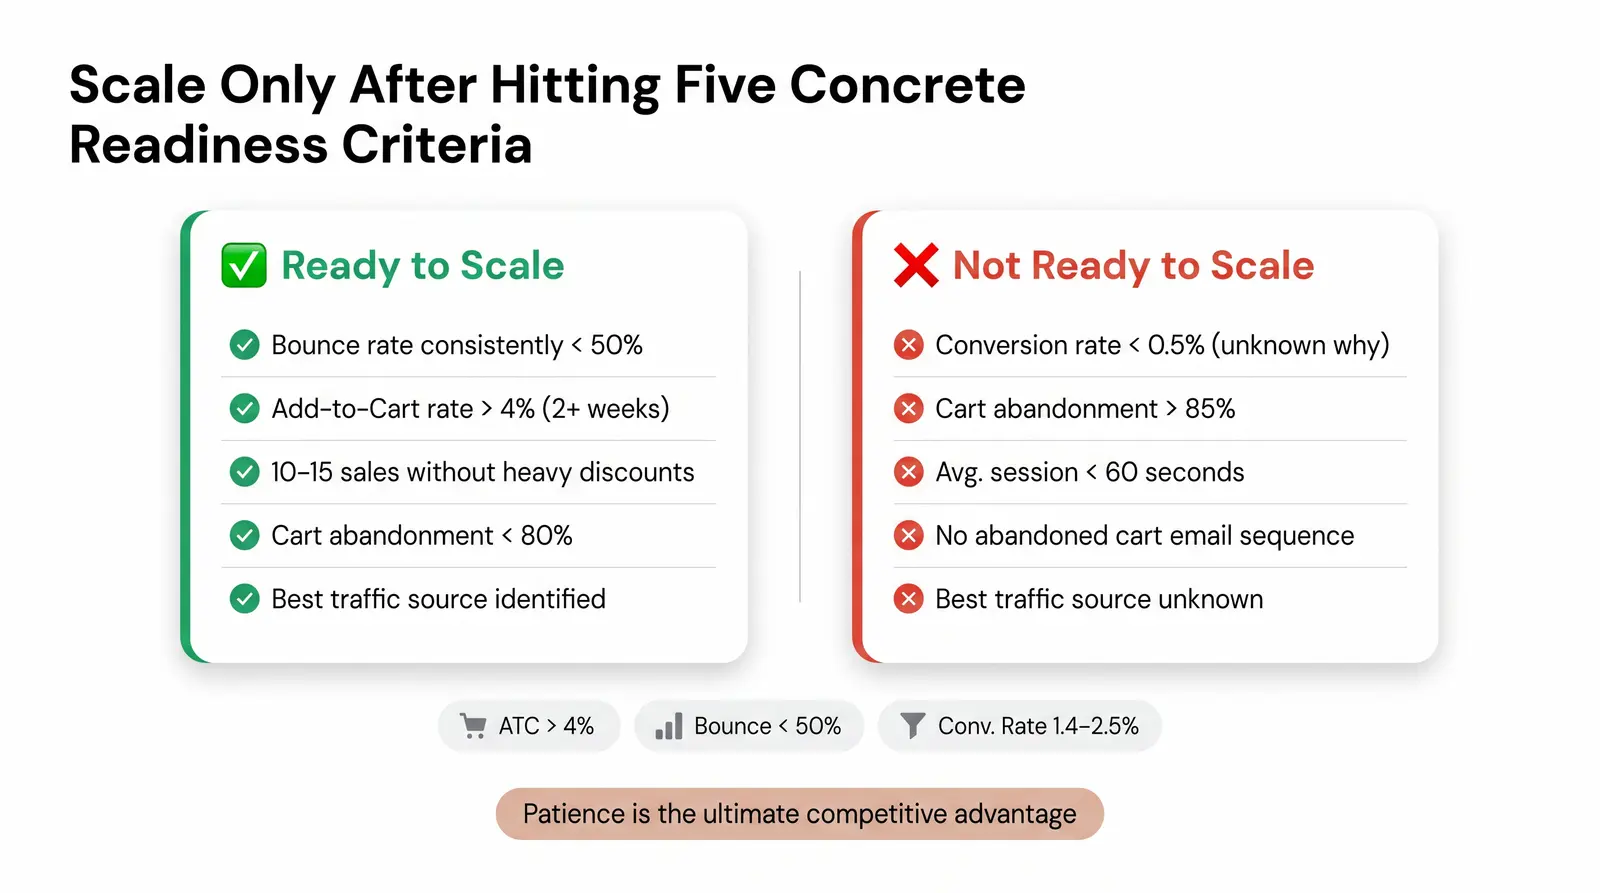
Scaling ad spend before your store is ready is one of the most common and costly mistakes early-stage founders make. Here is a clear set of criteria to help you decide.
You are ready to scale when:
You are not ready to scale when:
In our experience working with early-stage brand owners, patience is the ultimate competitive advantage. The founders who win are the ones who treat their first 30 days as a science experiment, not a lottery ticket.
If you are launching a jewelry or accessories brand and want a fulfillment and product partner that grows with you from day one, explore how Branvas works.
Launching a jewelry or accessories brand? Branvas gives you a ready-to-sell product catalog, private-label branding, and blind fulfillment, so you can focus on the metrics that matter, not logistics. See how it works →
Focus on behavioral metrics before revenue metrics. The most important signals in your first 30 days are Bounce Rate, Average Session Duration, Add-to-Cart Rate, and Cart Abandonment Rate. These four metrics tell you whether your site is functioning properly and whether visitors are genuinely interested in your products. Revenue will follow once you have confirmed that the behavioral foundation is solid. For ecommerce sellers specifically, the Branvas solutions page covers how to build a store that converts from day one.
Sales volume in the first month varies widely based on your niche, existing audience size, and ad budget. Many new Shopify stores generate under $1,000 in their first month [7], and that is completely normal. The more important question is whether your store is generating behavioral signals that indicate future conversion potential. Focus on establishing a consistent Add-to-Cart rate rather than hitting a specific revenue number. If you are a first-time founder, the Branvas aspiring entrepreneurs page offers a realistic roadmap for what to expect.
You can run small, targeted test campaigns from day one to gather traffic data, but avoid scaling your budget until you have verified your site's user experience. Specifically, wait until you have confirmed a healthy Add-to-Cart rate (above 4%), a smooth checkout flow with no major friction points, and at least a basic abandoned cart email sequence in place. Running large ad budgets into an unoptimized store is one of the fastest ways to waste money early on.
The global average ecommerce conversion rate sits between 1.4% and 2.5%, with Shopify stores typically achieving 2.5% to 3% once established [6]. New stores often start lower, around 0.5% to 1%, as they build brand trust and refine their audience targeting. High-ticket items such as fine jewelry will naturally convert at a lower rate than inexpensive impulse purchases. Rather than comparing yourself to a global average, track your own conversion rate trend over time and focus on improving it week over week.
Your store is performing well if visitors are staying for more than 90 seconds, viewing multiple product pages per session, and adding items to their carts at a rate of 4% or higher. Even if sales are slow initially, strong engagement signals indicate that your store is on the right track. You can also use your profit calculator to model whether your current conversion rate and average order value are on track to reach profitability as you scale traffic.