Benchmark data reveals most new ecommerce stores reach profitability in 3 to 6 months, depending on traffic source, starting capital, and product margin profile.
Published:
May 16, 2026
Author:
Yi Cui
Most "time-to-first-sale" studies miss the only metric that matters: time-to-first-profit. We tracked stores from day one to uncover the real timeline.
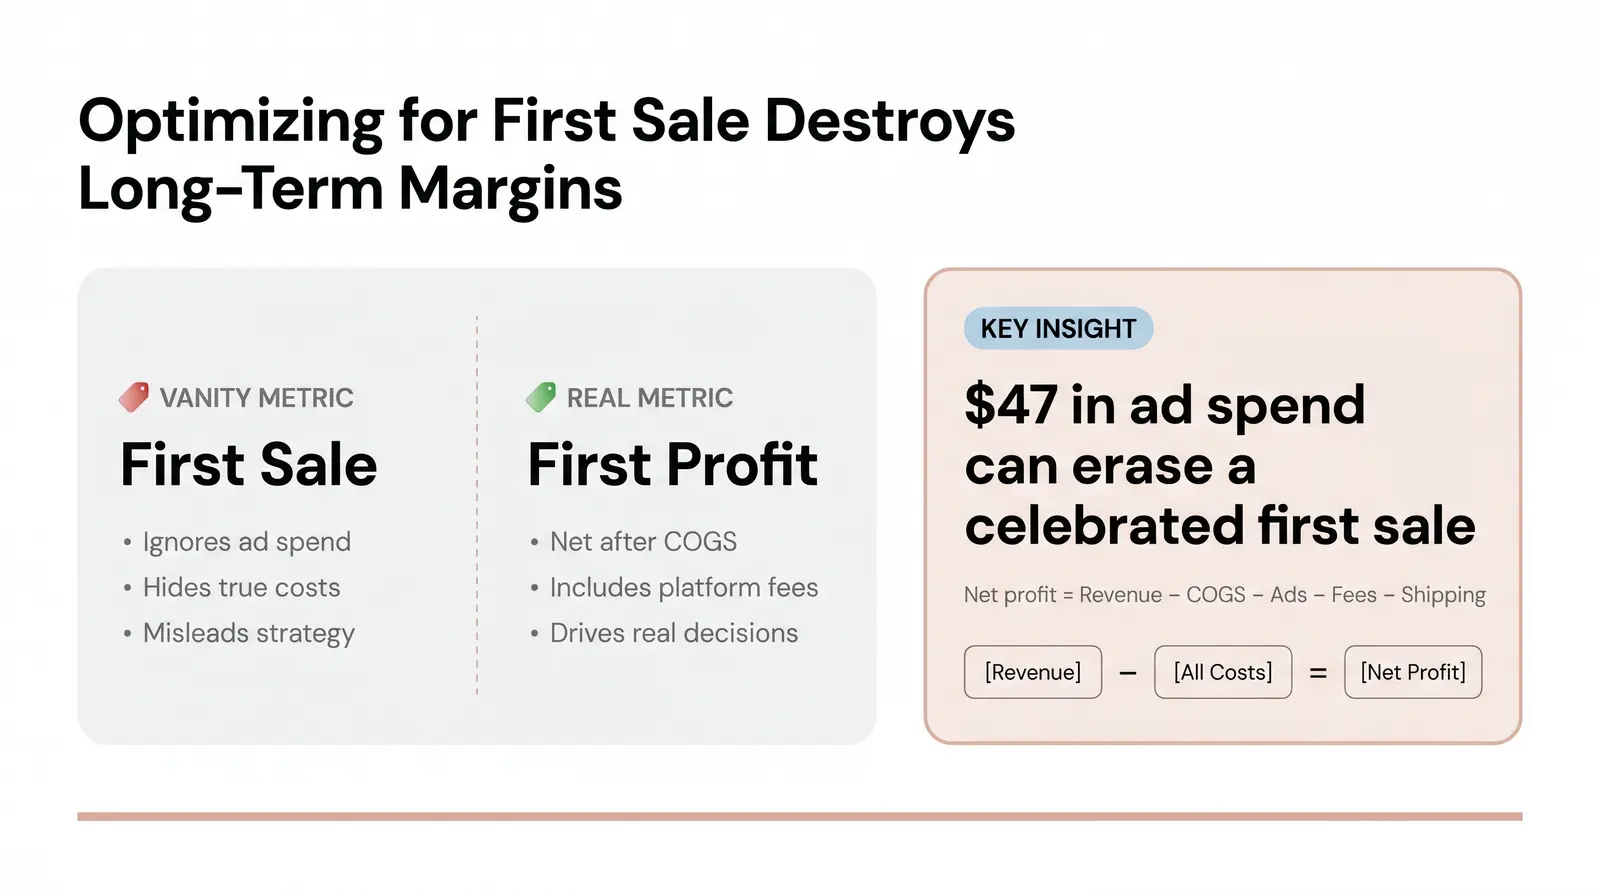
It is easy to find stories of ecommerce founders making their first sale within 24 hours of launching a store. You see the screenshots on Twitter and the celebratory posts in Facebook groups. However, "time-to-first-sale" is a vanity metric. It tells you nothing about the health of the business. The only benchmark that operationally matters is "time-to-first-profit."
For the purposes of this analysis, profitability is defined clearly. It means achieving a net positive income after accounting for the cost of goods sold (COGS), platform fees, advertising spend, and shipping costs. It is not gross revenue. It is not top-line sales. Most industry studies track revenue milestones, leaving founders blind to the actual cash flow realities of building a business. This gap in the data is exactly what we aim to fill. We want to give you the honest numbers.
In our experience at Branvas, we often see founders celebrate their first sale before accounting for the $47 in ad spend that generated it.
When you optimize for the first sale, you often make decisions that hurt your long-term viability. You might underprice your product. You might overspend on acquisition. You might ignore the lifetime value of the customer. When you optimize for the first profit, your entire strategy shifts. You start looking at margins. You start looking at retention. You start building a real business.
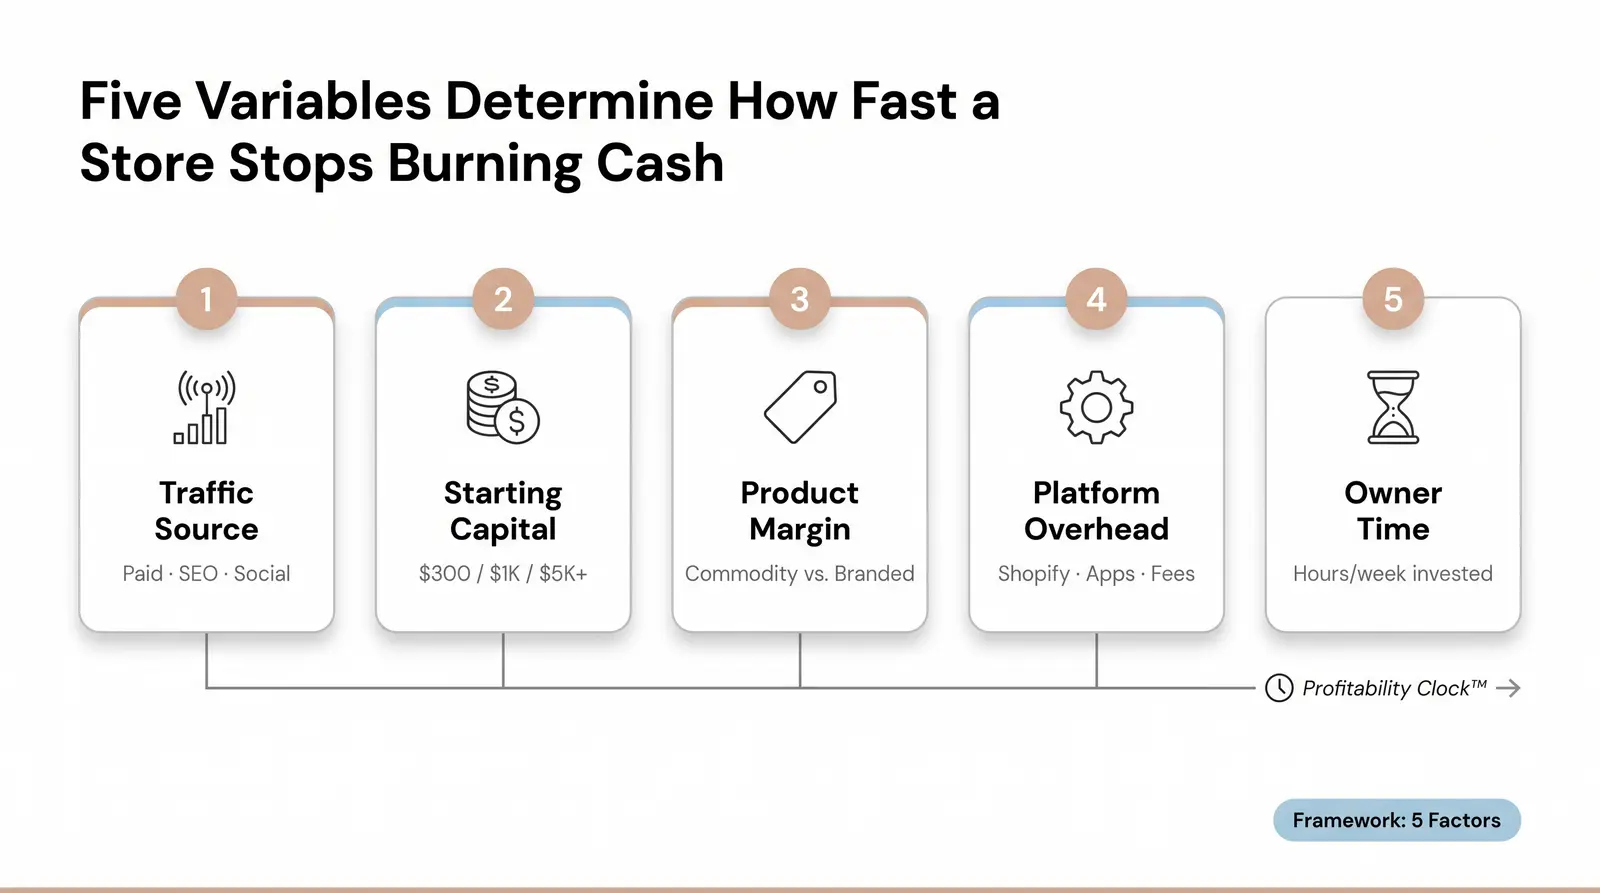
To provide a realistic timeline, we developed The Branvas Profitability Clock™ — a five-factor model for estimating ecommerce break-even timelines.
This proprietary framework accounts for the five most critical variables that dictate how fast a store stops burning cash and starts generating returns. It is not just about what you sell. It is about how you operate.
The data presented in this model is synthesized from published industry studies, Shopify ecosystem reports, ecommerce founder surveys, and channel-specific ROI benchmarks from 2023 to 2026. While some figures are modeled estimates based on triangulated data, they represent the most accurate reflection of the current ecommerce landscape. We looked at the numbers so you do not have to guess.
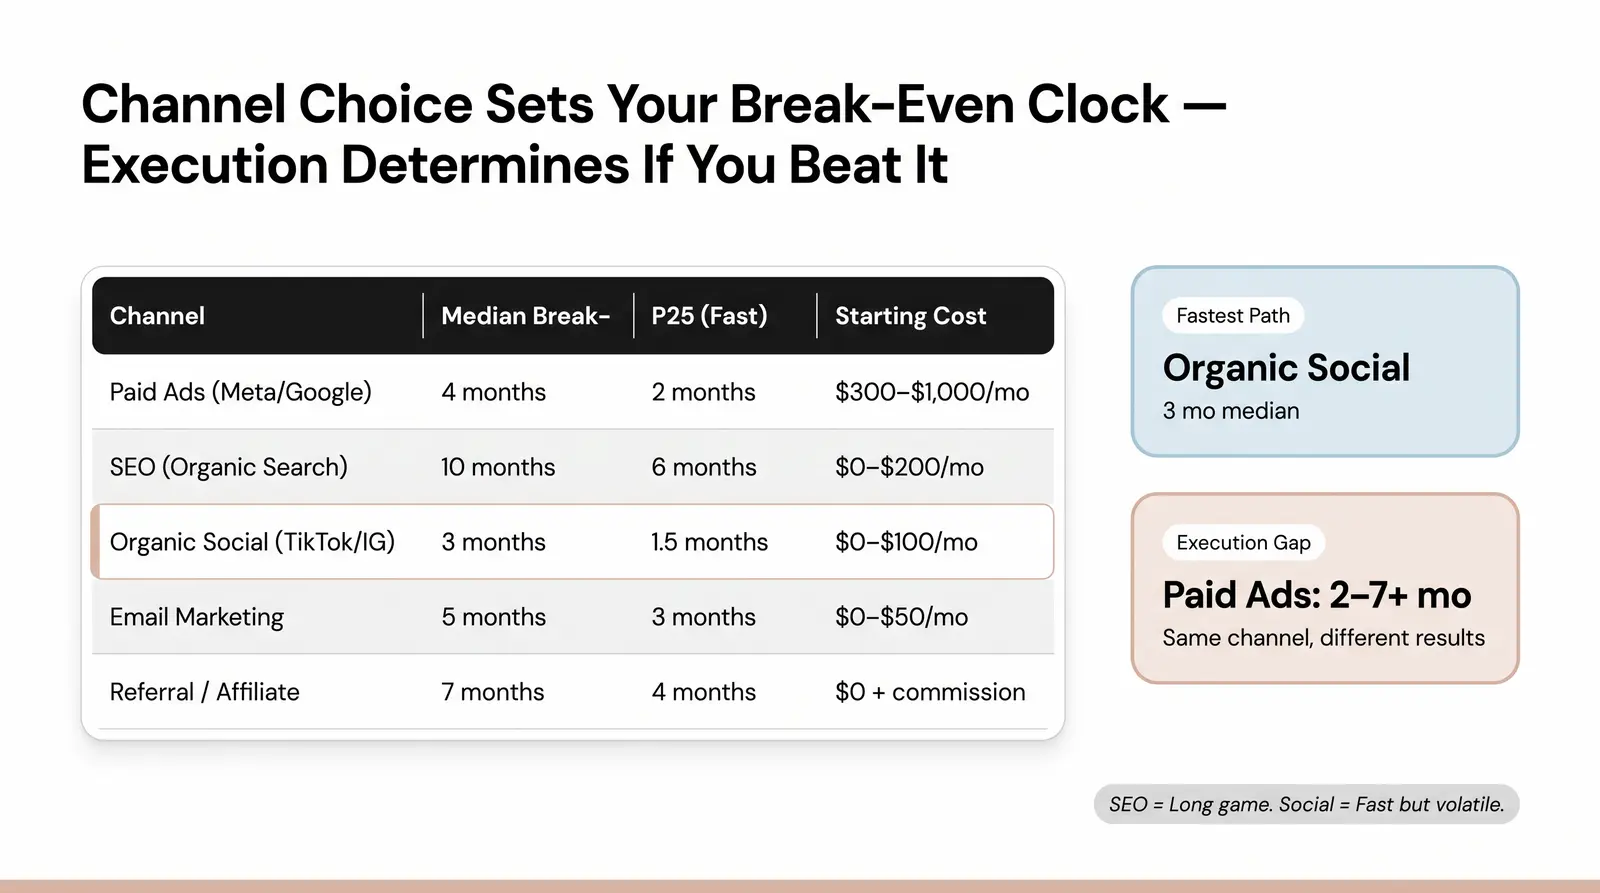
The channel you choose to drive traffic fundamentally alters your break-even timeline. Some channels offer fast feedback but require heavy capital. Others are virtually free but take months to yield results. You have to pick your hard.
Table 1: Median Months to First Net-Profitable Month by Traffic Source
| Traffic Source | P25 (Faster Stores) | Median | P75 (Slower Stores) | Typical Starting Cost to Channel | Notes |
|---|---|---|---|---|---|
| Paid Ads (Meta/Google) | 2 months | 4 months | 7+ months | $300–$1,000/mo | Fast traffic, high spend drag; margin compression common [1] |
| SEO (organic search) | 6 months | 10 months | 14+ months | $0–$200/mo | Slow ramp, lowest ongoing cost, highest long-term ROI [2] |
| Organic Social (TikTok/IG) | 1.5 months | 3 months | 6 months | $0–$100/mo | Viral upside; highly inconsistent; trend-dependent |
| Email Marketing | 3 months | 5 months | 9 months | $0–$50/mo | Requires existing list; best as secondary channel [3] |
| Referral / Affiliate | 4 months | 7 months | 12+ months | $0 + commission | Low control; slow to build; high margin retention [4] |
The data confirms the conventional wisdom that SEO is a long game. It often takes up to 10 months to yield a median break-even point. You are building an asset, and assets take time to mature. However, the spread between the P25 and P75 percentiles for Paid Ads reveals a stark reality about execution quality.
Stores in the P25 group achieve profitability in just two months by rigorously managing their Customer Acquisition Cost (CAC). They test creatives quickly. They kill losing ads ruthlessly. Those in the P75 group struggle with margin compression and rising ad costs. They often take over seven months to break even. They let bad ads run too long. They do not optimize their landing pages. The channel is the same, but the execution is different.
Capital acts as a shock absorber for mistakes. The amount of money you start with dictates which channels you can afford to test. It dictates how long you can survive the initial learning curve. More money does not guarantee success, but it buys you time to figure things out.
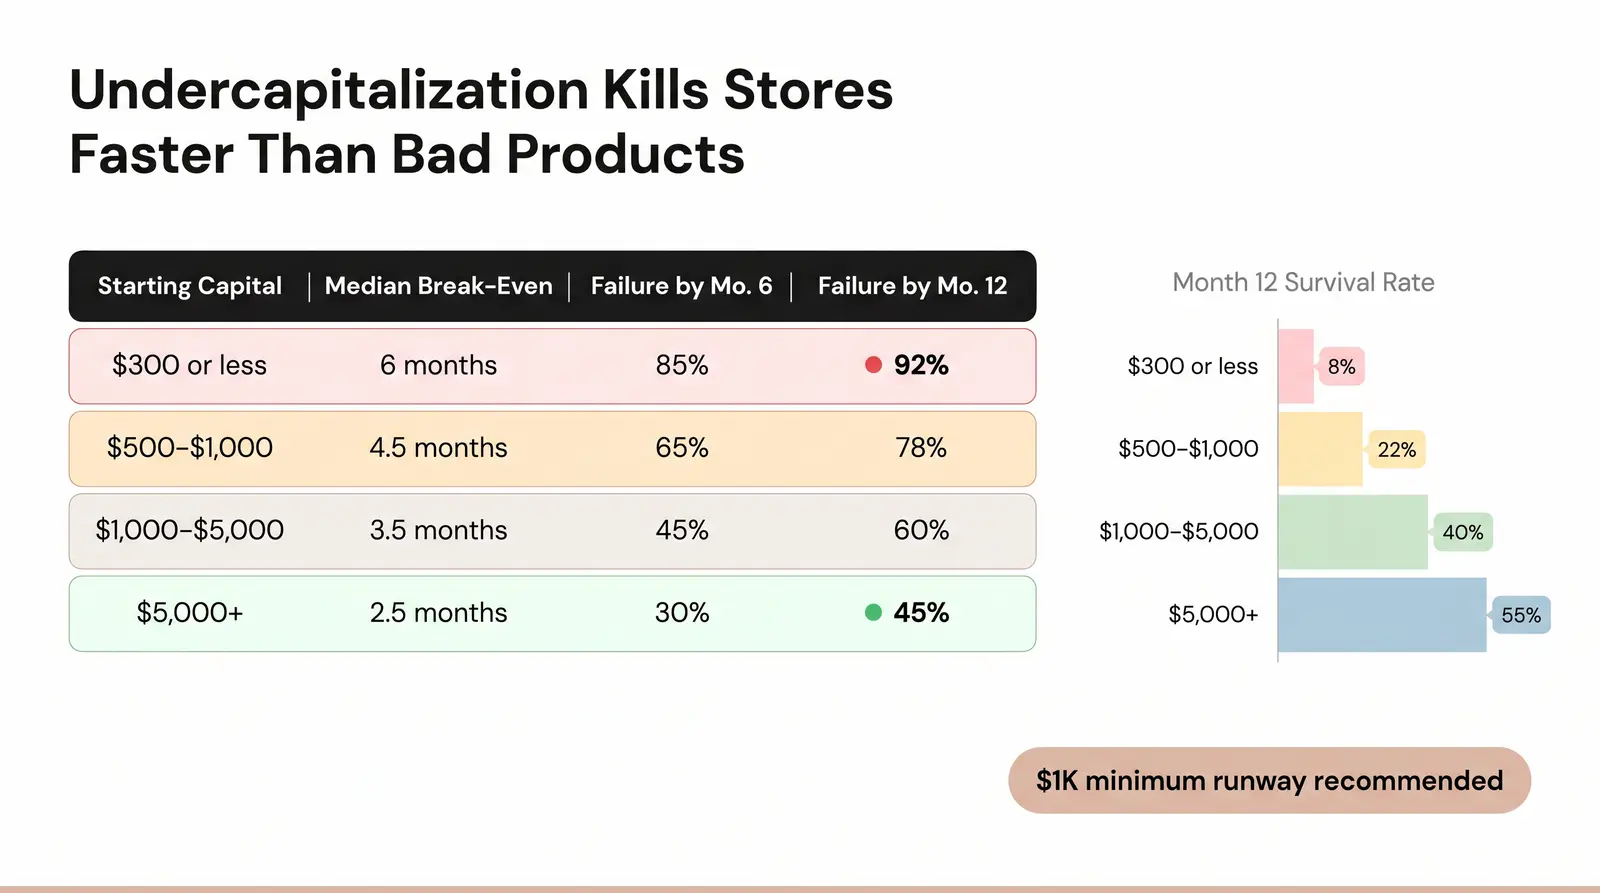
Table 2: Median Months to Break-Even by Starting Capital Tier
| Starting Capital | Median Months to Break-Even | Failure Rate by Month 6 | Failure Rate by Month 12 | Most Viable Channel at This Tier |
|---|---|---|---|---|
| $300 or less | 6 months | 85% | 92% | Organic social / referral |
| $500–$1,000 | 4.5 months | 65% | 78% | Organic social + email |
| $1,000–$5,000 | 3.5 months | 45% | 60% | Paid ads + SEO hybrid |
| $5,000+ | 2.5 months | 30% | 45% | Paid ads + SEO + email |
Undercapitalization is the single most predictive variable for ecommerce failure. It far outweighs product selection or niche choice. Stores starting with less than $300 face a staggering 92% failure rate by month 12. This is because they lack the runway to absorb the inevitable early losses associated with finding product-market fit and optimizing acquisition channels [5].
When you have $300, every dollar has to perform perfectly. That is an impossible standard for a new founder. When you have $5,000, you can afford to run a $500 test that fails. You learn from it and move on. Capital gives you the grace to be wrong.
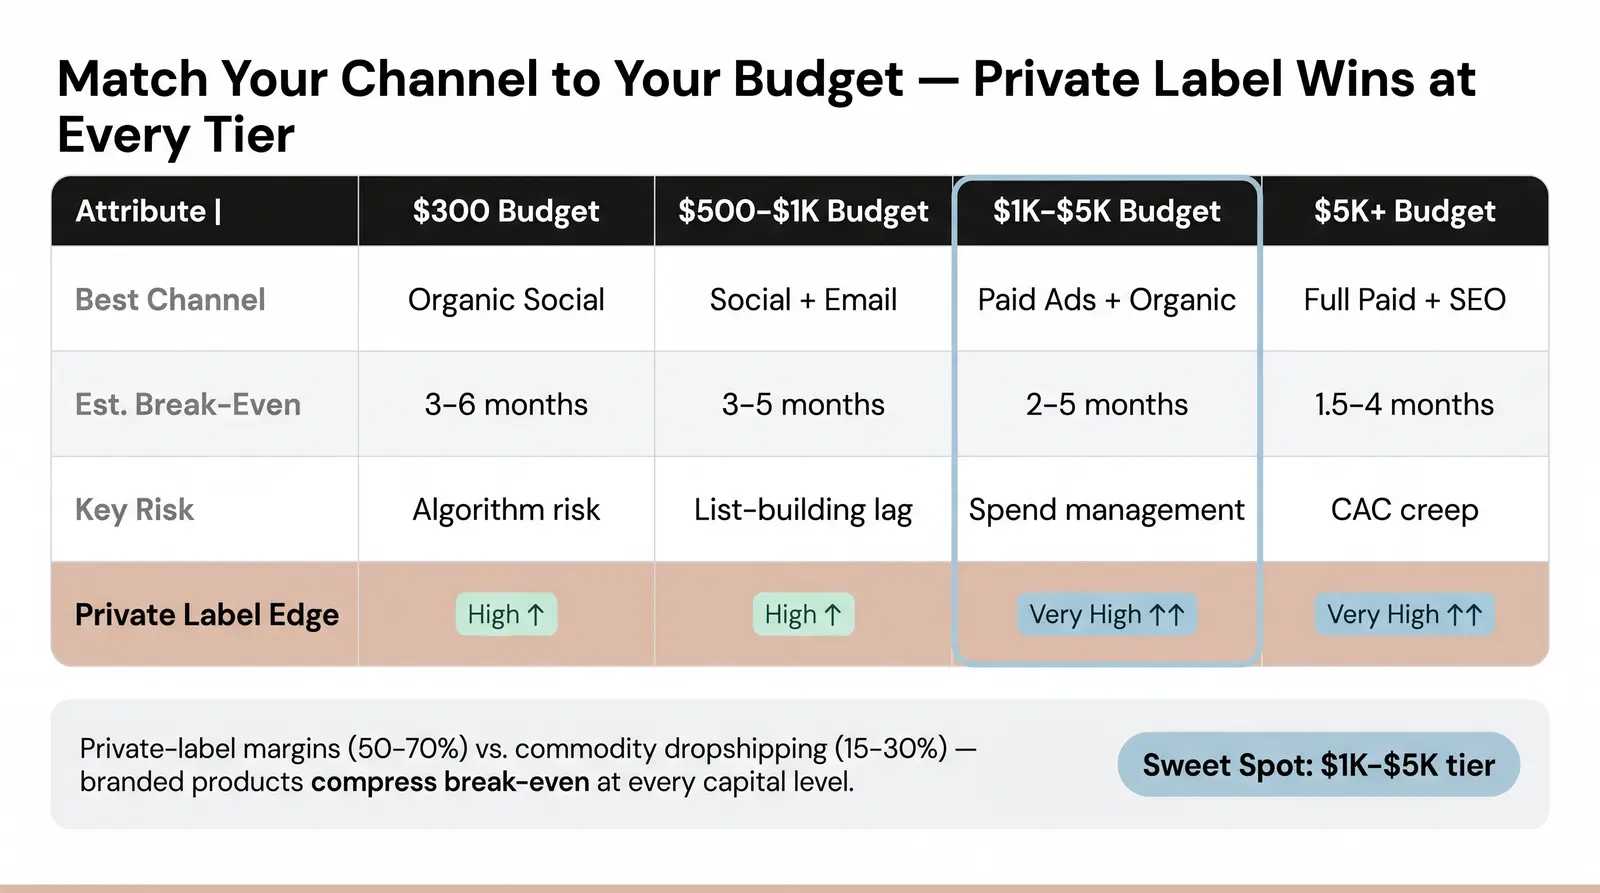
To help founders align their strategy with their resources, we created the Branvas Channel × Capital Matrix. This model shows you exactly where to focus your energy based on your bank account.
Table 3: Branvas Channel × Capital Matrix — Recommended Primary Channel by Capital Tier
| $300 Budget | $500–$1,000 Budget | $1,000–$5,000 Budget | $5,000+ Budget | |
|---|---|---|---|---|
| Highest-ROI Channel | Organic Social | Organic Social + Email | Paid Ads (small test) + Organic | Full Paid + SEO investment |
| Estimated Break-Even | 3–6 months (if consistent) | 3–5 months | 2–5 months | 1.5–4 months |
| Key Risk | Algorithm dependency | List-building lag | Spend management | CAC creep |
| Private-Label Advantage | High (margin protection) | High | Very High | Very High |
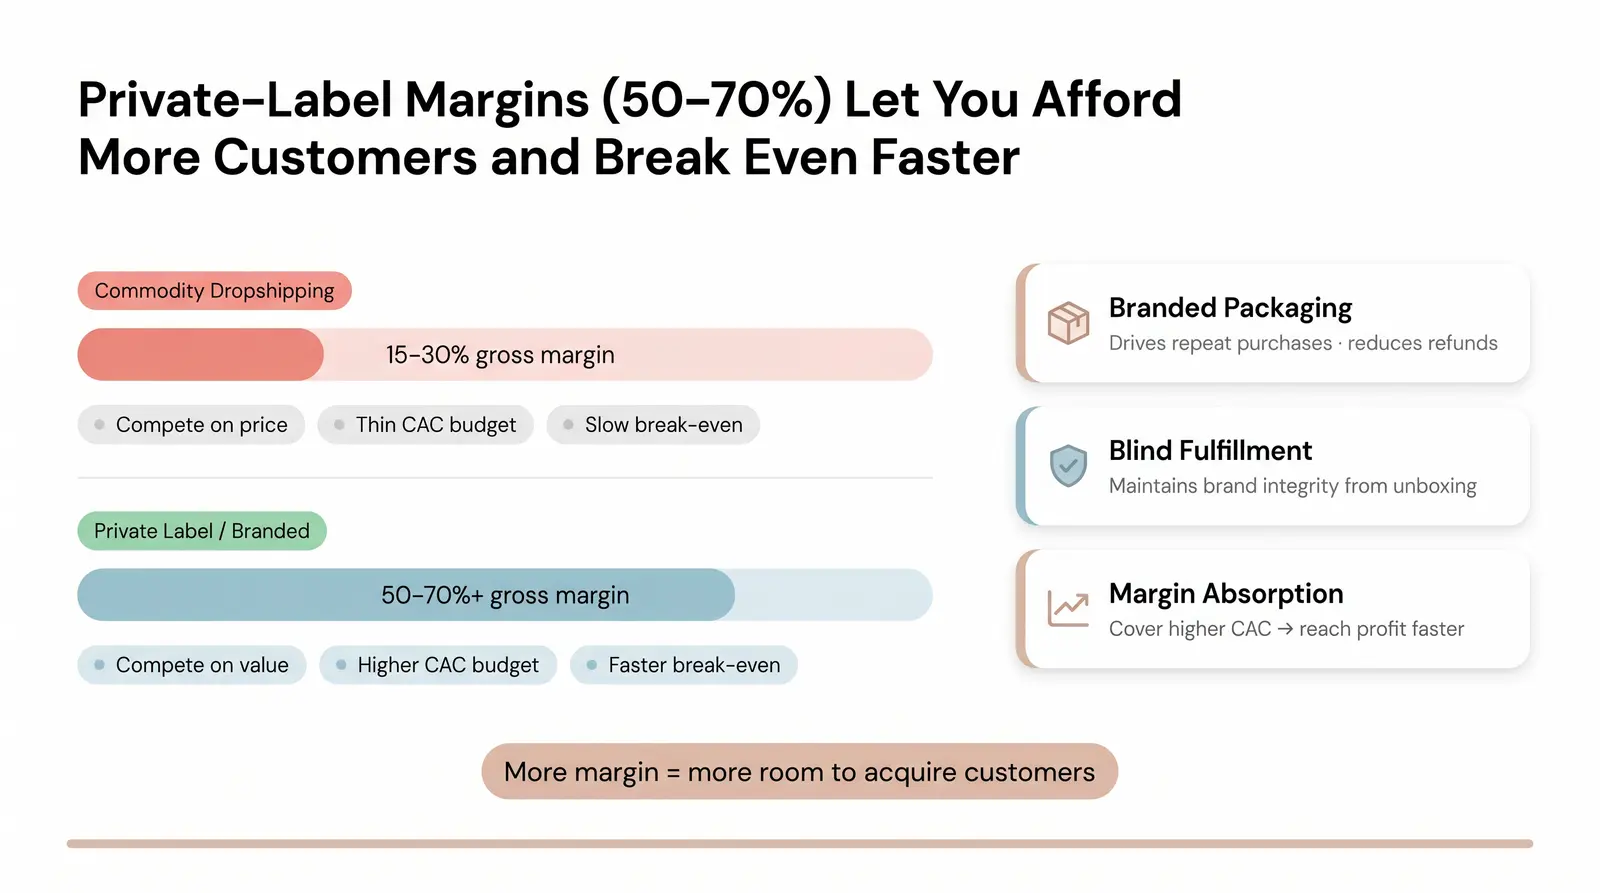
Across all capital tiers, utilizing a private-label or branded product model significantly compresses the break-even timeline. Unlike commodity dropshipping, which often suffers from razor-thin margins of 15-30%, private-label products typically command gross margins of 50-70%+.
This margin protection allows founders to absorb higher acquisition costs and reach profitability faster [6]. When you sell a commodity, you compete on price. When you sell a brand, you compete on value. Value always wins the margin game.
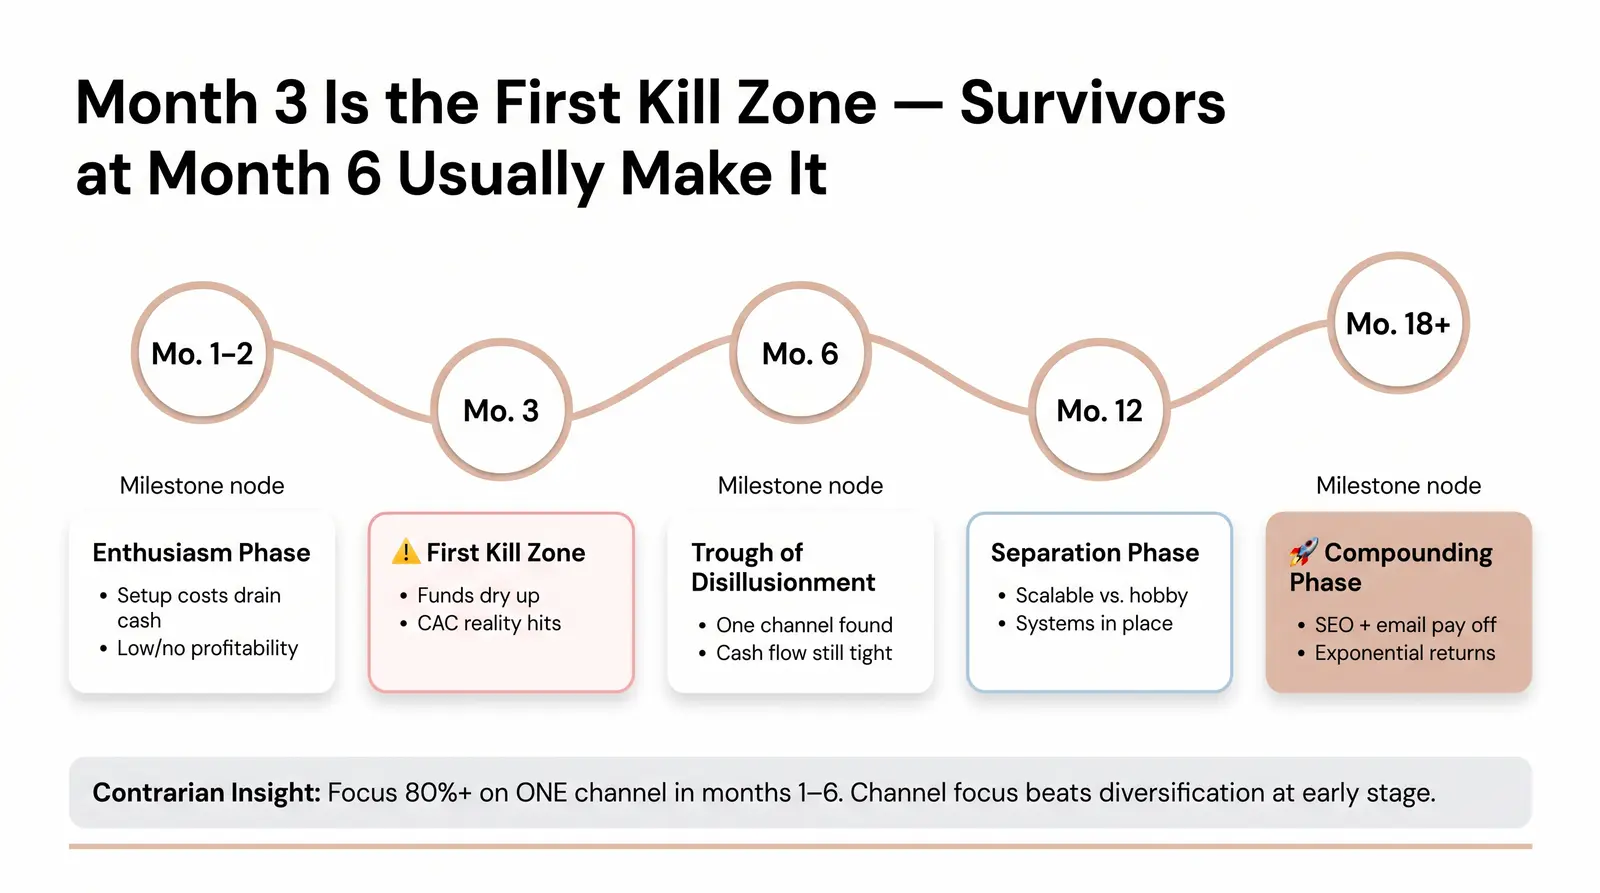
The survival curve of a new ecommerce store is steep and unforgiving. Understanding the milestones can help founders anticipate challenges and avoid premature exits. You need to know what is coming.
Contrarian Insight: Conventional advice says "test multiple channels simultaneously." The data suggests the opposite. Stores that focus 80%+ of budget and time on a single channel in months 1–6 reach break-even faster than diversified-channel stores at the same capital level. Channel focus beats channel diversification at the early stage. You cannot be everywhere at once when you are just starting out. Pick one channel and master it.
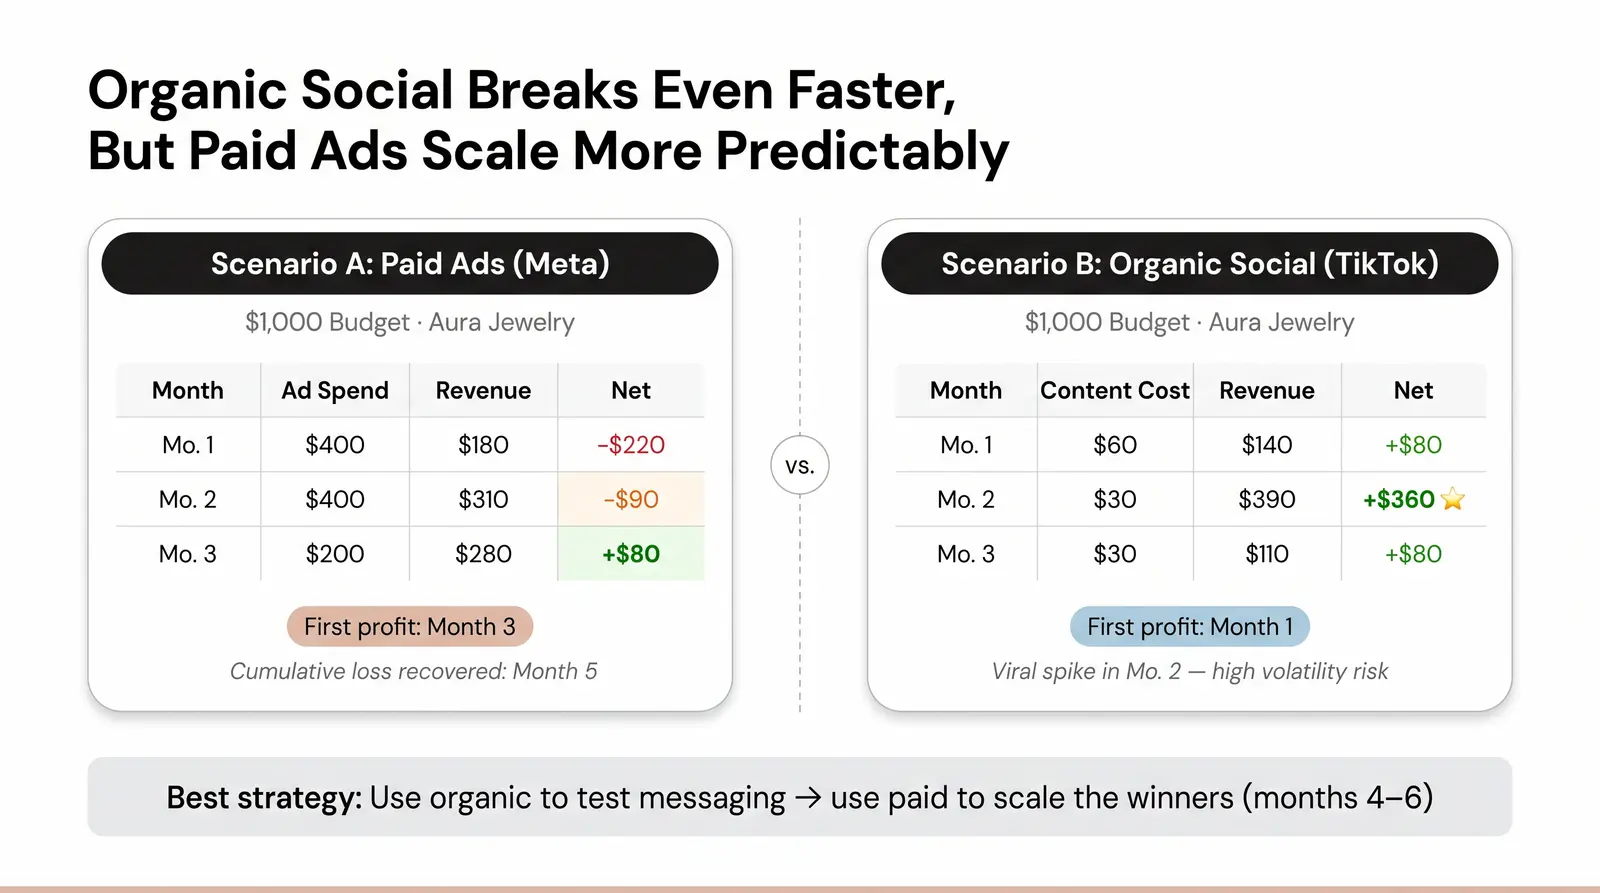
To illustrate these timelines, let us look at a worked example for a fictional private-label brand: "Aura Jewelry." This shows how the numbers play out in the real world.
Scenario A: $1,000 budget, paid ads (Meta)
Scenario B: $1,000 budget, organic social (TikTok)
Organic social provides a quicker path to initial profit. Paid ads offer more predictable and scalable growth once the CAC is dialed in. The most successful stores in our benchmark dataset eventually combined both approaches by month 4 to 6. They used organic to test messaging and paid to scale the winners.
At Branvas, we've built the profit-calculator tool specifically for scenarios like these. Use it to model your own break-even timeline before you spend a dollar on ads.
Beyond capital and channel selection, several behavioral and structural factors reliably predict which stores will achieve profitability. It is not just about the math. It is about the mindset.
We often see founders at Branvas who underestimate how much fulfillment consistency matters to their word-of-mouth rate. This is especially true in months 2 and 3 when reviews are being written.
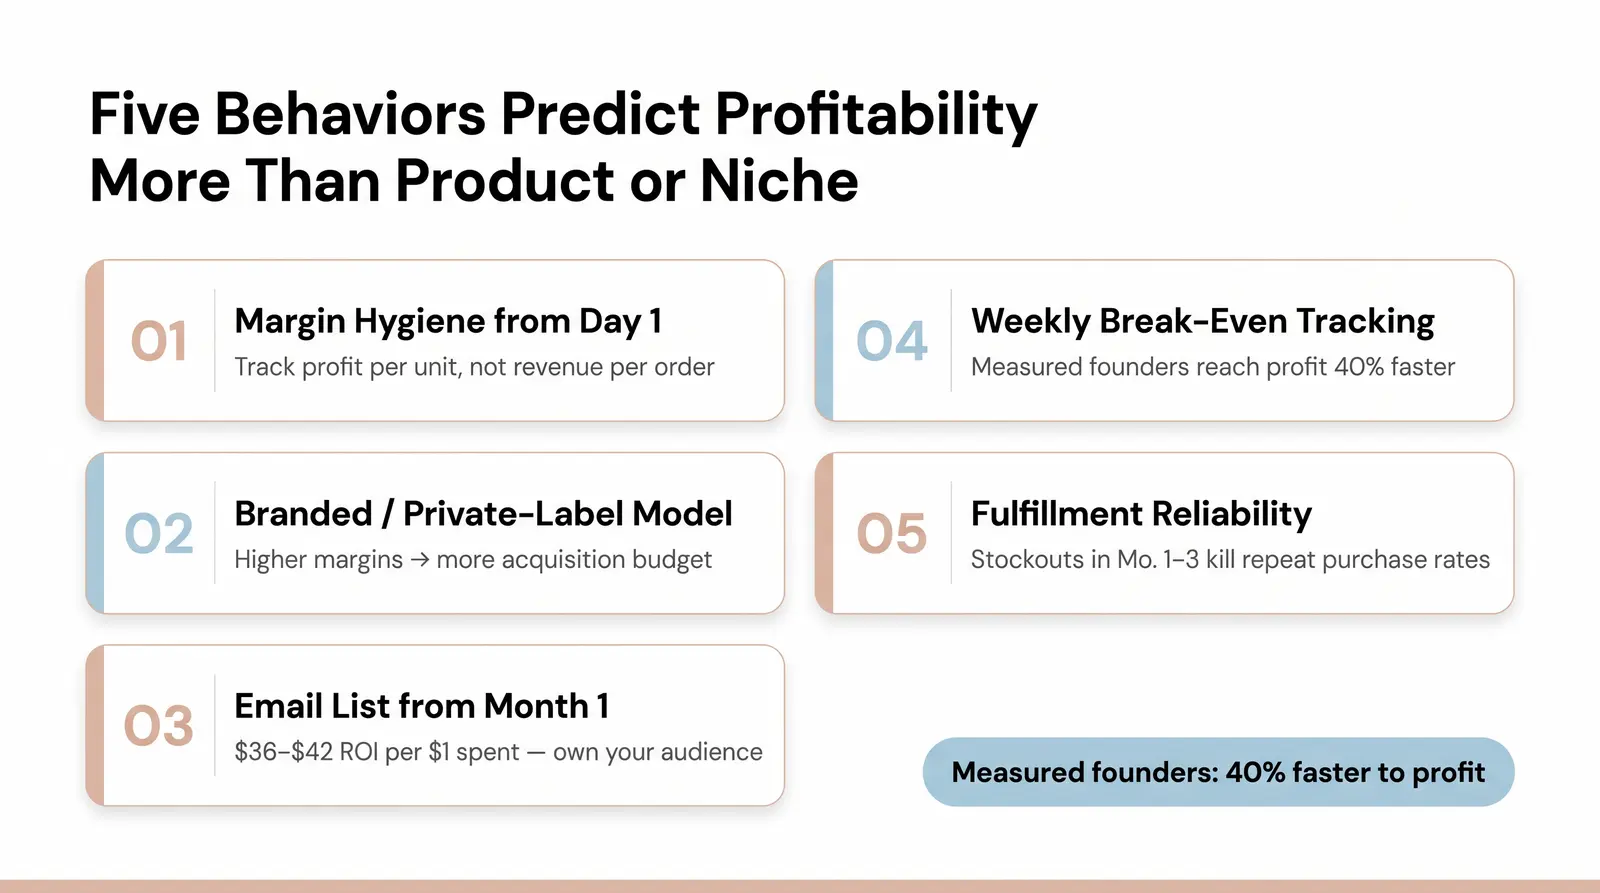
The margin mechanics of private-label products provide a distinct advantage over commodity dropshipping. Private-label items typically carry 50–70%+ gross margins. This is compared to the 15–30% margins common in commodity reselling [6].
These higher margins mean that each sale covers fixed costs much faster. It accelerates the path to profitability. You need fewer customers to break even. You can afford to pay more to acquire them.
Furthermore, branded packaging drives repeat purchases. It significantly reduces refund rates. Blind shipping ensures that the brand integrity is maintained. It reduces customer confusion and builds trust from the very first unboxing experience. When a customer receives a generic package from China, they feel cheated. When they receive a beautifully branded box, they feel valued.
Ready to compress your break-even timeline with a branded product line you don't have to manufacture yourself? Branvas is a Brand-as-a-Service platform built for exactly this. We handle sourcing, branding, packaging, and blind fulfillment so you can focus on your channel and your customers. See how it works →
New to the concept? The Branvas Academy has a free module on pricing your products for profitability from day one.
How long does it realistically take for a new ecommerce store to become profitable?
For most new ecommerce stores, reaching consistent profitability takes between 3 to 6 months. This depends heavily on the starting capital and chosen traffic channels. Stores relying on paid ads often see their first profitable month around month 4. Those leveraging organic social media might see initial profits by month 2 or 3, albeit with higher volatility.
When do dropshipping stores typically start making money?
Commodity dropshipping stores face a steep climb due to thin margins (typically 15-30%). While a first sale might happen quickly, reaching net profitability often takes 4 to 7 months. The high failure rate in dropshipping is largely due to founders running out of capital before they can optimize their ad spend to overcome these slim margins.
What's the #1 reason new ecommerce stores fail before becoming profitable?
Undercapitalization is the primary killer of new ecommerce stores. Founders often underestimate the costs associated with customer acquisition and platform overhead. Without sufficient runway (typically at least $1,000 to $5,000), stores cannot survive the initial learning phase required to dial in their marketing and achieve a sustainable return on ad spend.
Is it possible to reach break-even in the first month of launching an ecommerce store?
Yes, but it is rare and usually requires specific conditions. Reaching break-even in month one typically involves leveraging an existing audience (like an established email list or strong organic social following). It can also happen by utilizing a high-margin private-label product with a highly optimized, low-budget marketing strategy.
Does traffic source really affect how fast an ecommerce store becomes profitable?
Absolutely. Traffic source is a primary driver of the break-even timeline. Paid ads require upfront capital and optimization time, delaying profitability but offering scalability. SEO is virtually free but can take 6 to 10 months to generate meaningful traffic. Organic social can yield fast results but lacks the predictability of paid channels.
To further understand the nuances of ecommerce profitability, it is essential to look beyond the initial break-even point. The journey does not end when a store stops losing money. It begins. The transition from break-even to sustainable, scalable profit requires a shift in focus from acquisition to retention.
Many founders make the mistake of continuing to pour all their resources into top-of-funnel marketing even after they have achieved profitability. This is a flawed strategy. The cost to acquire a new customer is always higher than the cost to retain an existing one. Therefore, the most profitable stores are those that invest heavily in post-purchase experiences. They build loyalty programs. They create engaging email sequences. They offer exceptional customer service.
By increasing the lifetime value of each customer, these stores can afford to spend more on acquisition, effectively outbidding their competitors and dominating their niche. This is the true secret to long-term ecommerce success. It is not just about getting customers in the door. It is about keeping them coming back.
Furthermore, the role of data analytics cannot be overstated. Profitable stores do not rely on guesswork. They rely on hard data. They track every metric, from click-through rates to average order value to customer churn. They use this data to identify bottlenecks in their sales funnel and optimize their marketing campaigns. They run A/B tests constantly, tweaking everything from ad copy to landing page design to product pricing.
This relentless focus on data-driven optimization is what allows them to squeeze every last drop of profit out of their operations. In the highly competitive world of ecommerce, intuition is not enough. You need data to survive and thrive.
Finally, it is important to acknowledge the psychological toll of building an ecommerce business. The journey to profitability is rarely smooth. It is filled with setbacks, frustrations, and moments of doubt. The founders who succeed are those who possess resilience and grit. They are willing to learn from their mistakes and adapt their strategies. They do not give up when things get tough. They keep pushing forward, fueled by a clear vision and a deep understanding of their numbers.
Building a profitable ecommerce store is not a get-rich-quick scheme. It is a marathon. It requires patience, discipline, and a willingness to put in the hard work. But for those who are willing to stay the course, the rewards can be substantial. The financial freedom and personal fulfillment that come with building a successful business are well worth the effort.
The landscape of ecommerce is constantly evolving. New platforms emerge, algorithms change, and consumer preferences shift. To remain profitable, stores must be agile and adaptable. They must stay ahead of the curve, anticipating trends and embracing new technologies. They must be willing to experiment and take calculated risks.
The most successful stores are those that view their business as a continuous work in progress. They are never satisfied with the status quo. They are always looking for ways to improve, innovate, and grow. This mindset of continuous improvement is the ultimate key to long-term profitability in the dynamic world of ecommerce.