Most new Shopify stores fail at four predictable stages — demand, traffic, trust, and unit economics — and this pre-mortem framework shows how to fix each one before scaling.
Published:
January 29, 2026
Author:
Yi Cui
Most new Shopify stores do not fail because Shopify is bad. They fail because the platform makes launching feel like progress before the business has proven demand, traffic, trust, margins, or repeat purchase potential.
Here is the short version of everything this article covers:
The fix is not a better Shopify app or a bigger ad budget. It is a sequenced approach: validate demand, build trust infrastructure, understand your numbers, then scale.
Search for "Shopify store failure rate" and you will find the same claim repeated across dozens of articles: 90% of stores fail within 120 days. Some sources push it to 95%. A few go all the way to 99.9%.
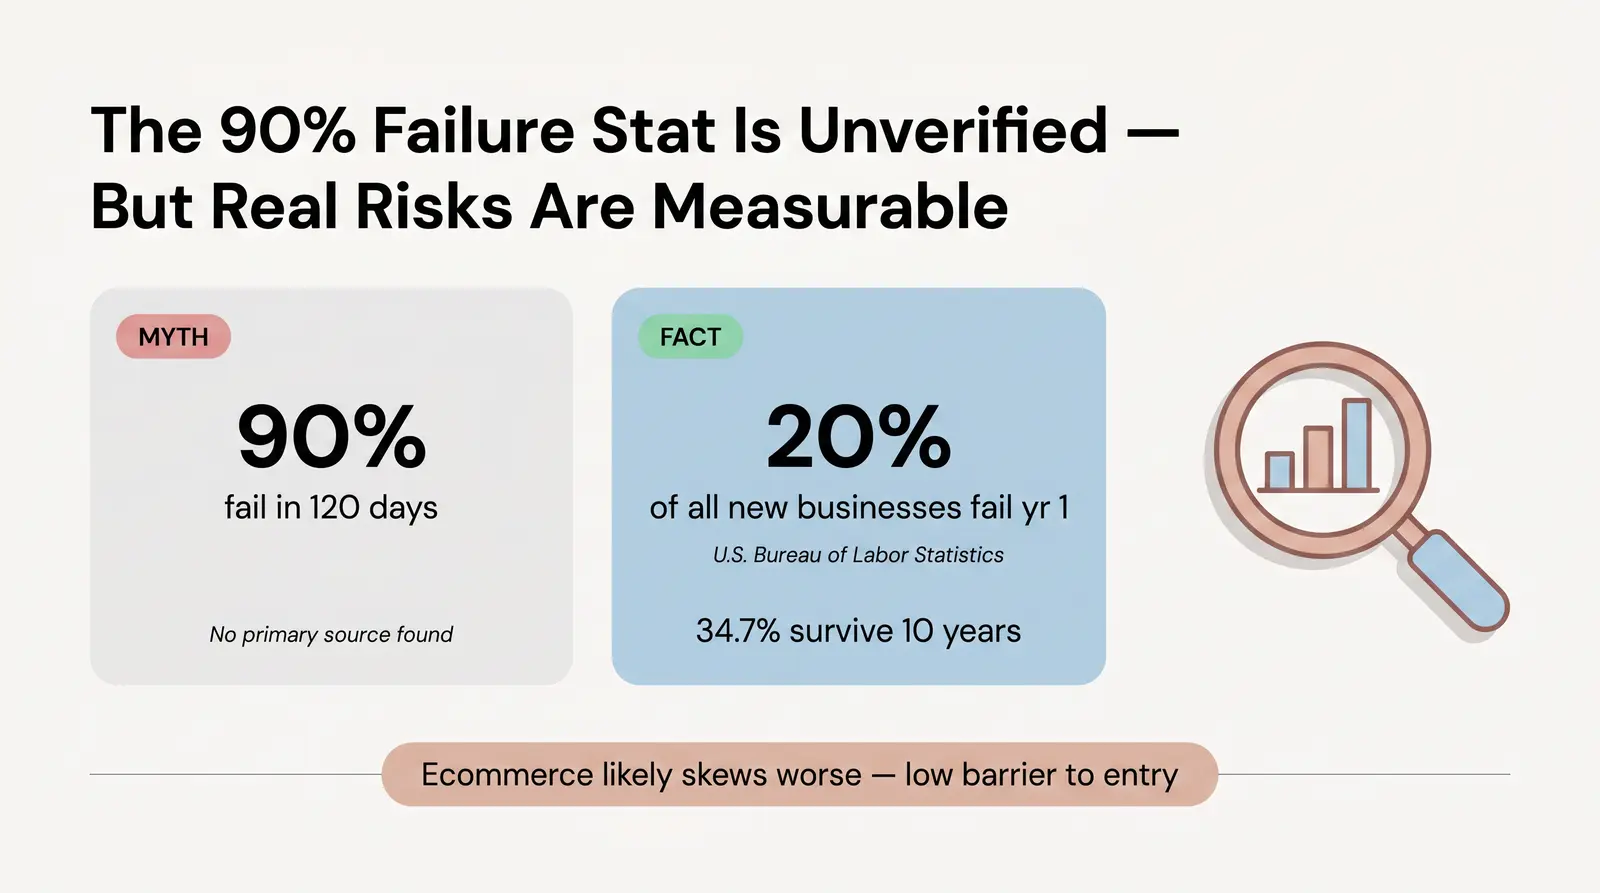
None of these figures trace back to a primary study. Shopify does not publish an official merchant failure rate. The company reports platform-level metrics: total GMV, merchant count, and revenue growth. But it does not release data on how long individual stores survive or whether they are profitable. In 2024, Shopify reported $8.88 billion in total revenue and facilitated over $300 billion in GMV across millions of active stores [1]. That tells you the platform is growing. It tells you nothing about whether your store will survive.
What credible data does exist comes from broader business survival research. According to the U.S. Bureau of Labor Statistics, approximately 20% of new businesses fail in their first year. Only 34.7% of businesses established in 2013 were still operating a decade later [2]. Ecommerce likely skews worse than that average. The barrier to opening a Shopify store is extremely low, which means many stores are launched by people who have not done the foundational work that traditional business formation requires.
The more useful question is not "what percentage fail?" It is "at what stage do they fail, and why?"
Most stores that close do so at a specific, diagnosable point. The failure is not random. It follows a pattern. Understanding that pattern is the entire point of this article.
In organizational psychology, a pre-mortem is a technique developed by cognitive psychologist Gary Klein, published in the Harvard Business Review in 2007 [3]. The idea is simple: before a project launches, you imagine it has already failed, then work backward to identify what caused it. This forces you to surface risks you would otherwise rationalize away.
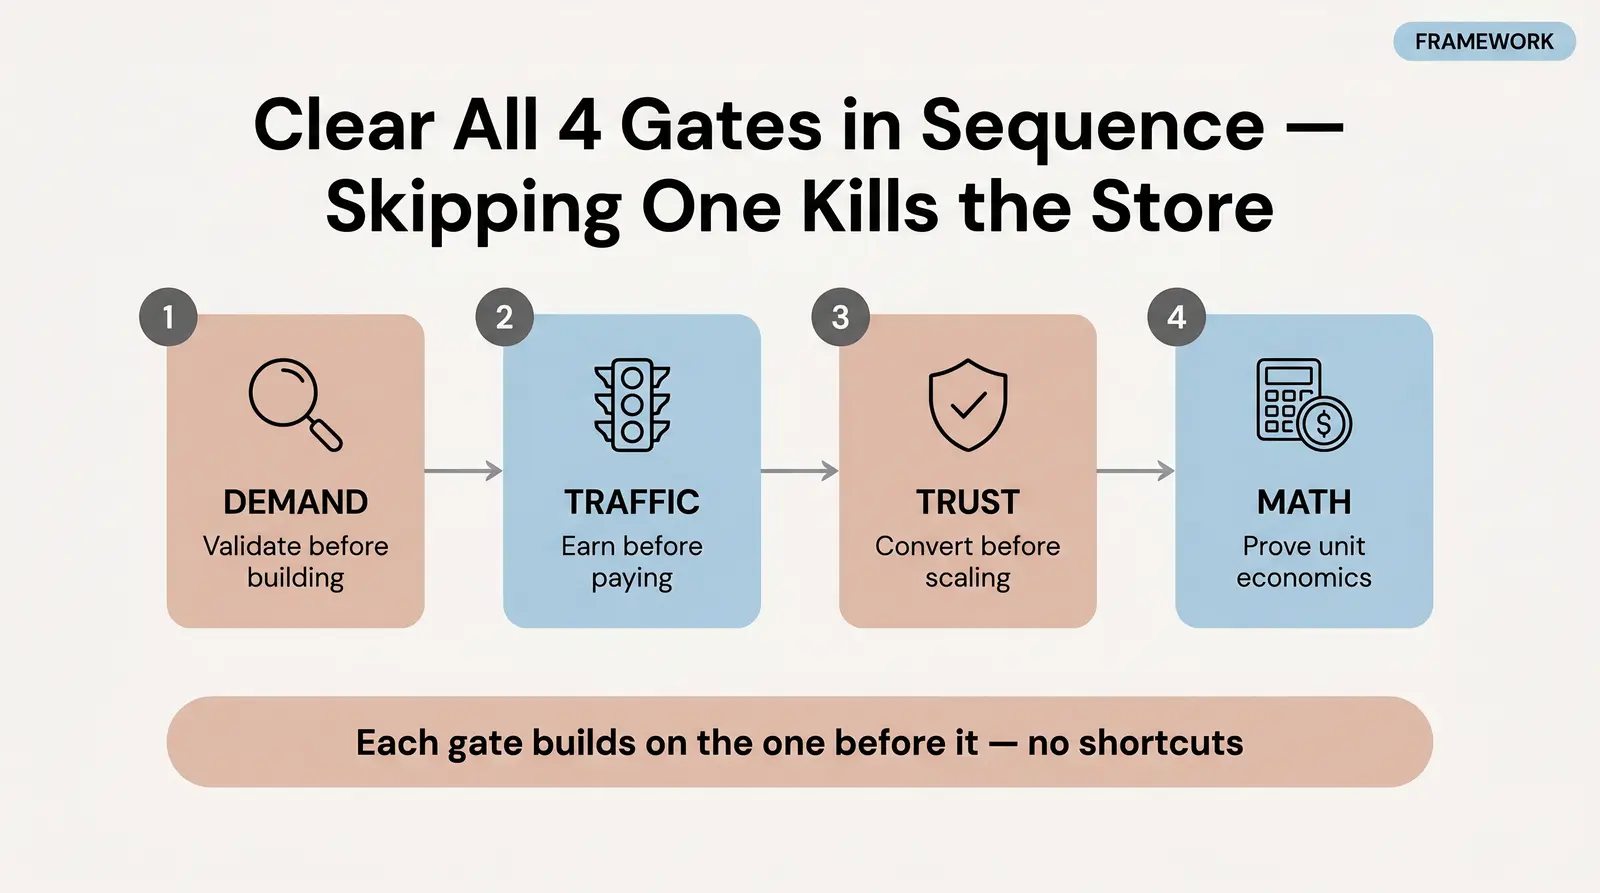
We apply this same logic to ecommerce. The Branvas Store Viability Pre-Mortem is a 4-stage diagnostic framework for evaluating whether a new brand has the fundamentals in place before scaling. Think of it as a sequence of gates, not a checklist. You cannot skip Gate 2 by spending more on ads. You cannot skip Gate 3 by having a great product. Each stage builds on the one before it.
The four stages are: Demand, Traffic, Trust, and Math. Most stores that fail do so because they never cleared one of these gates. Some clear a gate temporarily, then backslide when they start scaling.
The most common failure mode in ecommerce is also the most preventable. A founder finds a product they love, builds a beautiful store, and launches. Then nothing happens. Not because the store is broken, but because no one was waiting for it.
Shopify makes this trap dangerously easy to fall into. You can go from idea to live store in a weekend. That speed feels like momentum. It is not. Building the store is not the same as validating the business.
The demand problem shows up in a few specific ways. Generic products with no differentiation, the kind you find on AliExpress or any dropshipping catalog, compete on price against thousands of identical stores. There is no reason for a customer to choose you over someone else. Similarly, a store that tries to serve "everyone who likes jewelry" or "anyone who wants to be healthier" has no real target customer. Weak niche definition means your marketing speaks to no one specifically, which means it converts no one reliably.
How to actually validate demand before you build:
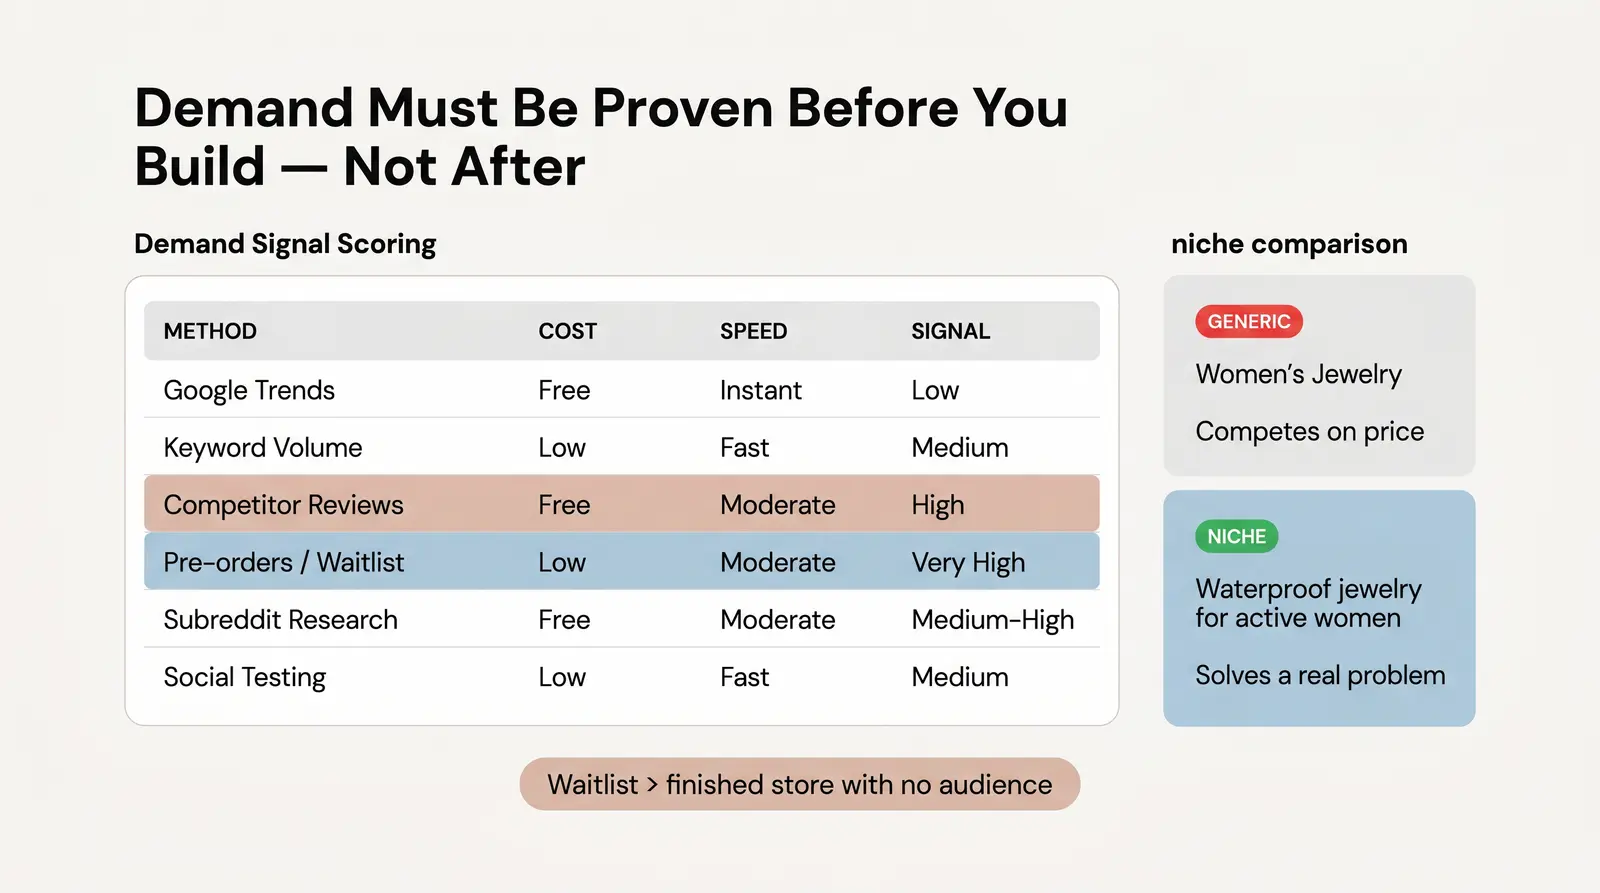
You are looking for concrete signals, not gut feelings. Search volume tells you whether people are actively looking for what you plan to sell. Competitor reviews tell you what existing customers love and hate about current options. That gap is your opportunity. Pre-launch waitlists capture real intent: if people will not give you their email address for early access, they will not give you their credit card. Subreddit and forum activity shows you how people talk about the problem you are solving, which also tells you how to write your product pages.
Consider two hypothetical stores. The first sells "women's jewelry" with no specific angle. It competes on price against Amazon, Etsy, and hundreds of Shopify stores. The second sells "minimalist waterproof jewelry for active women." The second store can validate demand by targeting a specific community: runners, swimmers, outdoor athletes. The product solves a real, articulated problem for each of them. It can price higher because the product has a clear reason to exist. It can build a repeat customer base because the ICP is defined.
This is also where the category matters. Jewelry is a high-perceived-value, low-weight, high-margin category. A $60 piece of jewelry can cost $12 to produce. That margin headroom gives you room to acquire customers, offer free shipping, and still make money. A $30 commodity product with $18 COGS does not. (For founders looking for a low-inventory-risk entry point into a curated jewelry niche, Branvas is built around exactly this model.)
Demand Signal Scoring Table
| Validation Method | Cost | Speed | Signal Strength | Accessibility |
|---|---|---|---|---|
| Google Trends | Free | Instant | Low | Very High |
| Keyword Search Volume | Low | Fast | Medium | High |
| Competitor Review Mining | Free | Moderate | High | High |
| Pre-orders / Waitlist | Low | Moderate | Very High | Medium |
| Subreddit / Forum Research | Free | Moderate | Medium-High | High |
| Social Engagement Testing | Low | Fast | Medium | High |
You launch. You wait. Nothing happens.
This is the most common post-launch experience for new Shopify merchants, and the response is almost always the same: run ads. The problem is that running paid traffic to an unproven store before you understand your conversion economics is one of the fastest ways to drain your working capital.
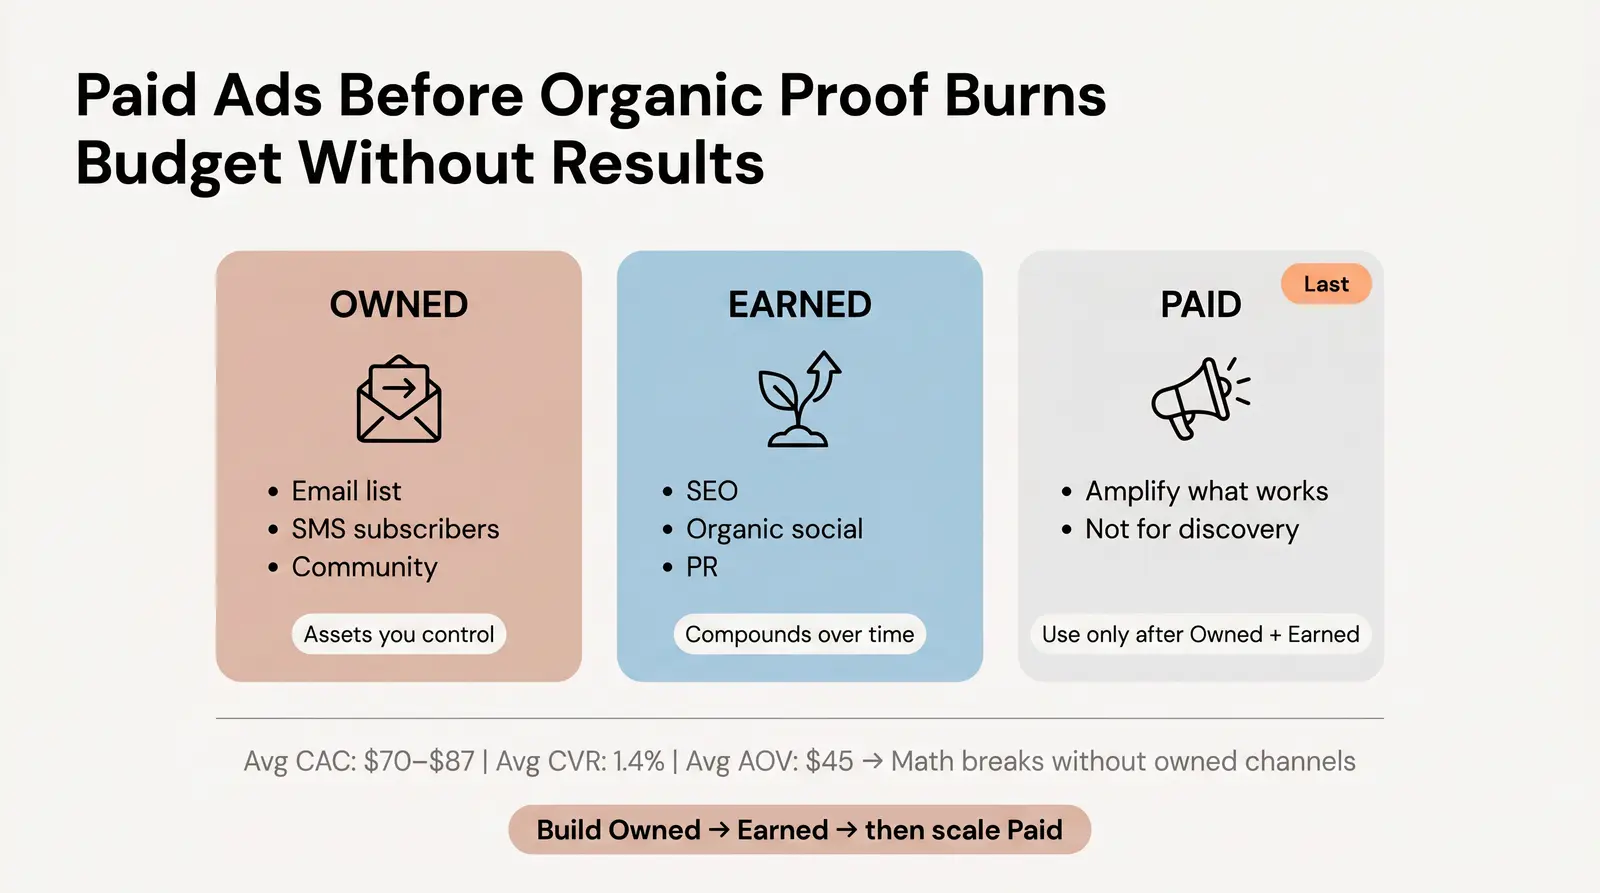
The average customer acquisition cost (CAC) for ecommerce sits around $70 to $87 [4]. For some categories and channels, it is significantly higher. If your store converts at the industry average of 1.4% [5], and your AOV is $45, you are spending $70 to acquire a customer who generates $45 in revenue before COGS and fees. That math does not work.
Paid traffic is not a growth strategy for an unproven store. It is a testing tool.
The distinction matters. Ads can help you learn which products resonate, which audiences respond, and which messages convert. But if you treat paid traffic as your primary acquisition channel before you have proven organic conversion, you will burn through your budget in 60 to 90 days and have nothing to show for it.
The stores that survive long-term build what we call the Traffic Trifecta before they scale paid spend:
Most failing stores skip directly to Paid without building Owned or Earned. When the ad account gets restricted, or CPMs spike, or the algorithm shifts, the store has no fallback. It dies.
The practical implication: start building your email list before you launch. Write product descriptions that are optimized for search. Create content that answers the questions your target customer is already asking. These activities feel slower than running ads. They are not. They are the foundation that makes ads work when you eventually use them.
For a deeper guide on building owned audience channels and organic traffic for new ecommerce brands, branvas.com/academy covers the specific tactics that work for product-based businesses.
Traffic without trust is wasted money. This is where most new stores bleed.
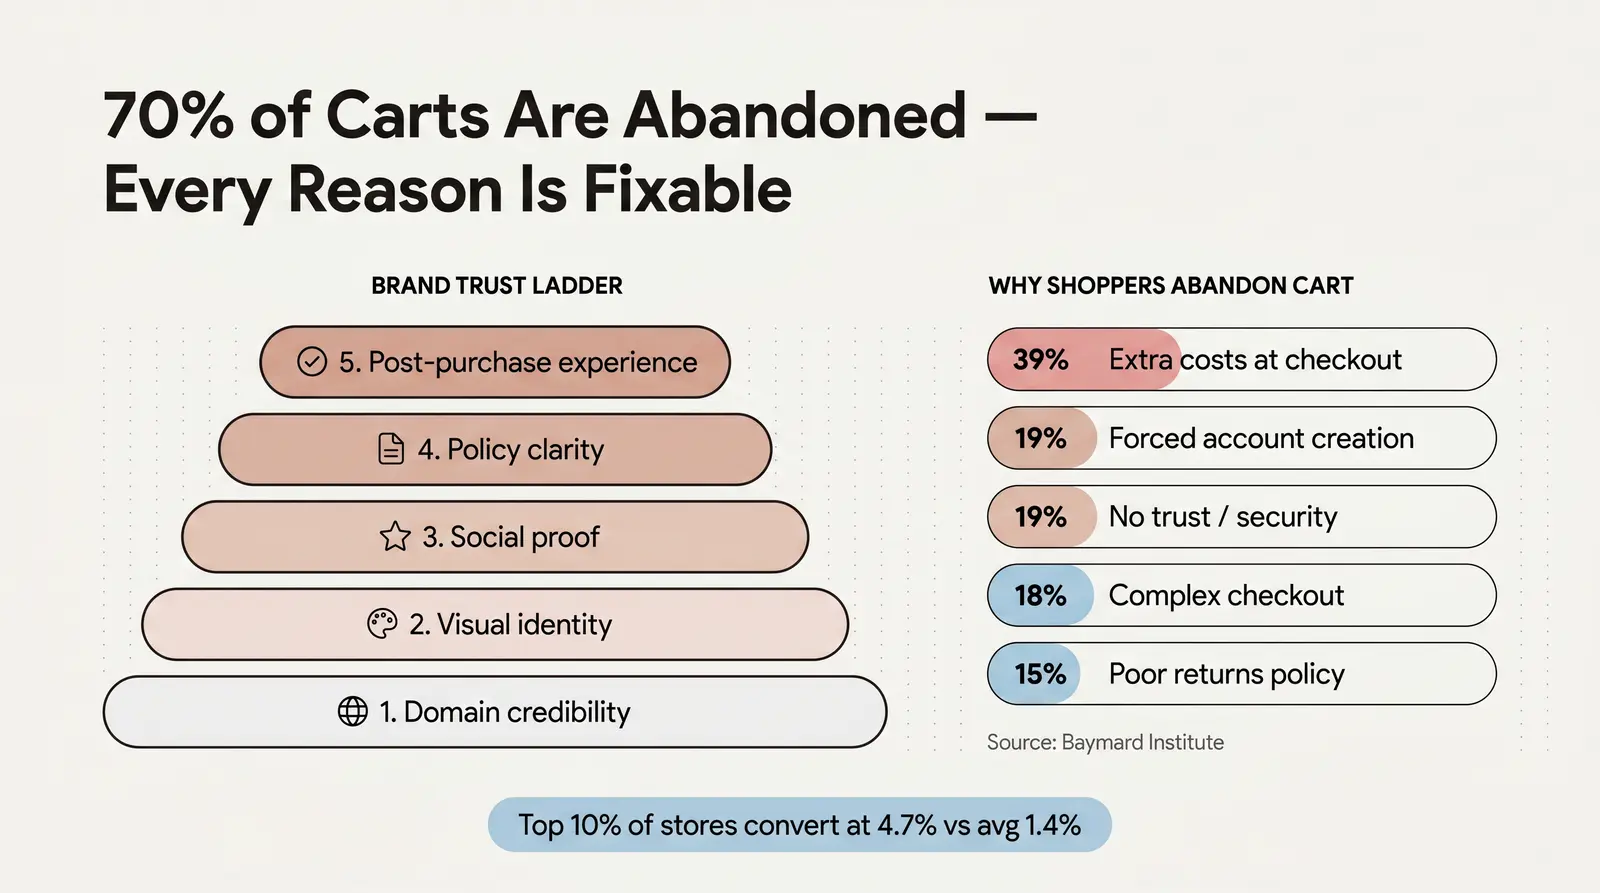
The average Shopify store converts 1.4% of its visitors, based on Littledata's benchmark study of 2,800 stores [5]. The top 20% of stores convert at 3.2% or better. The top 10% hit 4.7%. The difference between a 1.4% and a 3.2% conversion rate is not a better product. It is trust.
The Baymard Institute has tracked cart abandonment across 50 studies and found the global average sits at 70.22% [7]. Seven out of ten shoppers who add something to their cart do not buy. When Baymard analyzed why, the reasons were specific and fixable:
Notice that most of these are not product problems. They are trust and UX problems. And they are all solvable.
New stores fail the trust test in predictable ways. A default Shopify theme with stock photos signals that no real brand exists here. Missing or vague return policies create anxiety at the moment of purchase. No reviews means no social proof. Slow mobile load times are another silent killer. The average mobile page load is 8.6 seconds, well above the 3-second threshold where conversions drop sharply [6]. Visitors leave before they even see the product.
High-converting product pages do a few things consistently: they show the product in context (lifestyle photography, not just white-background shots), they are specific about dimensions, materials, and use cases, they feature real reviews, and they make shipping and return policies visible before checkout.
Trust is built in sequence. We call this the Brand Trust Ladder:
Stores that skip rungs on this ladder lose customers at the rung they skipped. Building trust is easier when the product, packaging, and branding feel like a real brand from day one. That is harder to achieve when you are selling unbranded commodity products with generic packaging.
This is the stage that kills stores that have actually figured out the first three. Revenue is coming in. Traffic is growing. Customers seem happy. And yet the founder is running out of money.
The four numbers that determine whether your store is viable are: CAC (what it costs to acquire a customer), COGS (what it costs to produce and deliver the product), AOV (average order value), and repeat purchase rate (how often customers come back). Most new founders track revenue. Very few track all four of these simultaneously.
Shopify's easy setup masks ugly unit economics. A store doing $10,000 a month in revenue sounds like a success. If COGS is 60% of revenue, shipping costs $7 per order, Shopify takes 2.9% + $0.30 per transaction, and CAC is $55, that store may be operating at a loss.
Here is what the math looks like side by side:
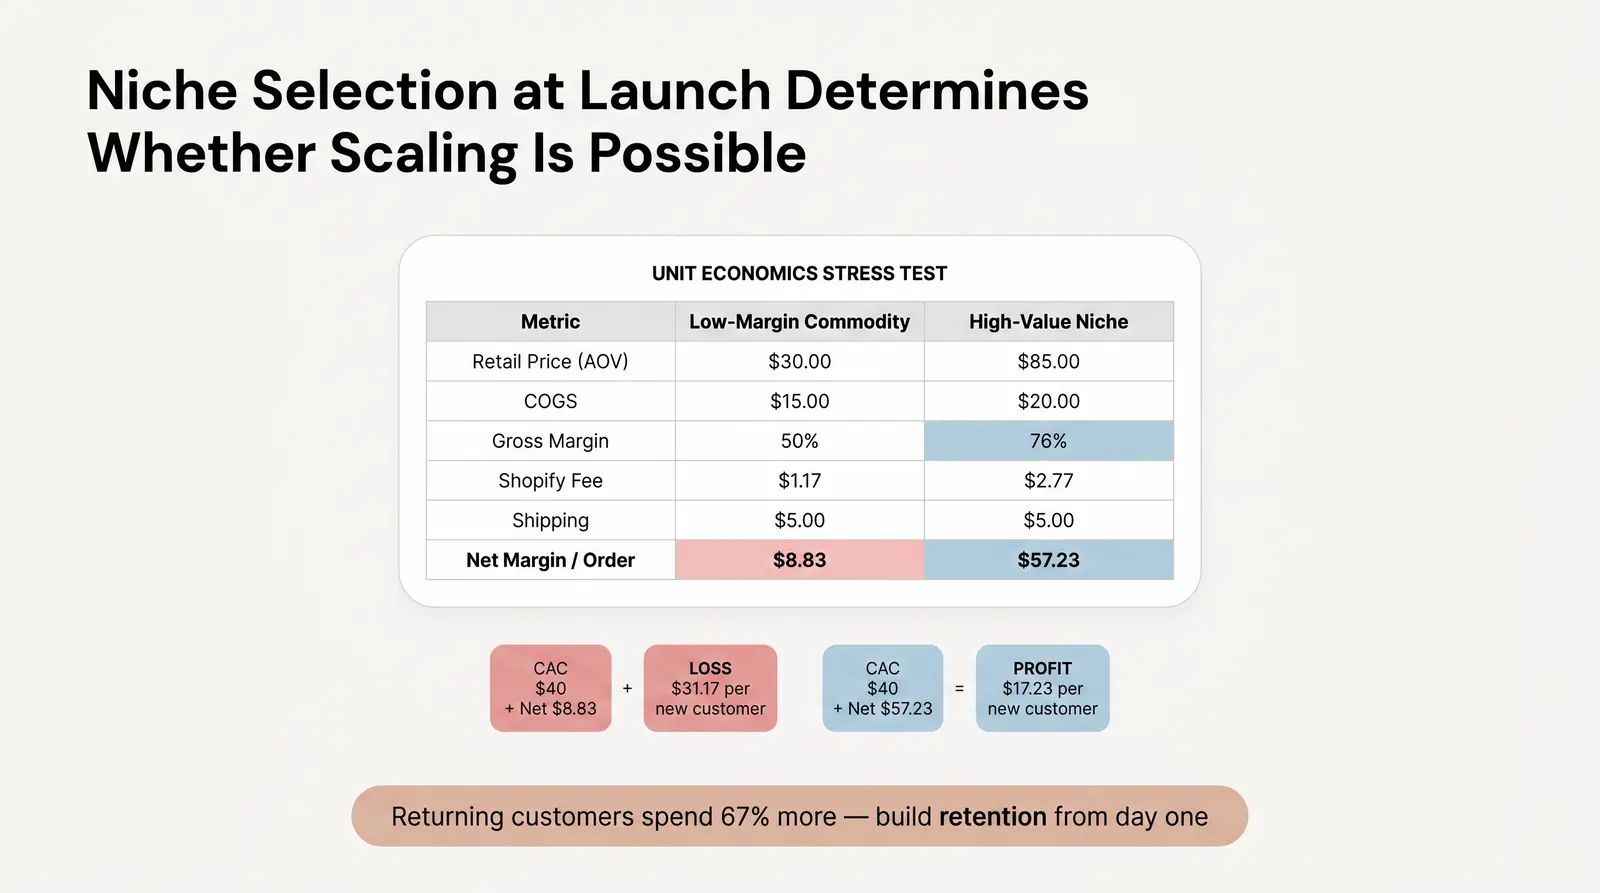
The Shopify Unit Economics Stress Test
| Metric | Low-Margin Commodity | High-Value Niche Product |
|---|---|---|
| Retail Price (AOV) | $30.00 | $85.00 |
| COGS | $15.00 | $20.00 |
| Gross Margin % | 50% | 76% |
| Shopify Payments Fee (2.9% + $0.30) | $1.17 | $2.77 |
| Shipping Cost | $5.00 | $5.00 |
| Net Margin per Order (Before Ads) | $8.83 | $57.23 |
If your blended CAC is $40, the low-margin store loses $31.17 on every new customer acquired. It needs that customer to buy three or four more times just to break even on acquisition. The high-value niche product makes a $17.23 profit on the first sale, and every repeat purchase is nearly pure margin.
This is why niche and product selection matter so much at Stage 1. The margin structure you choose at launch determines whether your business is viable before you ever run a single ad.
The retention blind spot compounds this problem. Most failing stores optimize entirely for acquisition and treat retention as a future problem. It is not. Returning customers spend 67% more than new customers [9], and 65% of a typical company's revenue comes from repeat buyers [9]. If you are not building email flows, post-purchase sequences, and loyalty mechanisms from month one, you are leaving the most profitable part of your business on the table.
Cash flow timing makes this worse. Inventory, ad spend, and Shopify payouts do not align. You pay for ads today. You pay for inventory weeks before you sell it. Shopify pays you on a rolling schedule. Founders run out of working capital before the flywheel starts, not because the business model is broken, but because the timing is.
The fix is straightforward: run your unit economics stress test before you scale ad spend. Know your CAC ceiling. Know your break-even AOV. Know what repeat purchase rate you need to make the math work. You can model this before you spend a dollar on ads. Use branvas.com/profit-calculator to run your numbers before committing to a scaling plan.
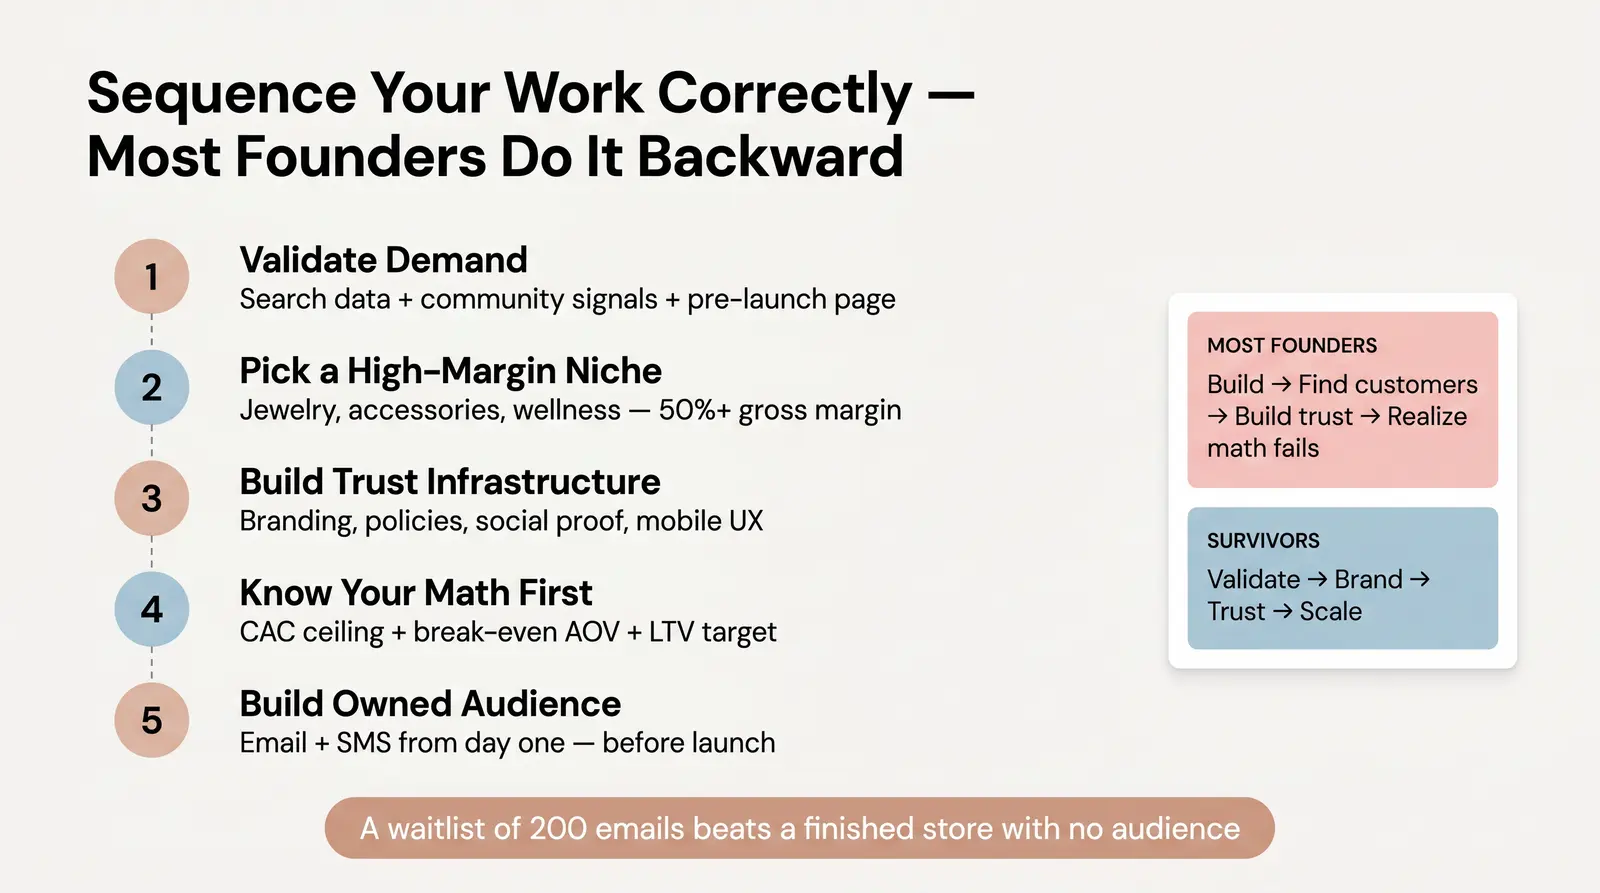
The pre-mortem framework is not a reason to be paralyzed. It is a reason to sequence your work correctly.
Most founders do it backward. They build the store, then try to find customers, then try to build trust, then realize the math does not work. The stores that survive do it in the right order.
Here is the sequence:
Validate demand before building. Use search data, community signals, and pre-launch pages to confirm that real people want what you plan to sell. A waitlist of 200 email addresses is worth more than a finished store with no audience.
Pick a niche with margin headroom. High-perceived-value categories like jewelry, accessories, wellness, and specialty food offer better unit economics than commoditized niches. The margin structure you choose at the start determines whether scaling is possible later.
Build trust infrastructure before driving traffic. Branded visual identity, clear policies, social proof, and mobile UX are not optional extras. They are the foundation that makes every traffic dollar work harder.
Know your math before spending on ads. Calculate your CAC ceiling, your break-even AOV, and your LTV target before you open your ad account. Run your numbers before you commit to a scaling plan.
Build an owned audience from day one. Email and SMS are assets. Ad audiences are rented. Start capturing emails before launch and build your list as a parallel priority to everything else.
If you are considering a product niche that checks these boxes: curated, high-margin, brandable, and low inventory risk, Branvas is built for exactly this starting point. See how it works →
Stage 1 – Demand:
Stage 2 – Traffic:
Stage 3 – Trust:
Stage 4 – Math:
Q: What is the actual Shopify store failure rate?
A: Shopify does not publish an official failure rate for individual merchants. The widely cited "90% failure rate within 120 days" is largely unverified and cannot be traced to a primary study. What we do know from the U.S. Bureau of Labor Statistics is that about 20% of all new businesses fail in their first year, and only 34.7% survive a full decade [2]. Ecommerce likely sees higher initial churn given the low barrier to entry, but the precise figure for Shopify stores specifically does not exist in any credible published form.
Q: Why is my Shopify store getting traffic but no sales?
A: Traffic without conversions almost always points to a trust or friction problem, not a product problem. The global average cart abandonment rate is over 70% [7]. The most common culprits are unexpected costs added at checkout, a checkout process that requires account creation, slow mobile load times, or a product page that lacks social proof and clear return policies. Start by auditing your checkout flow against Baymard Institute's abandonment research and fixing the friction points before spending more on traffic.
Q: What are the most common Shopify mistakes new store owners make?
A: The most fatal mistakes follow the same sequence as the failure stages in this article. Launching without validated demand. Defaulting to paid ads before proving organic conversion. Using a generic theme that fails to build brand trust. Scaling ad spend without understanding unit economics, specifically the relationship between CAC, COGS, AOV, and repeat purchase rate. Each mistake compounds the next.
Q: How do I know if my Shopify store has a unit economics problem?
A: You have a unit economics problem if your CAC plus COGS plus shipping plus transaction fees exceeds your AOV on the first purchase, and your repeat purchase rate is too low to recover that loss over the customer's lifetime. Run the stress test in Stage 4 of this article. If your net margin per order before ads is under $20 and your CAC is above $40, you are likely operating at a loss on every new customer acquired.
Q: What is the fastest way to validate a product before launching a Shopify store?
A: The fastest high-signal validation method is a pre-launch landing page with a waitlist. If real people will give you their email address in exchange for early access or a launch discount, that is a meaningful signal of intent. Pair this with keyword search volume analysis to confirm that people are actively searching for what you plan to sell, and competitor review mining to identify the unmet needs your product can address. These three methods together take less than a week and cost almost nothing.
- Shopify Q4 2025 Investor Press Release — Shopify Investor Relations, 2025
- 34.7 percent of business establishments born in 2013 were still operating in 2023 — U.S. Bureau of Labor Statistics, 2024
- Performing a Project Premortem — Gary Klein, Harvard Business Review, September 2007
- Customer Acquisition Cost Benchmarks 2026: By Industry — Digital Applied, 2026
- Average Ecommerce Conversion Rate: Littledata Benchmark Study of 2,800 Shopify Stores — Littledata, 2023
- Site Speed is (Still) Impacting Your Conversion Rate — Portent, 2022
- 50 Cart Abandonment Rate Statistics — Baymard Institute, updated 2025
- Types of Merchant Fees Explained — Shopify, 2025
- Ecommerce Customer Retention Statistics 2026 — Rivo, 2026