Use the Threshold Profit Framework to calculate the exact free shipping minimum that maximizes profit per order, accounting for margins, shipping costs, and ad spend.
Published:
August 20, 2026
Author:
Yi Cui
Paste your AOV distribution. Get the threshold that maximizes profit, not just revenue.
Most store owners pick a round number for their free shipping minimum. They might add a few dollars to their average order value, copy a competitor, or just go with $50 because it feels right. That approach is a margin leak hiding in plain sight.
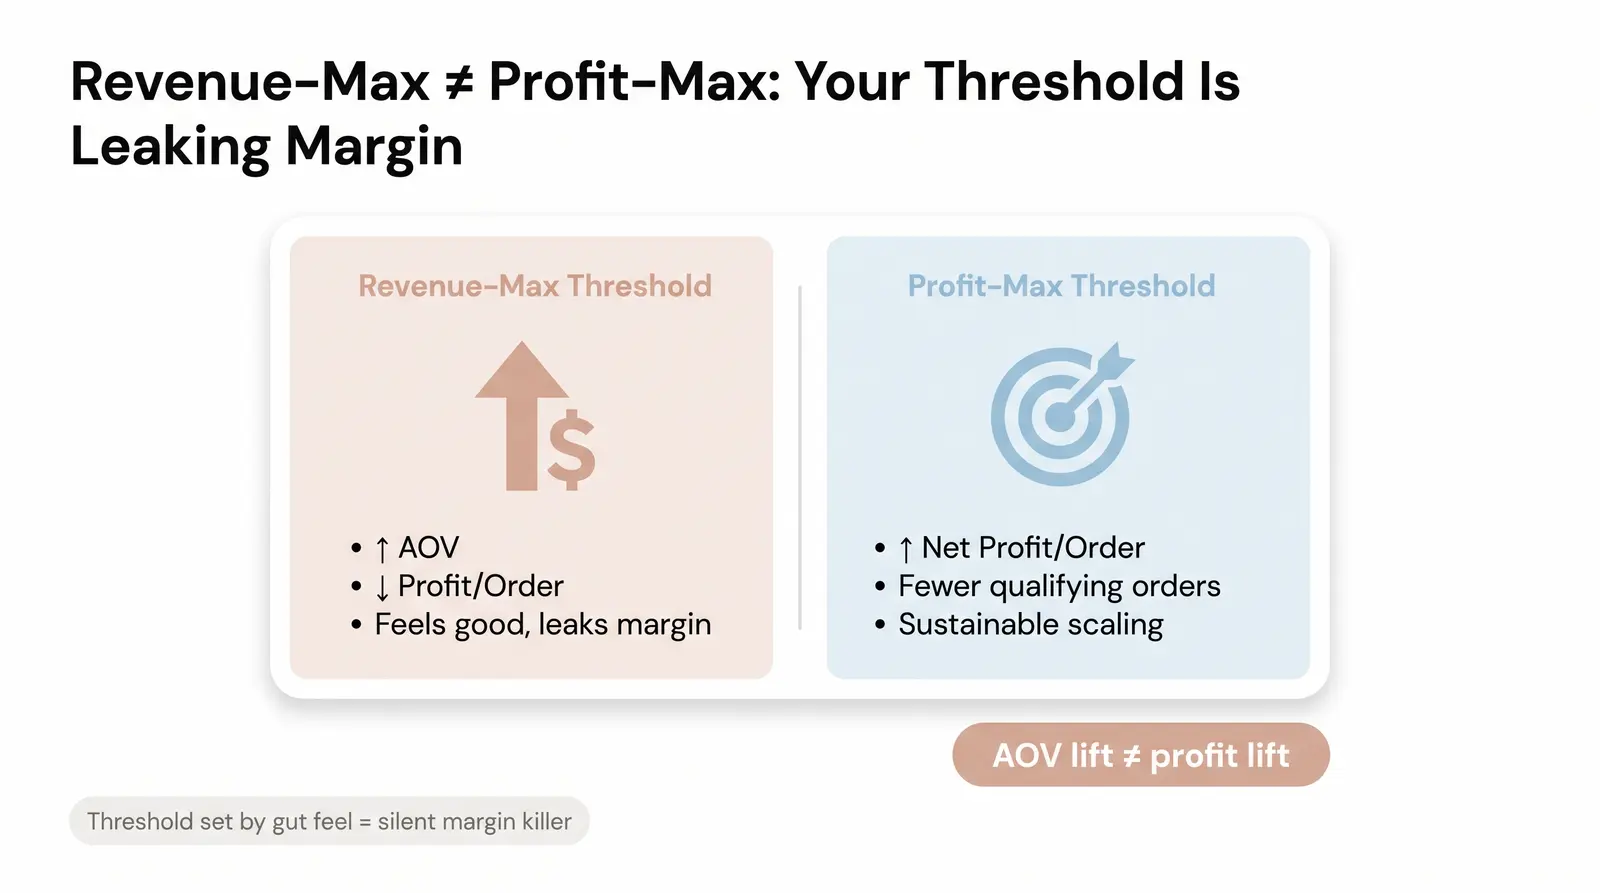
Here is the insight most ecommerce guides skip: the revenue-maximizing threshold and the profit-maximizing threshold are almost never the same number. Optimizing for the wrong one is one of the most common silent margin killers in DTC ecommerce. Research shows that a free shipping threshold can lift average order value (AOV) by 15% to 20% [1], but a higher AOV does not automatically mean higher profit. When shipping subsidies erode gross margin on every qualifying order, you can grow revenue while quietly shrinking profit per order [2].
In our work with private-label brand founders at Branvas, we see this constantly. A founder sets a $49 free shipping minimum because a competitor does it, without ever running the numbers against their own margins. The competitor might have a 70% gross margin. The founder might have 55%. The same threshold produces very different outcomes.
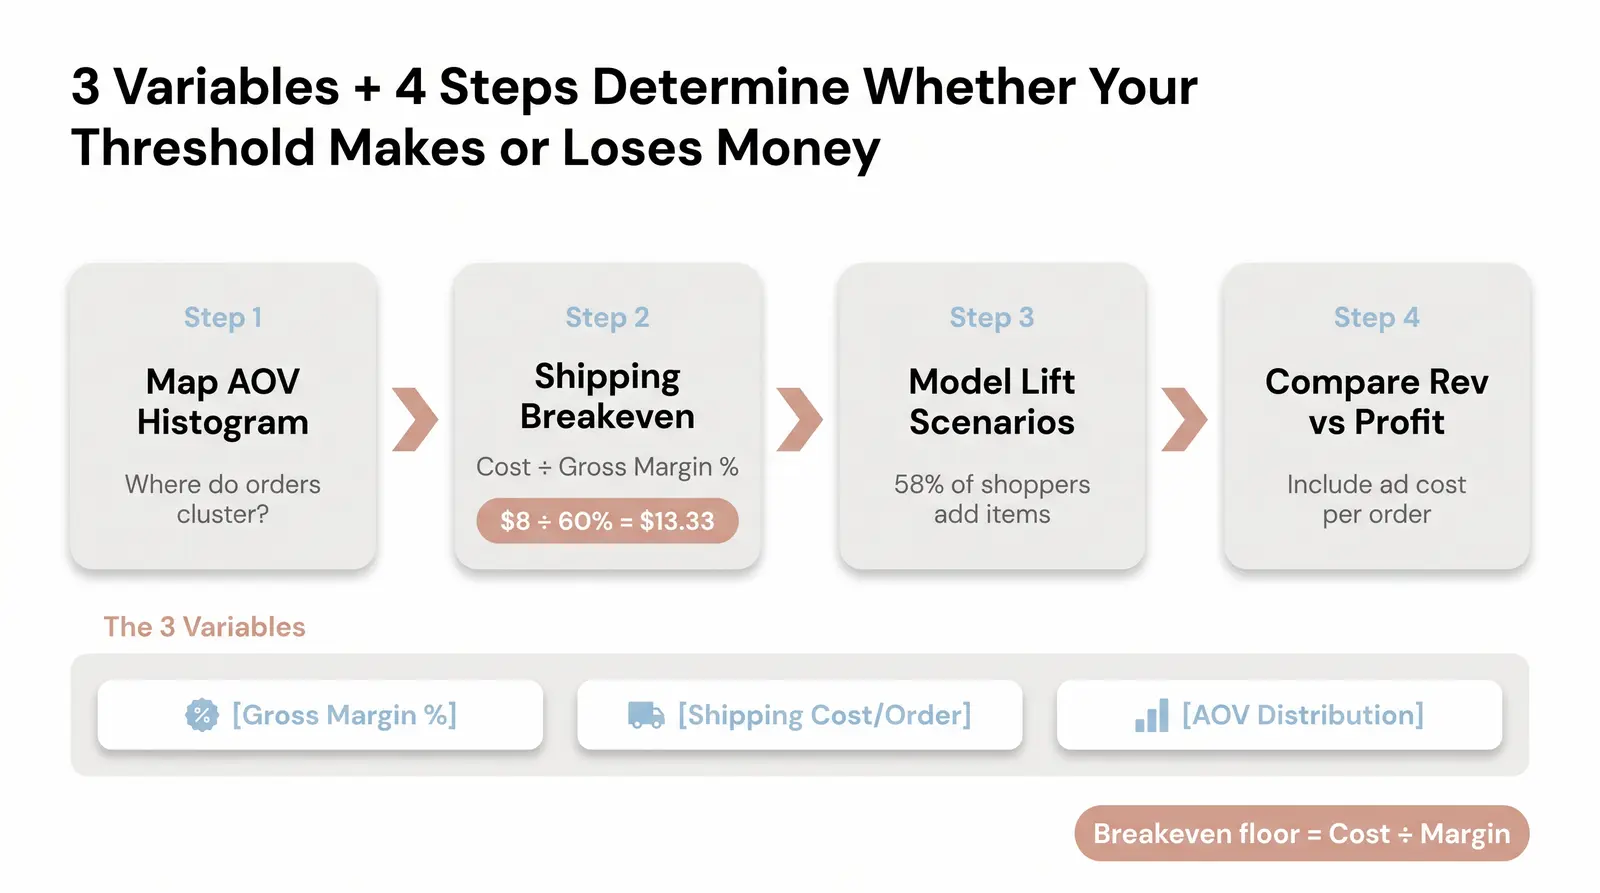
Three variables determine whether your free shipping threshold makes or loses money on each order.
Gross Margin % is your revenue minus cost of goods sold, expressed as a percentage. This is your margin before shipping costs are applied. For DTC jewelry and accessories brands, gross margins typically range from 50% to 70% [3].
Shipping Cost per Order is your actual average carrier cost per delivered package. In 2026, the average ecommerce brand pays $7.96 to $15 per order to ship, depending on weight, zone, and carrier [2].
AOV Distribution is not just your average order value. It is the full picture: your median order value, the spread of your orders (P25 to P75), and what percentage of orders fall above or below any given threshold. The median matters more than the mean here, because a handful of large orders can pull the mean up and make your threshold look more attainable than it actually is for most customers [4].
We use a proprietary 4-step model to find the exact threshold that maximizes profit, not just revenue.
Step 1: Map your AOV histogram. Identify where your orders naturally cluster. Export your last 90 days of orders and look at the distribution. Where do most orders land? What percentage fall within $10 of your current threshold?
Step 2: Calculate your shipping breakeven order value. This is the order size at which your gross profit exactly covers your shipping cost. The formula is simple:
Shipping Breakeven Order Value = Shipping Cost / Gross Margin %

Example: $8 shipping / 0.60 margin = $13.33
This tells you the floor. Any order below this value loses money on shipping alone.
Step 3: Model threshold lift scenarios. Estimate what percentage of customers near the threshold will spend up to reach it. Research consistently shows that roughly 58% of shoppers actually add items to qualify for free shipping when given the opportunity [1]. For customers within $10 to $15 of the threshold, a realistic uplift assumption is 15% to 30% [5].
Step 4: Compare revenue-maximizing vs. profit-maximizing outputs. Run the numbers for two or three threshold scenarios. Calculate the blended profit per order for each, accounting for the percentage of orders that qualify, the estimated AOV lift, and your full cost stack including ad spend.
The profit-maximizing threshold must account for ad cost per order. If you spend $10 to acquire a customer and the order barely covers shipping, you are losing money on that customer regardless of what your AOV looks like.
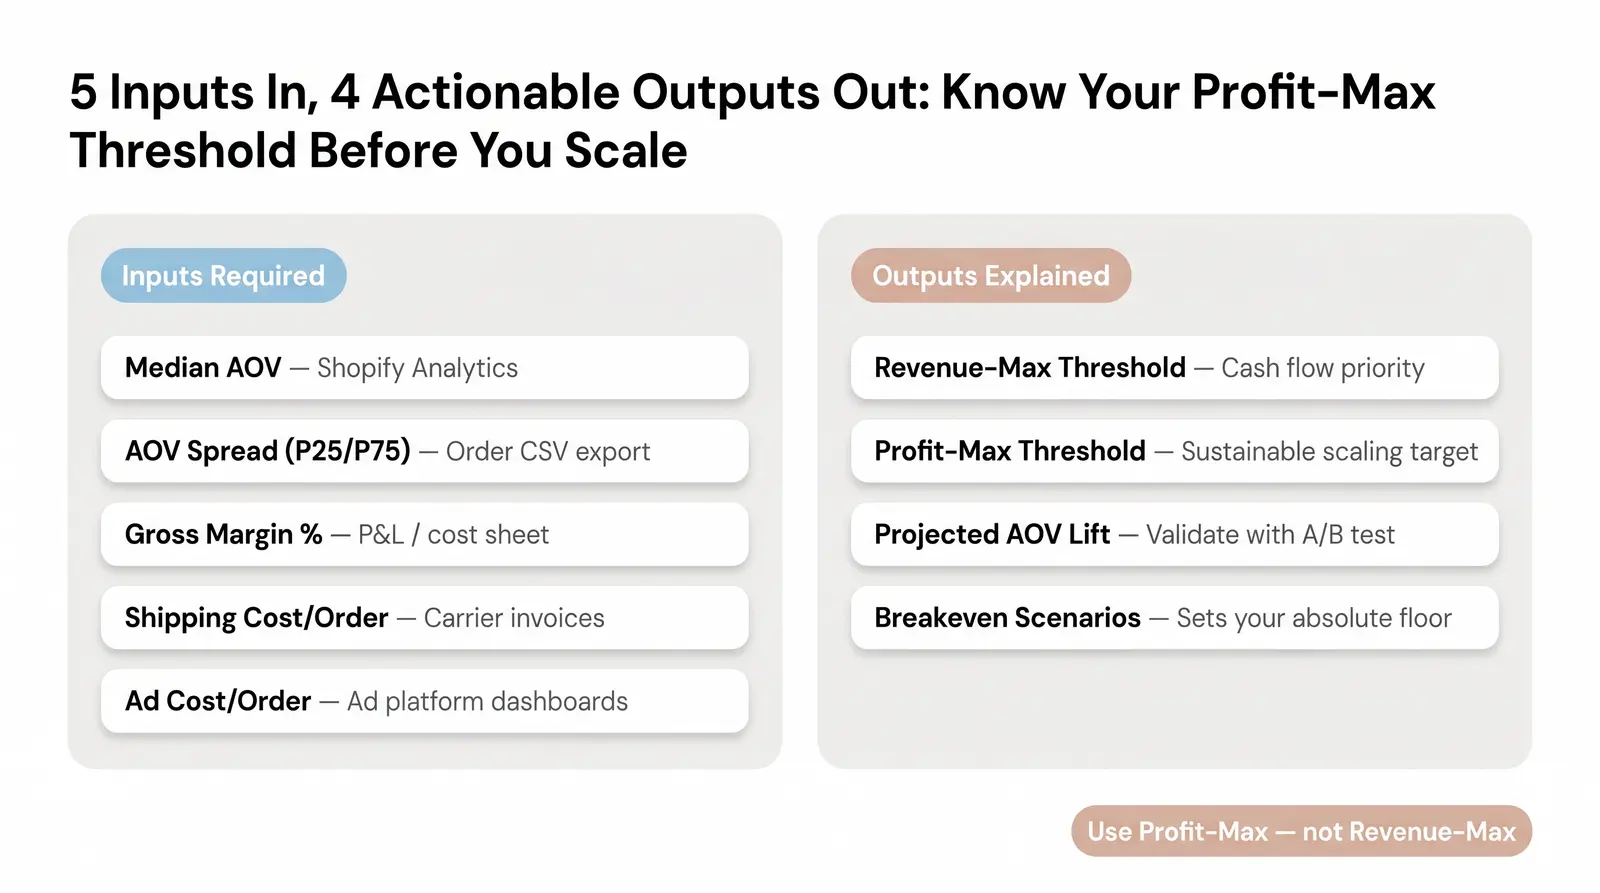
The optimizer framework works whether you use our tool or run the math manually in a spreadsheet. Here is what you need to input and what you will get back.
Inputs required:
| Input | What to Enter | Where to Find It |
|---|---|---|
| Median AOV | Your median order value (not mean) | Shopify Analytics > Orders |
| AOV Spread | P25/P75 order range or std. deviation | Export order CSV, calculate in Excel |
| Gross Margin % | Revenue minus COGS, as a % | P&L or product cost sheet |
| Shipping Cost per Order | Average actual carrier cost | Carrier invoices or shipping app |
| Ad Cost per Order | Total ad spend divided by paid orders | Ad platform dashboards |
Outputs explained:
| Output | What It Means | How to Act On It |
|---|---|---|
| Revenue-Maximizing Threshold | The threshold that lifts AOV the most | Use if cash flow is the priority over margin |
| Profit-Maximizing Threshold | The threshold where net profit per order peaks | Use this for sustainable scaling |
| Projected AOV Lift | Estimated % increase in AOV at recommended threshold | Validate with an A/B test before committing |
| Breakeven Scenarios | Margin-neutral vs. margin-positive thresholds | Sets your absolute floor |
If you are launching or scaling a jewelry or accessories brand and want your shipping economics already built into your margin stack, see how Branvas structures fulfillment costs for private-label brands.
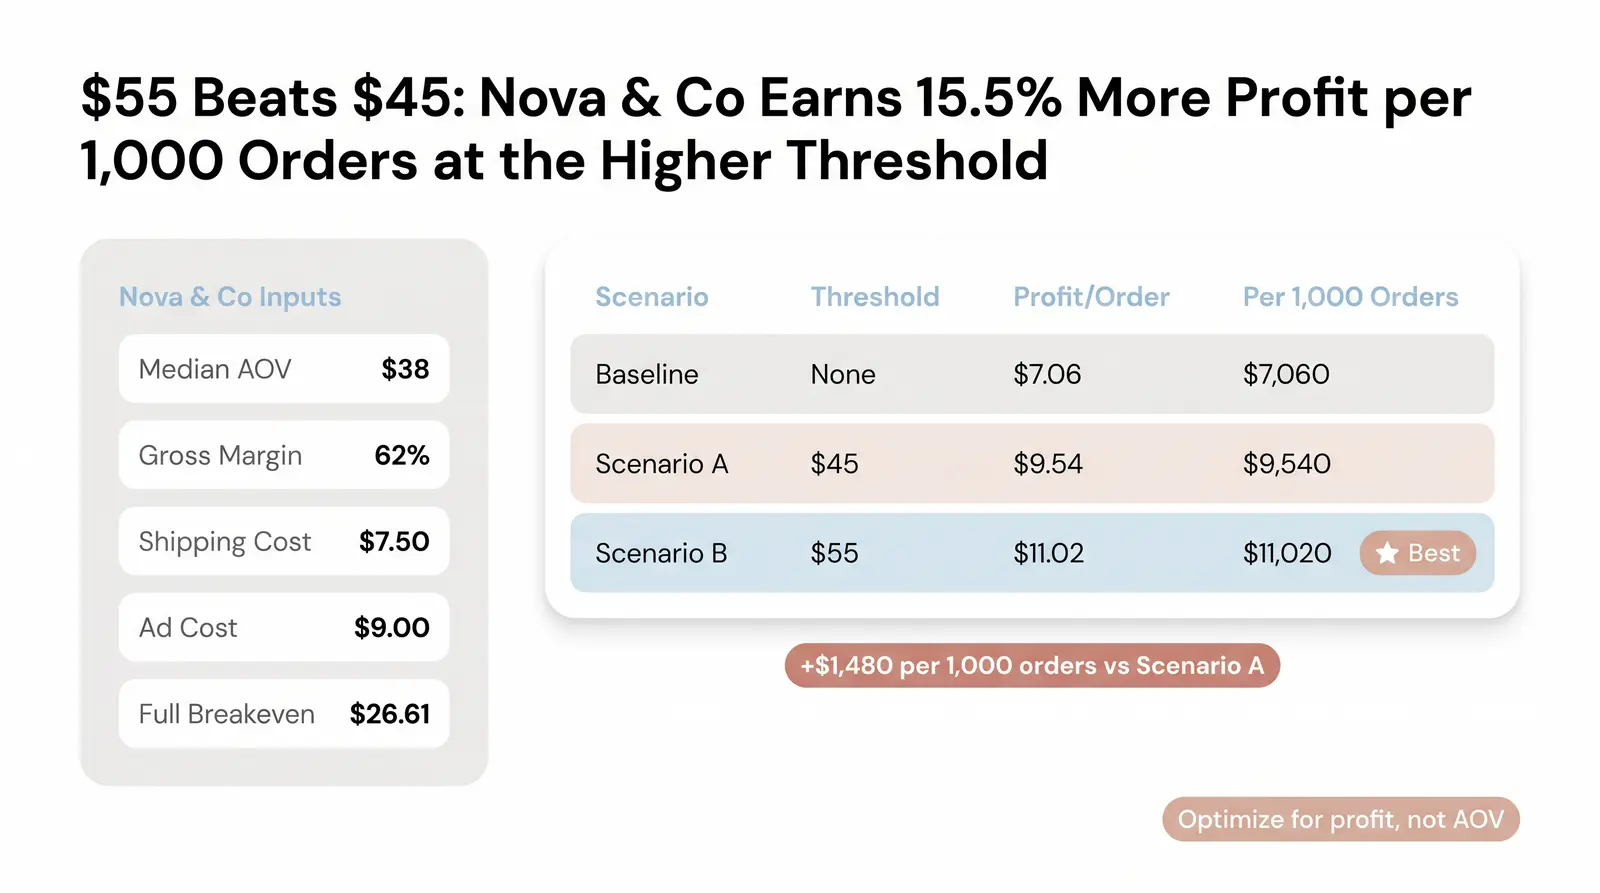
Let's walk through a fully worked example using a fictional DTC jewelry brand called Nova & Co. All numbers are realistic for a small-to-mid-size jewelry brand.
Nova & Co. inputs:
Nova & Co.'s orders cluster around $38. Half of all orders fall between $24 and $54. Here is a simplified view of their order distribution:
| Order Value Range | Est. % of Orders |
|---|---|
| Under $20 | 8% |
| $20 to $30 | 17% |
| $30 to $40 | 30% |
| $40 to $50 | 25% |
| $50 to $60 | 12% |
| Over $60 | 8% |
This tells us that roughly 45% of orders fall between $30 and $50. Any threshold in this range will affect a significant portion of their customer base.
Shipping Breakeven = $7.50 / 0.62 = $12.10
Any order below $12.10 loses money on shipping alone. But Nova & Co. also pays $9.00 in ad cost per order. The full breakeven (shipping plus acquisition cost) is:
($7.50 + $9.00) / 0.62 = $26.61
Any order below $26.61 is a net loss after shipping and marketing, before any other overhead.
Nova & Co. tests two thresholds: $45 and $55. They assume a 20% AOV lift for orders near the threshold, based on the observed 58% of shoppers who add items to qualify [1].
Baseline math (no free shipping):
Scenario A ($45 threshold):
Scenario B ($55 threshold):
| Scenario | Threshold | Est. % Orders Qualifying | Avg. AOV After Lift | Gross Profit/Order (after shipping + ad cost) | Profit per 1,000 Orders |
|---|---|---|---|---|---|
| Baseline (no free shipping) | None | 100% | $38.00 | $7.06 | $7,060 |
| Scenario A | $45 | 45% | $42.00 | $9.54 | $9,540 |
| Scenario B | $55 | 25% | $46.00 | $11.02 | $11,020 |
Scenario A is the revenue-maximizing threshold. It qualifies more orders and lifts total revenue. Scenario B is the profit-maximizing threshold. It generates $11,020 per 1,000 orders compared to $9,540 for Scenario A, a difference of $1,480 per 1,000 orders. At scale, that gap compounds fast.
The key takeaway: Nova & Co. would have picked $45 if they optimized for AOV. By running the TPF model, they found that $55 generates 15.5% more profit per 1,000 orders.
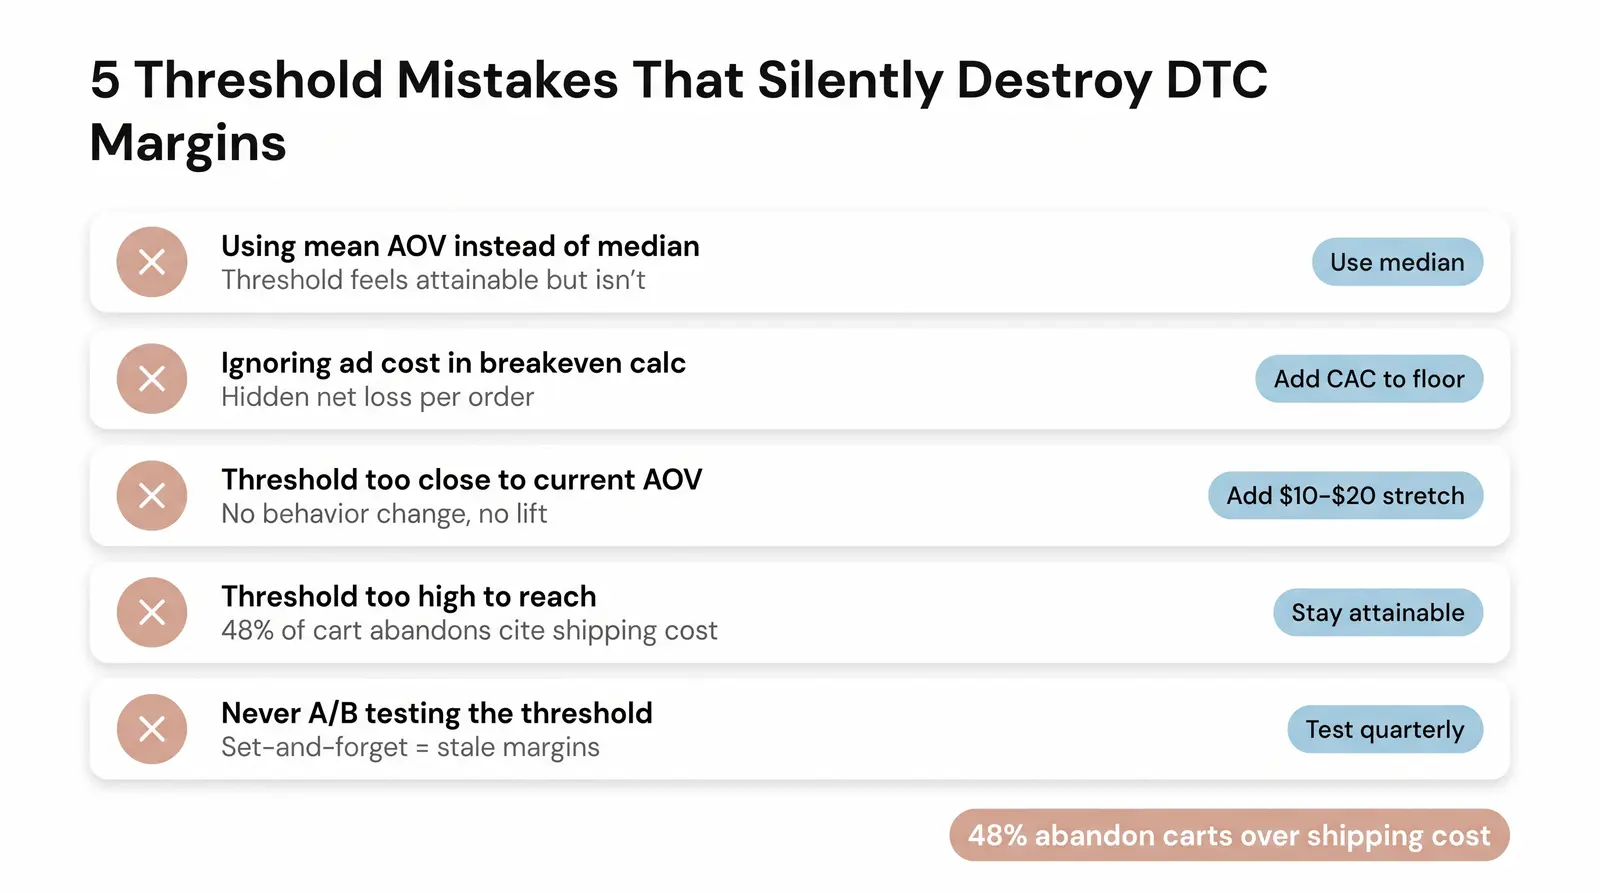
These five mistakes show up repeatedly when founders set their shipping minimums without running the math.
1. Using mean AOV instead of median. A few large orders can pull your mean AOV well above where most customers actually spend. If your mean is $55 but your median is $38, a threshold of $65 will feel out of reach for the majority of your buyers [4].
2. Ignoring ad cost per order in the margin calculation. Shipping cost alone is not the full picture. If you spend $9 to acquire a customer and the order barely covers shipping, you are losing money on that customer. Always include your blended ad cost per order in the breakeven calculation.
3. Setting the threshold too close to current AOV. A threshold that is only $2 or $3 above your median AOV creates no perceived stretch. Customers who were already going to spend $38 do not need to change their behavior. The threshold does nothing.
4. Setting the threshold so high that conversion drops. An unreachable threshold is worse than no threshold at all. Unexpected shipping costs are the leading cause of cart abandonment, cited in 48% of abandonments [6]. If customers hit checkout and see a $12 shipping fee because they are $30 short of your threshold, many will leave.
5. Never testing. Your threshold is not a set-and-forget decision. Markets change, your product mix evolves, and your AOV distribution shifts over time. A/B test your threshold against at least one alternative before treating any number as permanent [7].
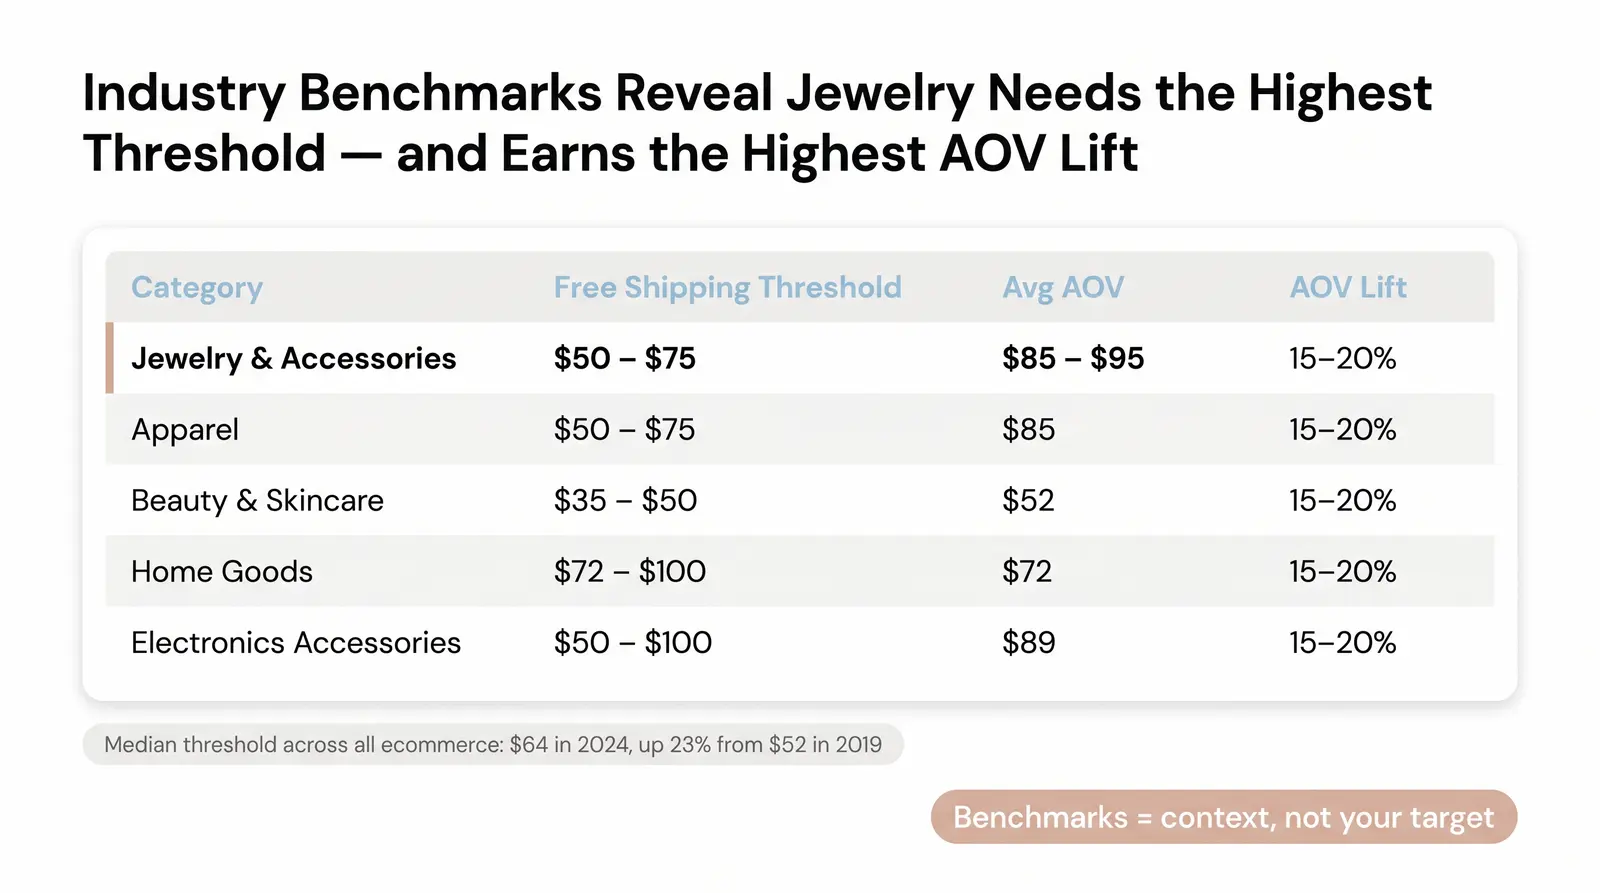
These benchmarks give you a starting point for comparison. Use them as context, not as a substitute for running your own numbers.
| Category | Typical Free Shipping Threshold | Average AOV | Reported AOV Lift from Threshold |
|---|---|---|---|
| Jewelry & Accessories | $50 to $75 | $85 to $95 | 15% to 20% |
| Apparel | $50 to $75 | $85 | 15% to 20% |
| Beauty & Skincare | $35 to $50 | $52 | 15% to 20% |
| Home Goods | $72 to $100 | $72 | 15% to 20% |
| Electronics Accessories | $50 to $100 | $89 | 15% to 20% |
Data synthesized from industry benchmarks [1] [6] [8]. The median free shipping threshold across all ecommerce retailers was $64 in 2024, up 23.1% from $52 in 2019 [6].
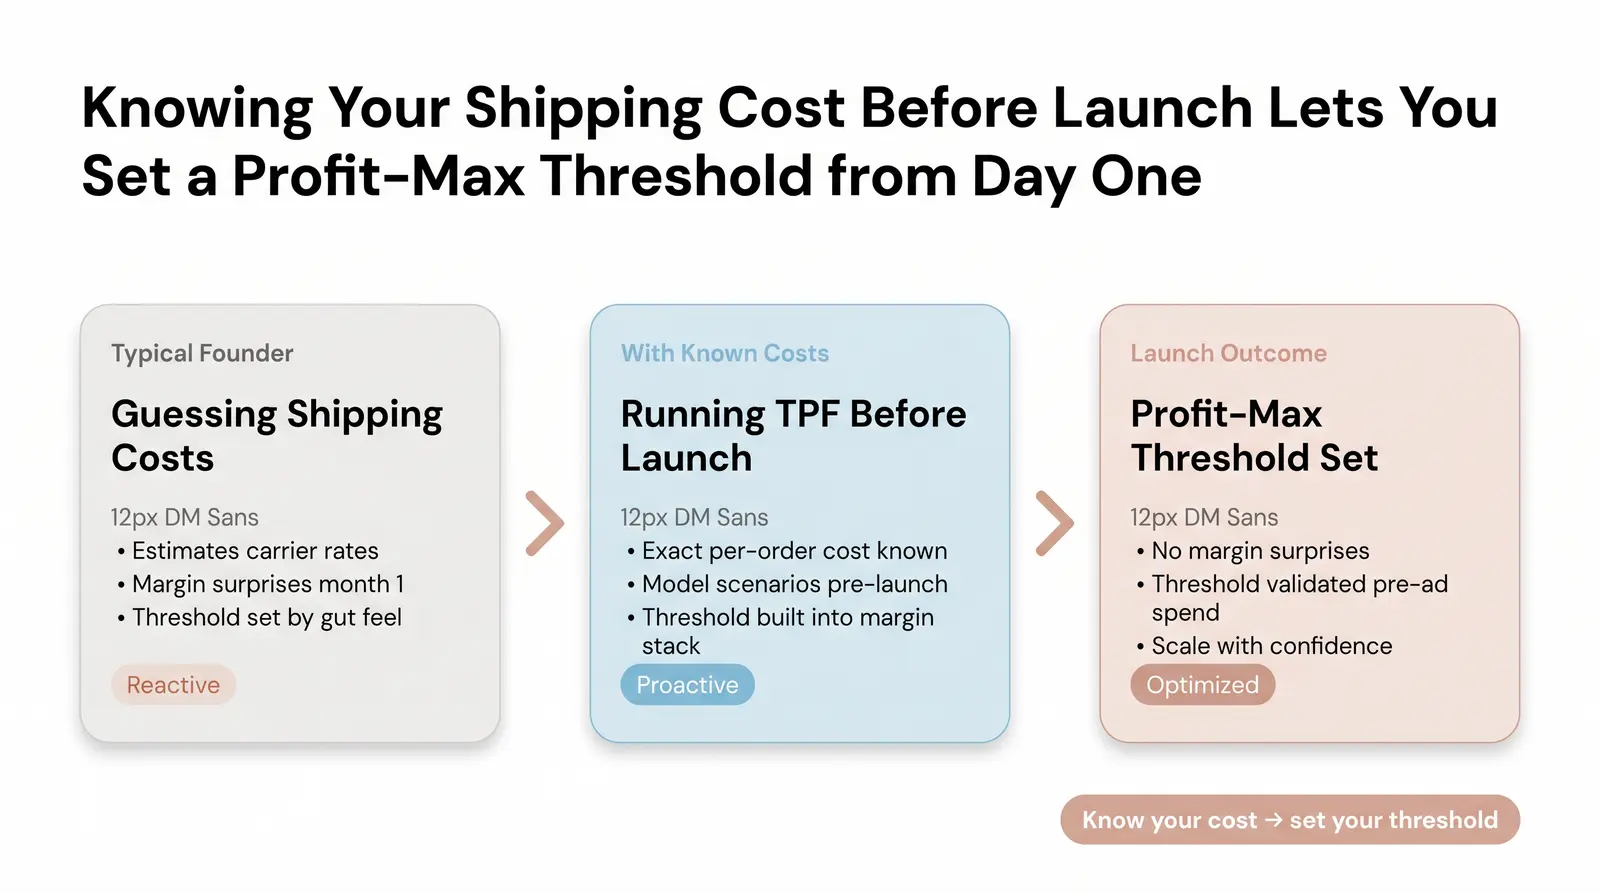
We often see aspiring brand founders struggle with threshold decisions because they are still estimating shipping costs. With Branvas, your shipping cost per order is known before your first sale. That means you can run the TPF model accurately before you launch, not after your first month of margin surprises.
Because Branvas handles sourcing, fulfillment, and blind shipping for jewelry and accessories brands, founders have cleaner per-order cost visibility from day one. You are not guessing at carrier rates or fulfillment fees. You know the number. You can build your threshold around it before you run your first ad.
Want to launch a jewelry brand with your shipping economics already dialed in? Explore Branvas or check our profit calculator to model your margins before you pick a threshold. If you are an influencer or creator looking to launch your own brand, see how we work with influencers and creators. If you run an ecommerce store or boutique, explore our solutions for ecommerce and boutique store owners.
What is a free shipping threshold calculator and how does it work?
A free shipping threshold calculator takes your median order value, gross margin, shipping cost per order, and ad cost per order as inputs. It models multiple threshold scenarios to identify the exact minimum order value that maximizes your net profit per order, not just your total revenue. The best calculators also factor in the percentage of orders that will actually qualify and the realistic AOV lift you can expect from customers who add items to reach the threshold.
What is the ideal free shipping minimum for a Shopify store?
There is no single ideal number. The right threshold depends on your gross margins, your shipping costs, and where your orders naturally cluster. A common starting point is 15% to 30% above your median order value, but this must be validated against your actual margin math. A Shopify store with a 65% gross margin and $7 shipping costs will have a very different optimal threshold than one with a 40% margin and $12 shipping costs [4].
How do I calculate the breakeven point for free shipping?
Divide your average shipping cost per order by your gross margin percentage. The result is the minimum order value at which your gross profit exactly covers the cost of shipping. For example, $8 shipping divided by a 60% gross margin equals a $13.33 breakeven order value. To also cover ad spend, add your ad cost per order to the shipping cost before dividing by your margin.
Does offering free shipping always increase conversion rates?
Not always. Free shipping is a powerful purchase motivator, with 62% of consumers saying they will not complete a purchase if shipping is not free [1]. But if your threshold is set too high, it can actually hurt conversion. Customers who see a large gap between their cart total and the free shipping minimum are more likely to abandon. The goal is a threshold that feels attainable to the majority of your buyers while still protecting your margins.
What is the difference between a revenue-maximizing and profit-maximizing shipping threshold?
A revenue-maximizing threshold is set to generate the highest total order volume and AOV. It is typically lower, qualifying more orders and encouraging more customers to spend up. A profit-maximizing threshold is set higher, qualifying fewer orders but ensuring that every qualifying order generates enough incremental margin to more than cover the absorbed shipping cost. For most DTC brands focused on sustainable growth, the profit-maximizing threshold is the right target.