Over 80 ecommerce email marketing benchmarks for 2026 covering open rates, click rates, placed order rates, and revenue per recipient across campaigns, flows, and industry categories.
Published:
May 8, 2026
Author:
Yi Cui
80+ email benchmarks for ecommerce in 2026. Open, click, placed-order, and revenue-per-recipient by category and flow type.
The ecommerce email marketing landscape has fundamentally shifted. While total email volume continues to climb, the metrics that matter most to brand owners and marketers have evolved. The days of optimizing solely for open rates are behind us, replaced by a laser focus on click-to-conversion rates, placed order rates, and revenue per recipient (RPR).
This guide curates the most reliable 2026 email marketing benchmarks for ecommerce. By drawing on data from Klaviyo, Omnisend, and Mailchimp, we provide a clear picture of what constitutes strong performance today. Whether you are evaluating your own email program, diagnosing underperformance, or setting targets for a new brand launch, these benchmarks give you the context you need.
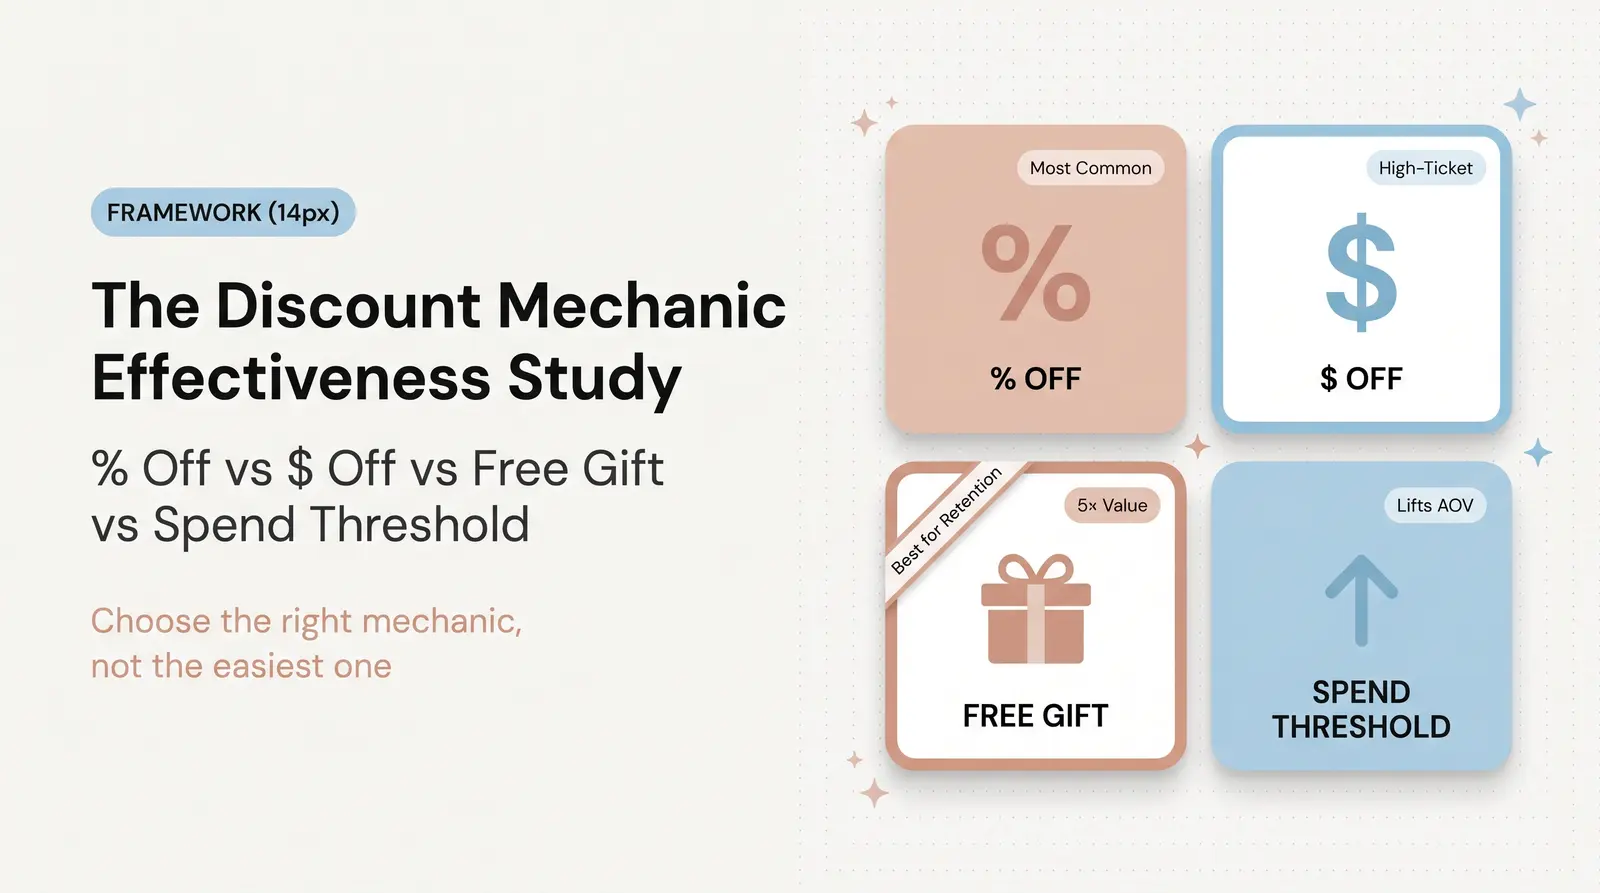
A few important caveats before you read on. First, these benchmarks are averages. A top 10% performer in abandoned cart will look nothing like the average brand. Second, Apple Mail Privacy Protection (MPP) has permanently distorted open rate data, which we address in detail below. Third, the benchmarks that matter most vary by your business model. A high-AOV jewelry brand should weight RPR and placed order rate heavily. A high-volume, low-AOV brand should focus on click rate and unsubscribe rate as leading indicators of list health. Use the right benchmarks for your context.
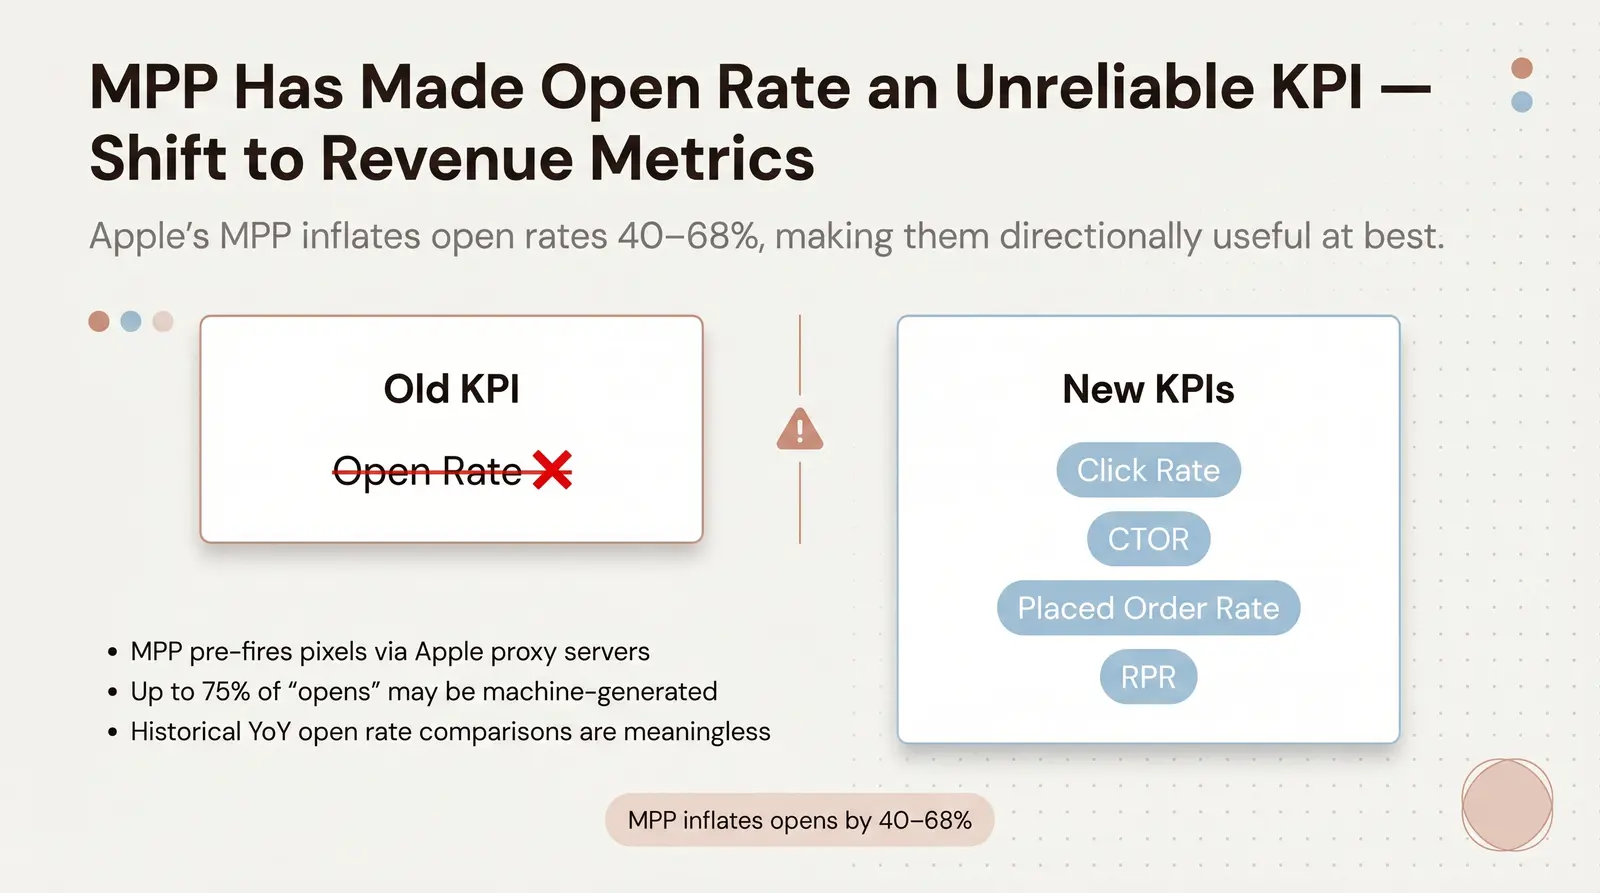
Before diving into the numbers, you need to understand the Apple Mail Privacy Protection (MPP) problem. Launched in late 2021 with iOS 15, MPP fundamentally altered how email opens are tracked, and its effects are still distorting benchmarks in 2026.
Apple pre-loads email tracking pixels through its proxy servers, firing an "open" event even when the user never actually views the email [1]. A newsletter that historically maintained a 28% open rate might suddenly report 55% engagement without any change in actual reader behavior [1]. Industry estimates suggest that MPP inflates open rates by 40% to 68% for Apple Mail users, meaning that up to 75% of recorded email opens may now be machine-generated rather than human-initiated [2]. This artificial inflation makes historical year-over-year open rate comparisons largely meaningless.
The open rate is no longer a hard key performance indicator (KPI). It serves as a directional metric or a basic pulse check for deliverability. If your open rates plummet, you likely have a spam folder issue. But a high open rate does not guarantee engagement, and it does not correlate directly with revenue.
To measure true performance in 2026, ecommerce operators must prioritize metrics tied to intentional actions:
Click Rate is the percentage of delivered emails that received at least one click. This tells you whether your email content and calls-to-action are compelling enough to drive traffic.
Click-to-Open Rate (CTOR) is the percentage of openers who clicked a link. While slightly skewed by MPP, CTOR remains useful for evaluating your email design and copy effectiveness.
Placed Order Rate is the percentage of recipients who completed a purchase after receiving the email. This is the ultimate measure of campaign success, linking email activity directly to revenue.
Revenue Per Recipient (RPR) is the total revenue generated divided by the number of emails delivered. RPR gives every email a clear financial value, allowing you to calculate the true ROI of your email marketing.
Unsubscribe Rate is the percentage of recipients who opted out after receiving an email. A sudden spike signals that your content is no longer relevant, your frequency is too high, or your audience expectations are not being met.
The most striking trend in 2026 is the widening gap between scheduled campaigns and automated flows.
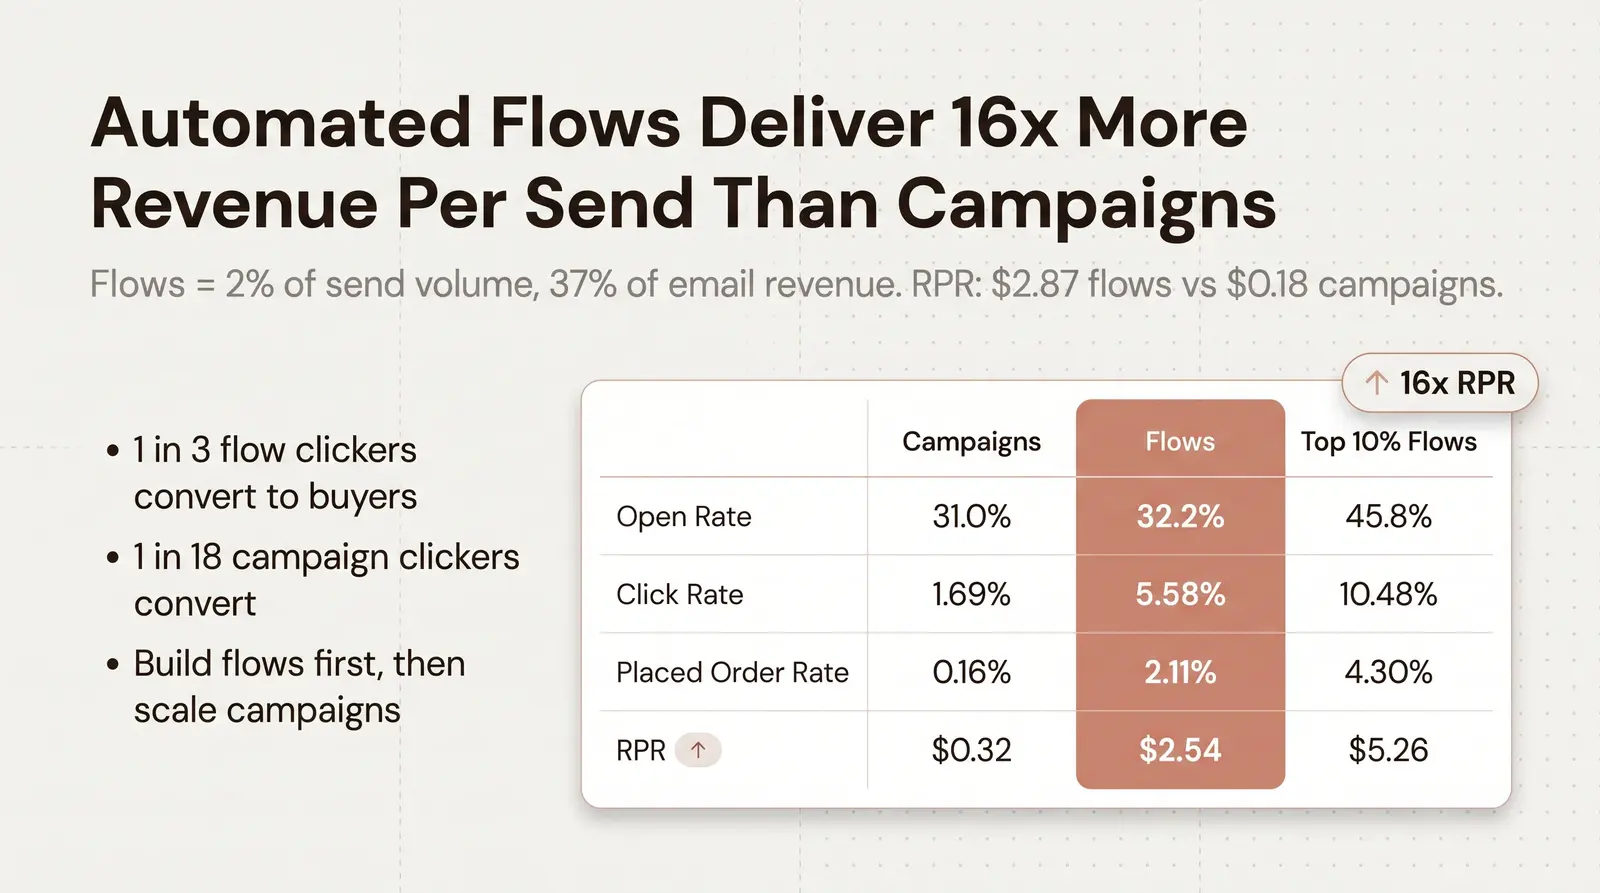
Automated emails account for just 2% of total email send volume, yet they generate 37% of all email-driven revenue [3]. One in three people who click on an automated message proceed to make a purchase, compared to just one in 18 for scheduled campaigns [3]. The average revenue per email for automated sends reached $2.87 in 2025, compared to $0.18 for scheduled campaigns [4]. That is a 16x difference in financial return per send.
For ecommerce operators, this data presents a clear mandate: build and optimize your core automated flows before investing heavily in daily or weekly newsletters. Campaigns are still necessary for brand awareness and major promotions, but flows are the true engine of sustainable, scalable revenue.
| Metric | Scheduled Campaigns (Average) | Automated Flows (Average) | Top 10% Flows |
|---|---|---|---|
| Open Rate | 31.0% | 32.2% | 45.8% |
| Click Rate | 1.69% | 5.58% | 10.48% |
| Placed Order Rate | 0.16% | 2.11% | 4.30% |
| Revenue Per Recipient | $0.32 | $2.54 | $5.26 |
Source: Klaviyo, 2026 benchmark analysis of 183,000+ brands [5] [6].
Automated flows deliver click rates more than three times higher than campaigns, and placed order rates over 13 times higher. The RPR for flows is nearly eight times that of a standard campaign send. These are not statistical anomalies. They are a direct reflection of the power of context. When an email arrives exactly when a customer is thinking about a product, the friction to convert drops dramatically.
Scheduled campaigns remain essential for brand building, product launches, and major sales events. But performance varies significantly across retail verticals. What constitutes a strong open rate for a jewelry brand looks very different from the benchmark for a food and beverage company.
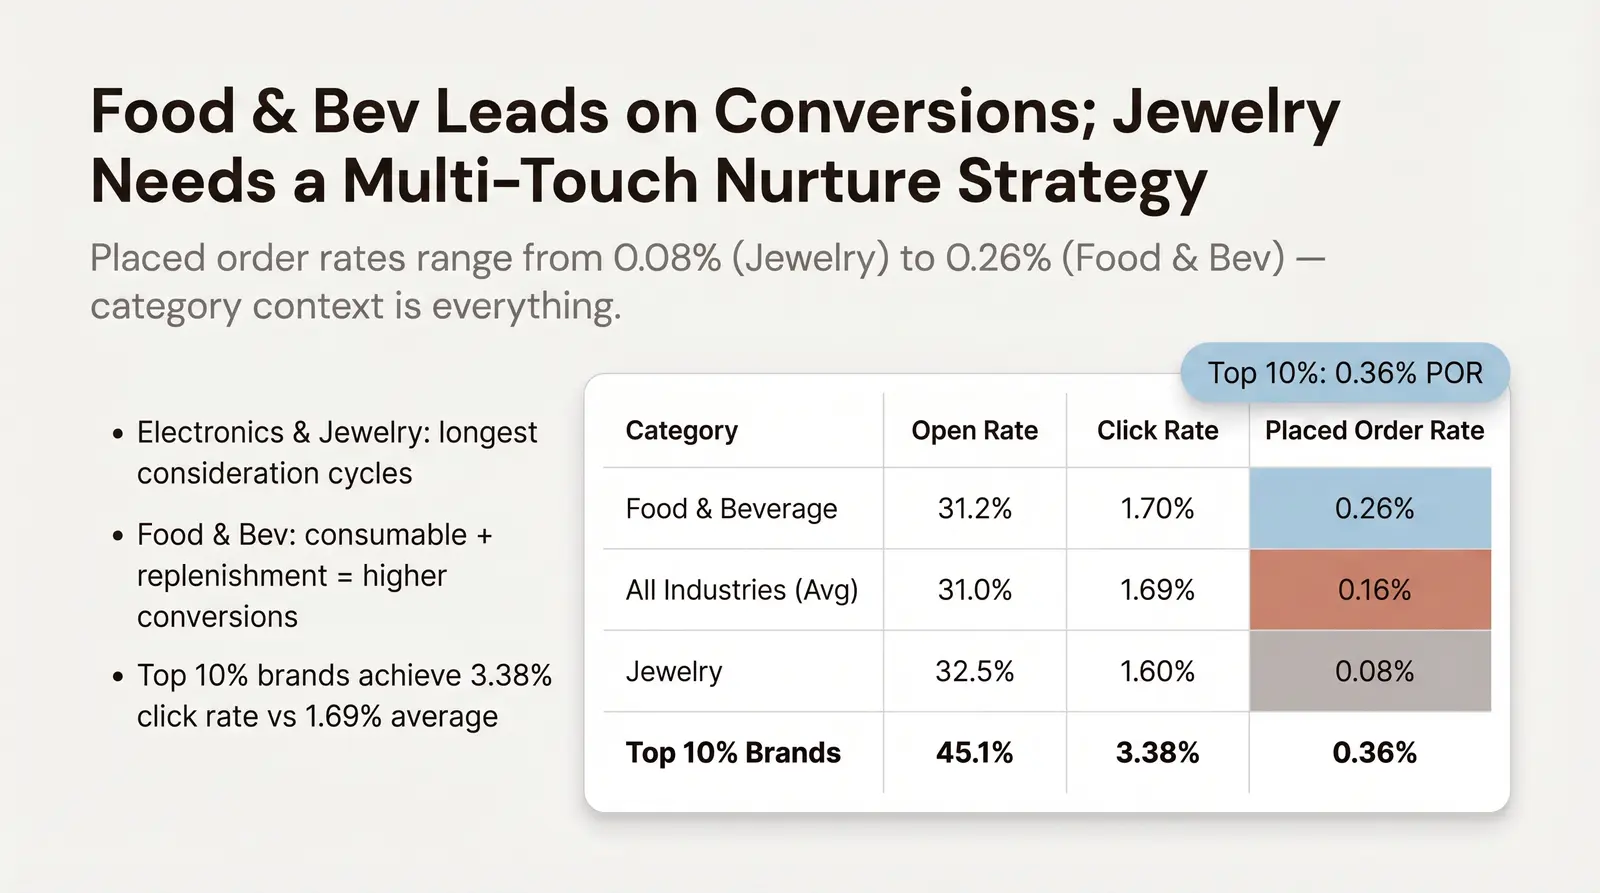
The table below breaks down average campaign performance by industry category [6].
| Industry Category | Avg. Open Rate | Avg. Click Rate | Avg. Placed Order Rate |
|---|---|---|---|
| Clothing and Accessories | 33.1% | 1.83% | 0.12% |
| Health and Beauty | 30.5% | 1.24% | 0.19% |
| Jewellery | 32.5% | 1.60% | 0.08% |
| Home and Garden | 32.5% | 1.78% | 0.13% |
| Food and Beverage | 31.2% | 1.70% | 0.26% |
| Sporting Goods | 31.9% | 1.88% | 0.11% |
| Electronics | 29.3% | 1.85% | 0.09% |
| Toys and Hobbies | 31.7% | 2.03% | 0.19% |
| All Industries (Average) | 31.0% | 1.69% | 0.16% |
| All Industries (Top 10%) | 45.1% | 3.38% | 0.36% |
The Food and Beverage category leads on placed order rate (0.26%), which reflects the consumable nature of the products and the effectiveness of replenishment and time-sensitive promotions. Electronics and Jewellery show the lowest placed order rates (0.09% and 0.08%), reflecting longer consideration cycles and higher price points. Consumers in these categories use emails for research and comparison, not impulse buying.
For founders building a jewelry or accessories brand, the 32.5% open rate indicates strong audience interest. The lower placed order rate simply means you need a multi-touch email strategy that nurtures the customer through the consideration phase. Detailed product information, styling inspiration, and social proof build the confidence needed to drive the eventual sale. Understanding your Branvas Catalog and setting realistic expectations for each product tier is the right starting point.
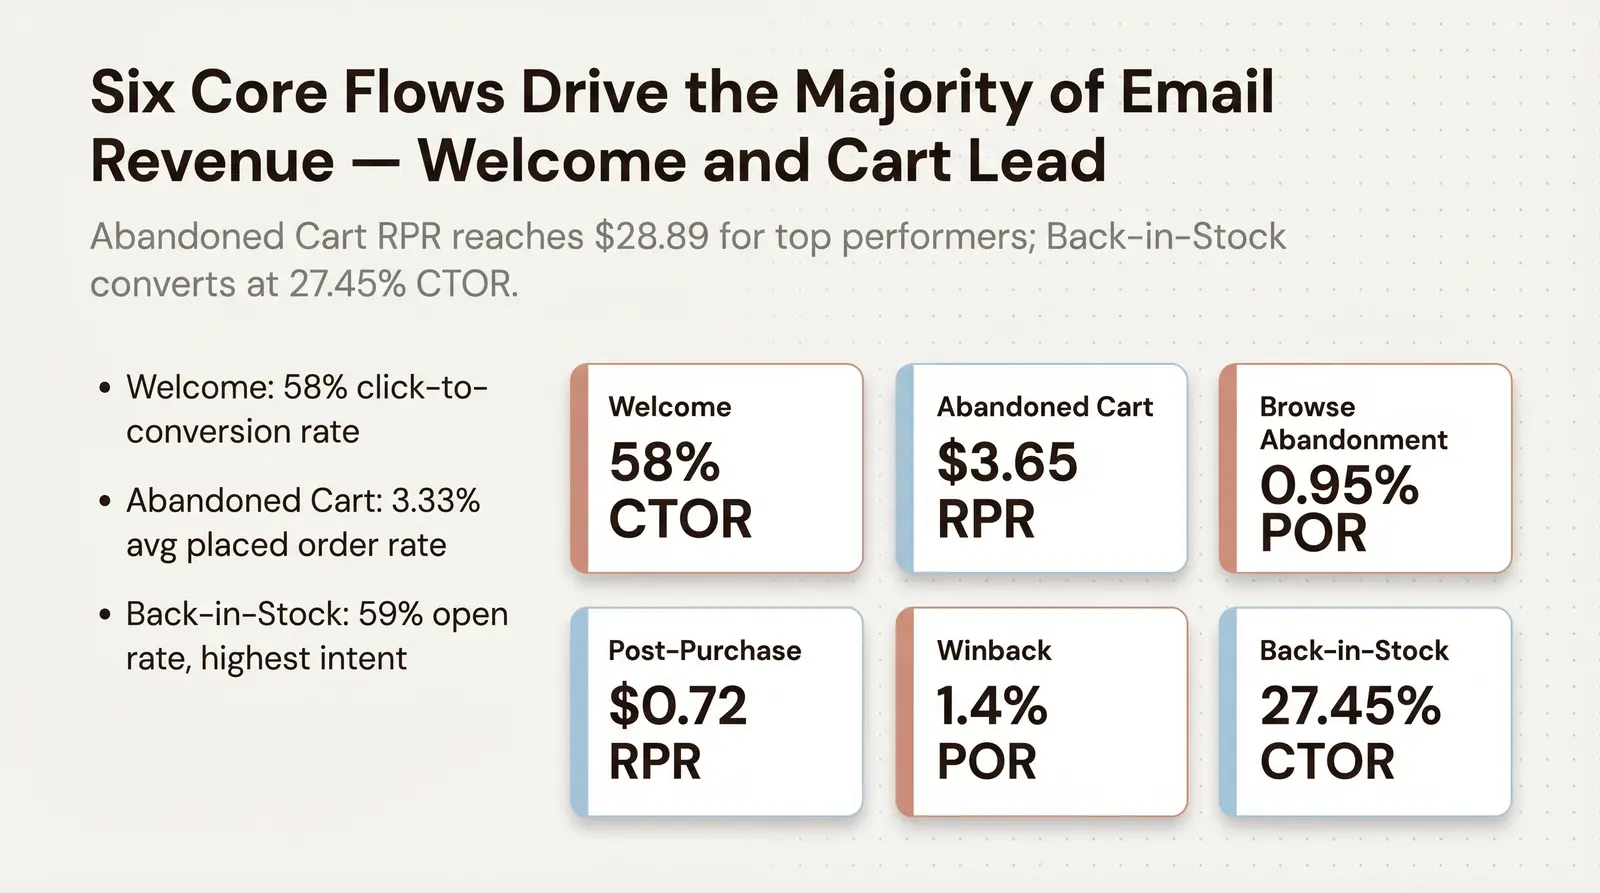
Automated flows are where ecommerce email marketing becomes a genuine revenue system. The following benchmarks cover the six core flows that drive the majority of email-attributed revenue in 2026.
The welcome series is your first impression and often your most lucrative acquisition tool. Sent immediately after a user subscribes, these emails capitalize on peak interest and establish the tone for your ongoing relationship with the customer. A well-crafted welcome series introduces your brand story, highlights your best-selling products, and sets expectations for future communications.
| Metric | Average | Top 10% |
|---|---|---|
| Open Rate | 41.92% | N/A |
| Click Rate | 5.54% to 6.11% | N/A |
| Placed Order Rate | 2.32% | N/A |
| Click-to-Conversion Rate | 58.26% | N/A |
Sources: Omnisend 2025 [7], Klaviyo 2026 [6] [8].
The click-to-conversion rate is the standout figure here. More than half of the users who click a link in a welcome email go on to make a purchase. This underscores the importance of a strong, clear CTA and an enticing initial offer. To maximize this flow, segment your welcome series based on the source of the signup. A user who subscribes via a popup offering 10% off has different intent than a user who subscribes during checkout. Tailoring the messaging to these specific entry points can significantly lift your placed order rate.
Abandoned cart flows target high-intent shoppers who added items to their cart but failed to complete checkout. These messages are the ultimate revenue recovery mechanism, capturing sales that would otherwise be lost to distraction, comparison shopping, or unexpected shipping costs.
| Metric | Average | Top 10% |
|---|---|---|
| Open Rate | 50.5% | 65.34% |
| Click Rate | 6.25% | 13.33% |
| Placed Order Rate | 3.33% | 7.69% |
| Revenue Per Recipient | $3.65 | $28.89 |
Source: Klaviyo, 2024 Abandoned Cart Benchmark Report [9].
Top-performing brands see abandoned cart RPR soar to $28.89, with placed order rates hitting 7.69%. The effectiveness of this flow makes it non-negotiable for any serious ecommerce operation. To reach top-tier benchmarks, optimize the timing of your messages. Sending the first reminder within an hour of abandonment typically yields the best results, followed by a second reminder 24 hours later. Dynamic product blocks that display the exact items left behind, with clear images and pricing, remove friction and make it easy for the customer to complete the purchase.
Browse abandonment emails reach users who viewed specific products but left the site without adding anything to their cart. The intent is lower than cart abandonment, but the volume of eligible recipients is much higher, making this flow a critical component of a comprehensive email strategy.
| Metric | Average |
|---|---|
| Placed Order Rate | 0.95% |
| Click-to-Conversion Rate | ~15.9% |
Sources: Klaviyo 2024 [8], Drip 2024 [10].
These emails perform best when they include personalized product recommendations or highlight the specific items viewed. Focus on providing value rather than just pushing for a sale. Customer reviews, product benefits, and a small incentive can encourage the user to return. By addressing potential objections and providing a seamless path back to the product page, you can meaningfully increase your placed order rate.
The post-purchase flow triggers after a completed order. Its primary goals are to reduce buyer's remorse, provide shipping updates, and encourage repeat purchases or cross-sells. This flow is your opportunity to turn a one-time buyer into a loyal customer.
| Metric | Average |
|---|---|
| Placed Order Rate | 0.54% |
| RPR (Mid-Market, AOV $83-$112) | $0.24 to $0.72 |
| RPR (Mid-Market, AOV $112-$163) | $0.29 to $1.30 |
Sources: Klaviyo 2024 [8], Klaviyo Help Center 2026 [11].
While the immediate conversion rate is lower than pre-purchase flows, post-purchase emails are vital for increasing Customer Lifetime Value (CLV). To maximize impact, segment your audience based on purchase history. A first-time buyer requires a different approach than a repeat customer. Timing is also crucial. Sending a cross-sell email too soon after a purchase can feel pushy, while waiting too long misses the window of peak brand affinity.
Winback flows target dormant customers who have not made a purchase in a specified timeframe, typically 3, 6, or 12 months. These campaigns are essential for maintaining a healthy email list and maximizing the value of your existing customer base.
| Metric | Average |
|---|---|
| Open Rate | 30% to 35% |
| Click Rate | 4.0% |
| Placed Order Rate | 0.9% to 1.4% |
Source: Klaviyo Community [12].
Re-engaging a past customer is generally more cost-effective than acquiring a new one. A well-timed winback email, featuring a significant discount or highlighting new product lines, can successfully reactivate a portion of your dormant list. Consider a tiered incentive structure: start with a gentle reminder and a small discount, and gradually increase the offer if the customer remains unengaged. Clearly communicating the value proposition of your brand and highlighting recent improvements or new launches can reignite their interest.
Back-in-stock alerts are highly targeted messages sent to users who explicitly requested notification when a sold-out item becomes available. These emails capitalize on existing demand and create urgency, driving immediate action from highly motivated buyers.
| Metric | Average |
|---|---|
| Open Rate | 59.19% |
| Conversion Rate | 5.34% |
| Click-to-Conversion Rate | 27.45% |
Source: Omnisend 2025 [7].
Because these users have already demonstrated strong purchase intent for a specific product, back-in-stock emails deliver some of the highest conversion metrics across all flow types. Ensure that the notification process is seamless. Display a clear "Notify Me" button on sold-out product pages and capture the user's email address with minimal friction. When the item is restocked, send the alert immediately to capitalize on their interest before they find an alternative.
Within a multi-email flow, performance typically degrades with each subsequent send. Understanding this pattern helps you set realistic expectations and optimize the structure of your sequences.
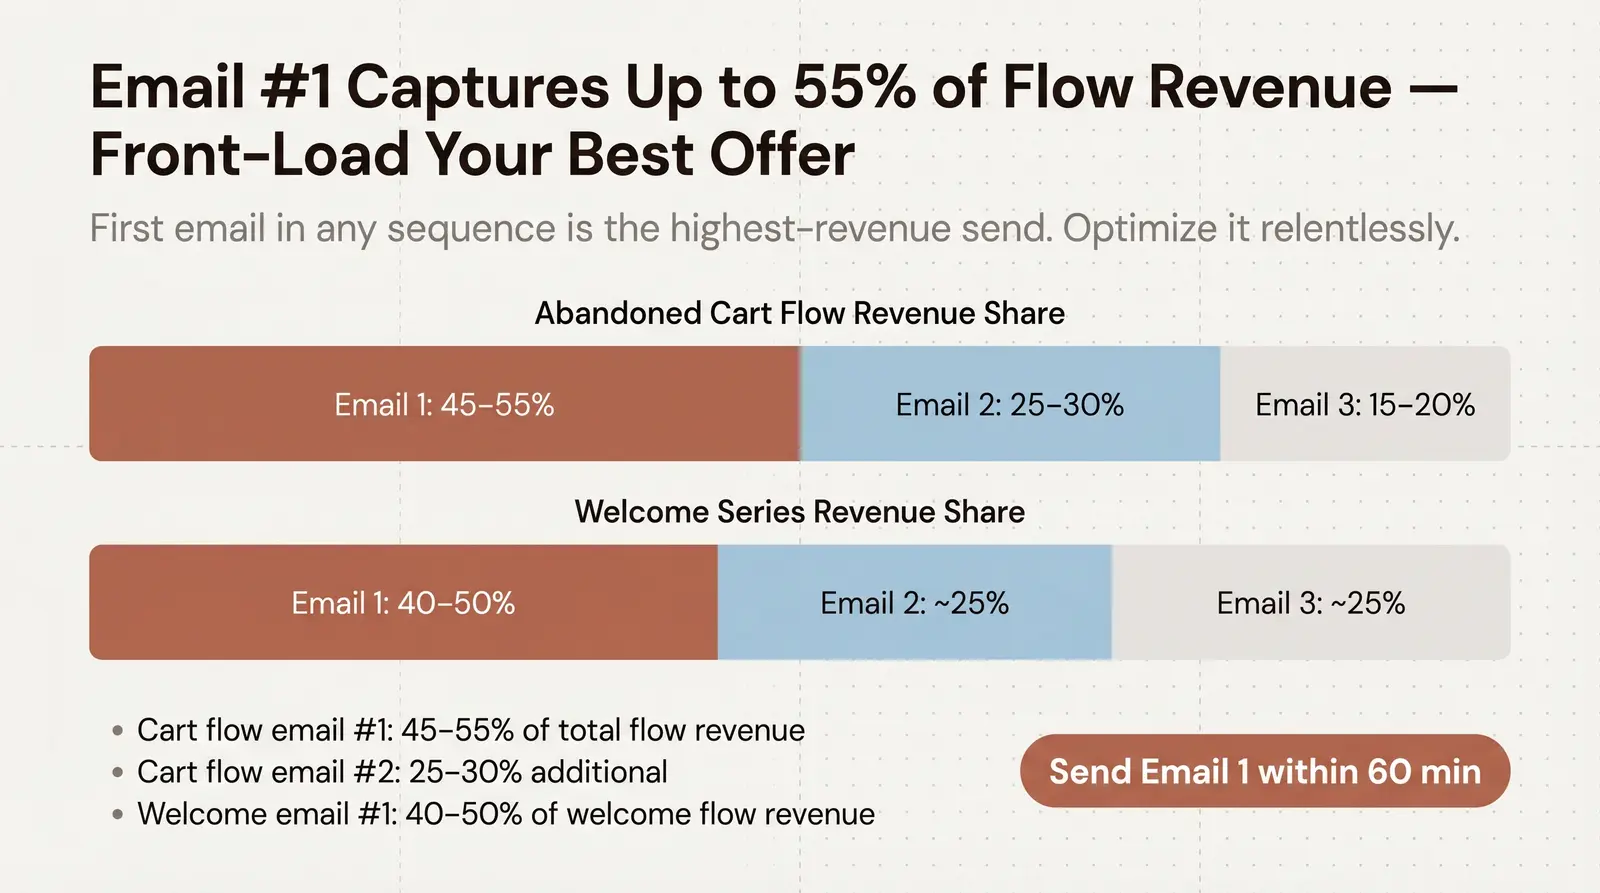
For abandoned cart flows, the first email in the sequence consistently outperforms subsequent sends. The first email typically captures 45% to 55% of the total revenue generated by the entire flow [9]. The second email, sent 24 hours later, captures an additional 25% to 30%, while the third email (typically sent 3 to 5 days later) accounts for the remaining 15% to 20%. This pattern reinforces the importance of sending the first email quickly, ideally within 30 to 60 minutes of abandonment, when the customer's intent is still high.
For welcome series, the pattern is similar but less steep. The first email in a three-email welcome series typically generates 40% to 50% of the total flow revenue, with the second and third emails contributing roughly equally to the remainder [6]. The implication is clear: your first email in any sequence must be your strongest. It should deliver the most compelling offer, the clearest value proposition, and the most prominent CTA.
For winback flows, the opposite dynamic can sometimes apply. The third or fourth email in a winback sequence, which often contains the highest-value offer, may outperform the earlier emails simply because the most motivated customers have already re-engaged, leaving only the most discount-sensitive segment for the later sends.
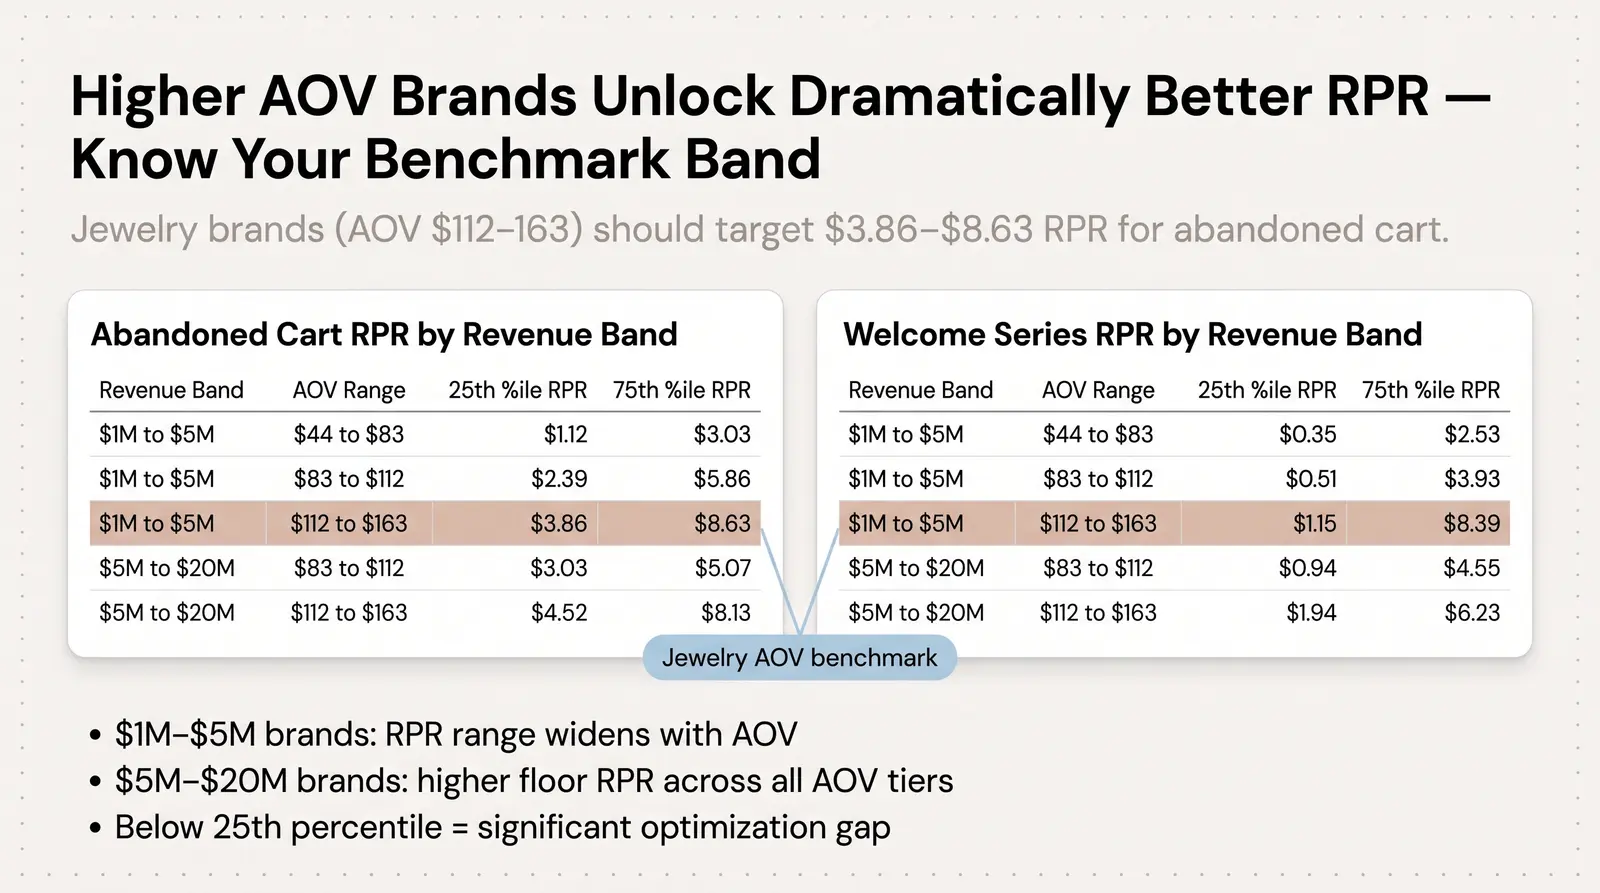
For brands that want to benchmark their RPR against businesses of a similar size, Klaviyo provides flow performance data segmented by annual revenue and average order value (AOV) [11].
| Annual Revenue | AOV Range | 25th Percentile RPR | 75th Percentile RPR |
|---|---|---|---|
| $1M to $5M | $44 to $83 | $1.12 | $3.03 |
| $1M to $5M | $83 to $112 | $2.39 | $5.86 |
| $1M to $5M | $112 to $163 | $3.86 | $8.63 |
| $5M to $20M | $83 to $112 | $3.03 | $5.07 |
| $5M to $20M | $112 to $163 | $4.52 | $8.13 |
| Annual Revenue | AOV Range | 25th Percentile RPR | 75th Percentile RPR |
|---|---|---|---|
| $1M to $5M | $44 to $83 | $0.35 | $2.53 |
| $1M to $5M | $83 to $112 | $0.51 | $3.93 |
| $1M to $5M | $112 to $163 | $1.15 | $8.39 |
| $5M to $20M | $83 to $112 | $0.94 | $4.55 |
| $5M to $20M | $112 to $163 | $1.94 | $6.23 |
These revenue-band benchmarks are particularly useful for brands with higher AOVs, such as jewelry and accessories. A jewelry brand with an AOV of $112 to $163 should expect its welcome series to generate between $1.15 and $8.39 RPR, depending on the quality of its email program. If your RPR falls below the 25th percentile, there is a significant optimization opportunity.
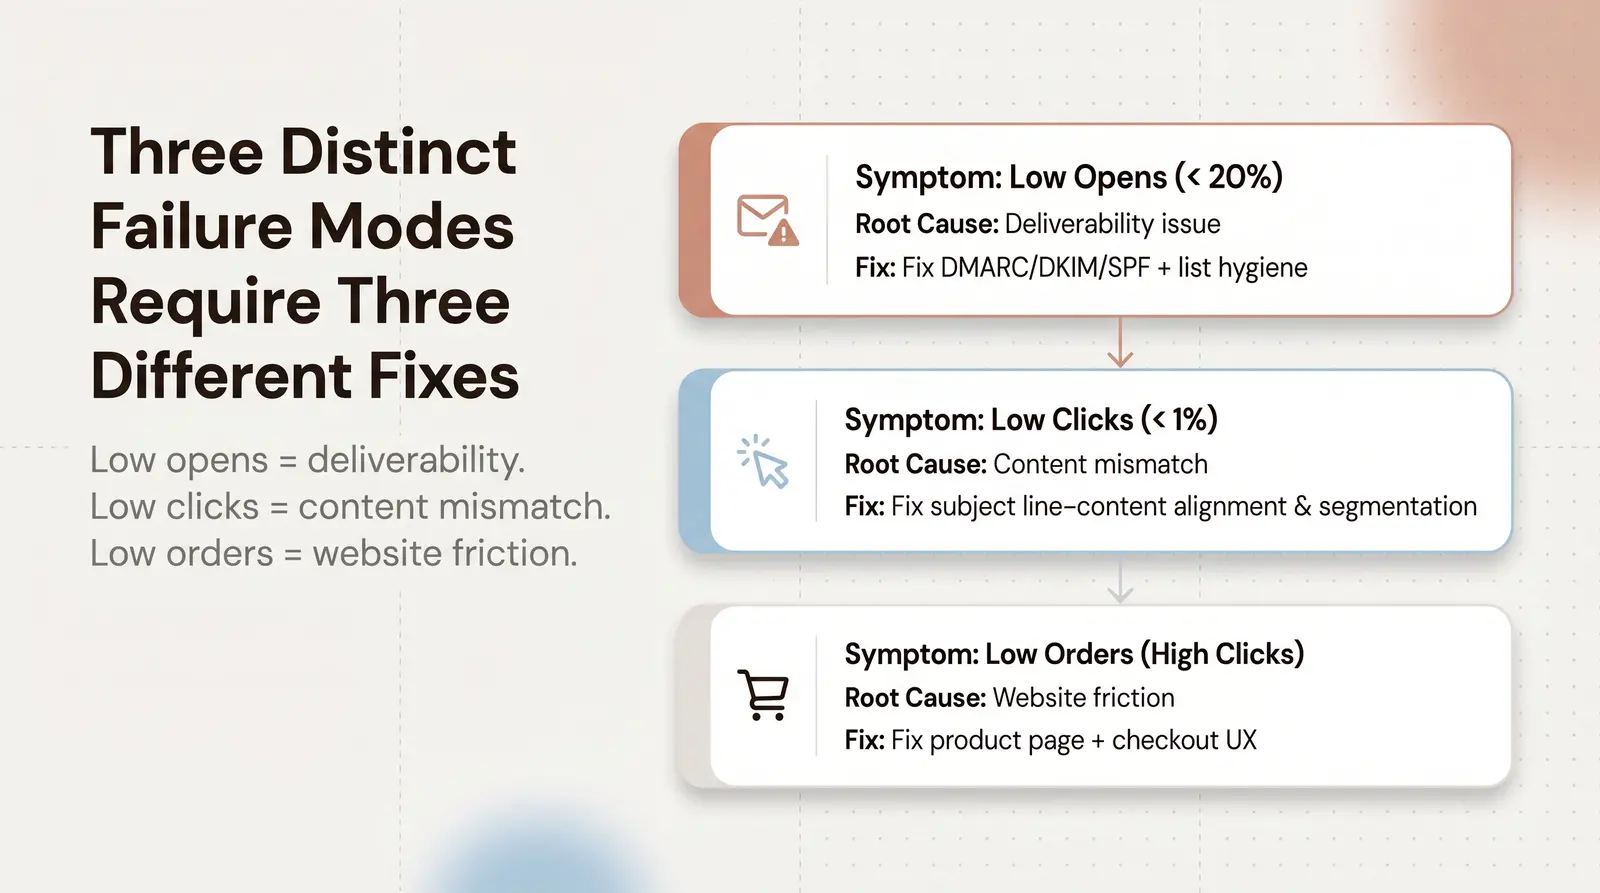
If your metrics fall significantly below these 2026 benchmarks, the data provides a clear roadmap for identifying where your email marketing funnel is breaking down.
Low open rates (consistently below 20%) typically signal a deliverability issue rather than a subject line problem. ISPs like Gmail and Yahoo are increasingly strict about sender reputation. Clean your list regularly, remove unengaged subscribers, and ensure your domain authentication protocols (DMARC, DKIM, SPF) are configured correctly. Continuing to send to inactive addresses will only further damage your sender reputation.
Low click rates (below 1% for campaigns or below 3% for flows) indicate that your content is not resonating with the audience that opened the email. This often reflects a mismatch between the subject line promise and the email content. Test different subject lines, improve your email design hierarchy, and ensure your CTAs are prominent and compelling. Segmenting your audience to deliver more relevant content is the most reliable lever for improving click engagement.
Low placed order rates despite healthy click rates mean the friction lies on your website, not in your email. If users are clicking through but abandoning their sessions, evaluate your product pages for clarity and trust signals. Simplify the checkout process, and ensure your pricing and shipping terms are competitive. You can use the Branvas Profit Calculator to ensure your margins allow for compelling email offers without sacrificing profitability.
For creators and influencers looking to monetize their audience without the operational headaches of inventory management, How Branvas Works provides a streamlined solution. Branvas handles sourcing, branding, and blind fulfillment, allowing you to focus on crafting engaging emails that drive revenue. Whether you are an established brand or just getting started, Branvas for Ecommerce and Boutique Store Owners provides the infrastructure to build a high-margin product line that integrates seamlessly into your existing automated flows. Review Branvas Pricing to see how the economics work.
Ultimately, the success of your email marketing program depends on your ability to deliver the right message to the right person at the right time. The data is clear: the future of ecommerce email belongs to those who prioritize relevance, personalization, and behavioral triggers over generic, mass-market campaigns.
While unsubscribe rate is often treated as a secondary metric, it is one of the most reliable early warning signals in email marketing. A rising unsubscribe rate tells you that something has changed: your content is no longer relevant, your frequency is too high, or your list quality has deteriorated.
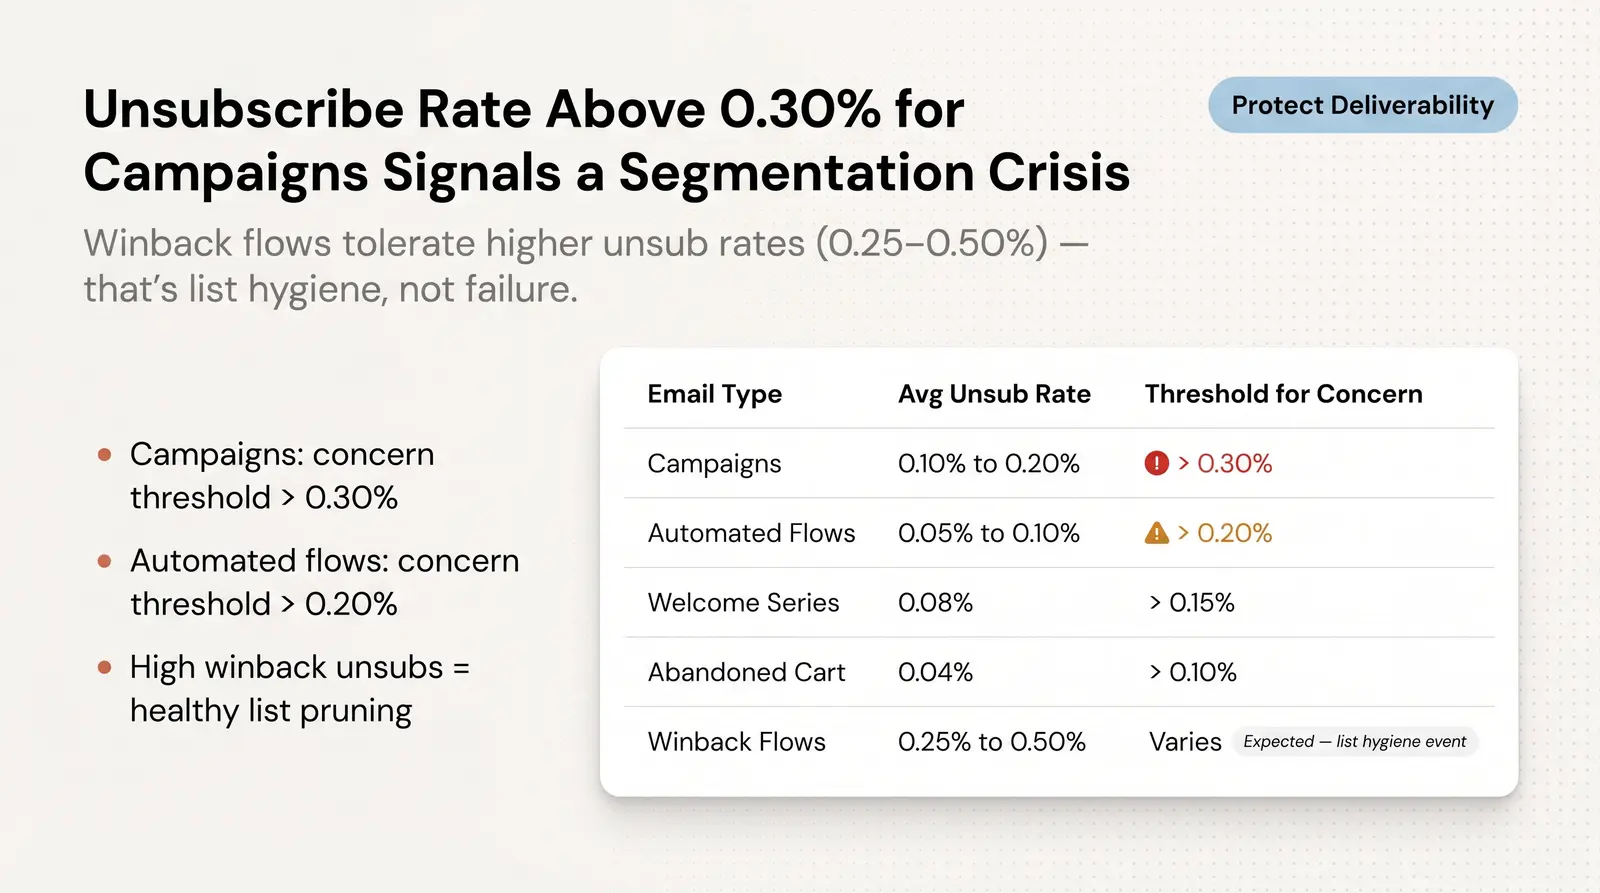
| Email Type | Average Unsubscribe Rate | Threshold for Concern |
|---|---|---|
| Campaigns (All Industries) | 0.10% to 0.20% | Above 0.30% |
| Automated Flows | 0.05% to 0.10% | Above 0.20% |
| Welcome Series | 0.08% | Above 0.15% |
| Abandoned Cart | 0.04% | Above 0.10% |
| Winback Flows | 0.25% to 0.50% | Varies by list age |
Sources: Klaviyo 2026 [6], Mailchimp 2025 [13].
Winback flows naturally carry higher unsubscribe rates because you are contacting dormant subscribers who may no longer want to hear from you. This is acceptable and expected. The goal of a winback flow is partly to re-engage active customers and partly to identify and remove permanently disengaged contacts from your list. A high unsubscribe rate during a winback sequence is not necessarily a failure; it is a list hygiene event.
For campaigns, an unsubscribe rate above 0.30% is a clear signal that your segmentation or content strategy needs attention. ISPs like Gmail use engagement signals, including unsubscribes, to determine whether your emails belong in the inbox or the spam folder. Keeping your unsubscribe rate low is not just about retaining subscribers; it is about protecting your deliverability for the entire list.
The benchmarks in this article are curated from aggregated data reports published by leading email service providers and marketing analytics firms between 2024 and 2026. Primary sources include Klaviyo's analysis of over 183,000 brands and 325 billion emails, Omnisend's review of 27 billion emails across 150,000 brands, and Mailchimp's industry statistics. Where specific 2026 data was unavailable, the most recent verified data from 2024 or 2025 was used to provide the most accurate current picture.
These benchmarks represent averages across a wide range of businesses, from emerging startups to established enterprise brands. Your specific performance will vary based on your product category, price point, audience demographics, and the maturity of your email marketing program. Use these figures as a baseline for evaluating your current strategy and identifying areas for optimization, not as absolute targets that must be hit at all costs.
[1] Beehiiv. (December 2025). Impact of Apple MPP on Open Rates (And What To Track Instead). https://www.beehiiv.com/blog/apple-mpp-open-rate
[2] Mailforge.ai. (2025). How Apple Mail Privacy Impacts Cold Email Tracking. https://www.mailforge.ai/blog/how-apple-mail-privacy-impacts-cold-email-tracking
[3] Omnisend. (2025). 2025 Ecommerce Marketing Report. https://www.omnisend.com/2025-ecommerce-marketing-report/
[4] Omnisend. (January 2026). Omnisend Study: Ecommerce Orders Doubled in 2025. https://www.omnisend.com/latest-news/omnisend-study-ecommerce-orders-doubled-in-2025-with-the-top-5-of-brands-driving-over-half-of-growth/
[5] Klaviyo. (2026). Email Marketing Benchmarks. https://www.klaviyo.com/products/email-marketing/benchmarks
[6] Klaviyo. (February 2026). Email marketing benchmarks 2026: open rates, click and conversion rates. https://www.klaviyo.com/uk/blog/email-marketing-benchmarks-open-click-and-conversion-rates
[7] Omnisend. (March 2025). How Marketing Agencies Can Drive More Revenue From Email. https://www.omnisend.com/blog/email-marketing-for-agencies/
[8] Klaviyo. (March 2024). 5 Steps to Improve Your Placed Order Rates. https://www.klaviyo.com/blog/5-steps-to-improve-placed-order-rate
[9] Klaviyo. (May 2024). Abandoned Cart Benchmark Report: Rates and Statistics. https://www.klaviyo.com/blog/abandoned-cart-benchmarks
[10] Drip. (November 2023). The Drip Marketing Automation Report 2024. https://www.drip.com/blog/marketing-automation-report
[11] Klaviyo. (February 2026). Benchmarks for flow emails reference. https://help.klaviyo.com/hc/en-us/articles/360033669452
[12] Klaviyo Community. (2022). Winback Flow Benchmarks. https://community.klaviyo.com/marketing-30/winback-flow-benchmarks-5148
[13] Mailchimp. (2025). Email Marketing Benchmarks and Statistics by Industry. https://mailchimp.com/resources/email-marketing-benchmarks/